Antioxidant Potential and Antimicrobial Activity of Ailanthus altissima (Mill.) Swingle Extracts against Pseudomonas aeruginosa
1Laboratory of Functional Physiology and valorisation of bioressources, High Institute of Biotechnology of Beja, University of Jendouba, Tunisia
2Central Laboratory of the Institute of Arid Areas of Medenine, Medenine, Tunisia
- *Corresponding Author:
- Nadhem Aissani
Laboratory of Functional Physiology and valorisation of bioressources
High Institute of Biotechnology of Beja
University of Jendouba, Tunisia
Tel: 00216 58 617 557
E-mail: aissaninadhem@gmail.com
Received date: May 08, 2018; Accepted date: May 29, 2018; Published date: June 09, 2018
Citation: Aissani N, Jabri MA, Mabrouk M, Sebai H (2018) Antioxidant Potential and Antimicrobial Activity of Ailanthus altissima (Mill.) Swingle Extracts against Pseudomonas aeruginosa. J Mol Biol Biotech Vol.3 No.1:3
Abstract
In recent years, there has been an important development in the search for new natural compounds aimed at replacement of currently antimicrobial and antioxidant chemicals. Ailanthus altissima offers a natural promising alternative for food safety and bioconservation as well as for its antioxidant properties. Total phenolic, flavonoids and tannic compounds values of methanol and water from bark and wood were determined. We demonstrated that aqueous and methanolic extracts of wood and bark of A. altissima were riche in phenols, flavonoids and tannic compounds with higher amount in wood aqueous extract (WAE). The chemical analysis of this latter by High-Performance Liquid Chromatography (HPLC-DAAD) with Diode-Array Detection showed the richness of this extract of phenolic compounds which the most abounded were quinic acid and syringic acid. The antioxidant activity was evaluated using 1,1-diphenyl-2-picrylhydrazyl (DPPH), 2,2'-azino-bis(3-ethylbenzothiazoline-6-sulphonic acid (ABTS), iron reducing power tests and on antioxidant enzymes such superoxide dismutase (SOD) and catalase (CAT) activities. WAE presented the highest antioxidant activity with an IC50 of 122 ± 0.7, 201 ± 1.3 and 140 ± 0.9 µg/mL using DPPH, ABTS and iron reducing capacity tests respectively. As expected, all extracts enhanced the SOD and CAT activity with the best result recorded for WAE. The antimicrobial activity of aqueous and methanolic extracts of wood and bark of A. altissima was assessed against a set of Gram-positive and Gram-negative bacteria using disc diffusion and broth micro dilution methods. We showed for the first time the antimicrobial activity of WAE against Pseudomonas aeruginosa with a MIC of 10.46 mg/mL. Taking into account these results, A. altissima wood aqueous extract can be used as a promising natural antimicrobial and antioxidant tool
Keywords
Pseudomonas aeruginosa; SOD; CAT; Free radical scavenging; Minimum inhibitory concentration; Proline dehydrogenase
Introduction
There is an increased public and scientific need to conduct research on the bactericidal efficiency of phytochemicals and other natural substances as viable alternatives to pharmaceutical and chemical antibiotics which can cause bacterial resistance.
Natural products are important to devise new drugs and providing unique ideas in microbial treatment and facing natural oxidation [1,2]. These activities are due to secondary metabolites such as the volatile constituents and polyphenols, which are a class of higher plant secondary metabolites known for the antioxidant activity of the aromatic ring structure bearing hydroxyl groups [3].
Ailanthus altissima (Mill.) swingle, commonly known as “tree of heaven”, is a deciduous tree of the Simaroubaceae family. It is native to northeast and central China and was introduced in mediterranean area as a street tree at the end of the 18th century. The tree of heaven has already been used in traditional medicine in many parts of Asia, including China, while the bark and leaves are being used for their bitter-tonic, astringent, vermifuge, and antitumoral properties [4]. Various chemical compounds were reported in this plant such as quassinoids, alkaloids, lipids and fatty acids, volatile and phenolic compounds, flavonoids, and coumarins [4]. Ailanthone extracted from seeds turned out to be a potent antifeedant and insect growth regulator [5]. Caboni et al. showed the nematicidal activity of the two aldehydes (E,E)- 2,4-decadienal and (E)-2-decenal extracted by methanol from A. altissima wood against the Root Knot Nematodes Meloidogyne javanica [6].
In this work, total phenolic, flavonoids and tannic contents of wood and bark aqueous and methanolic extracts of A. altissima were determined. Antioxidant properties using different methods as well antimicrobial activity of the extracts were likewise assessed. Result showed that A. altissima wood aqueous extract can be used as a promising natural antimicrobial and antioxidant tool.
Materials and Methods
Plant material
Wood and bark of A. altissima were collected in January 2016 from Bousalem, north-west of Tunisia, and were dried in the absence of light at room temperature and until next use they were sealed in bags and stored at room temperatures in dark. Voucher specimens were deposited in the Laboratory of Functional Physiology and Valorisation of Bioressources, High Institute of Biotechnology of Beja-Tunisia, for species identification. 100 g of dried wood and bark were ground and extracted with methanol or water (1:10, w/v) in a shaker apparatus for 24h, filtered through a Whatman no. 40 filter paper, and centrifuged for 15min at 37788.4g and used for total phenolic, flavonoids, tannic content determination, antimicrobial and antioxidant assessment.
Total phenolic content determination
The level of total phenols in the crude extracts was determined by using Folin–Ciocalteu reagent and external calibration with gallic acid. Briefly; 0.125mL of extract solution and 0.125 mL of Folin–Ciocalteu reagent were added to 0.5 mL of distilled water and the contents mixed thoroughly [7]. After 4 min, 1 mL of 15% Na2CO3 was added, and then the mixture was allowed to stand for 2 h at normal temperature. The absorbance was measured at 760 nm using spectrophotometer (Thermo Fisher Scientific, model 4001/4, Abington, MA, United States). The concentration of the total phenolics was calculated as mg of gallic acid equivalent in dry extract (mg GAE/g dry extract) by using an equation obtained from gallic acid calibration curve. The determination of total phenolic compounds in the extracts was carried out in triplicate and the results were averaged.
Total flavonoid content determination
Total flavonoid contents of extracts were determined by using the aluminium chloride colorimetric method as described by Willet with some modifications [8]. Aqueous or methanolic extracts (0.2 mL), 10% aluminium chloride (0.15 mL), 1 M potassium acetate (0.1 mL) and distilled water (2.05 mL) were mixed. After incubation at room temperature for 30 min, the absorbance was measured at 510nm using spectrophotometer (Thermo Fisher Scientific, model 4001/4). Quercitin was used to make the calibration curve. The concentration of the total flavoinoids was calculated as mg of Quercitin equivalent in dry extract (mg QE/g dry extract). The calculation of total flavonoids in the extracts was carried out in triplicate and the results were averaged.
Total tannin content determination
Total condensed tannin content was determined according to the method of Sun et al. [9] to 0.05 mL of extract, 3 mL of 4% vanillin and 1.5 ml of H2SO4 70% were added. The mixture was allowed to stand for 15 min, and absorption was measured at 500 nm against methanol as a blank. Catechin was used to make the calibration curve and the total tannic content was calculated as mg of Catechin equivalent in dry extract (mg CA/g dry extract) in triplicate and averaged.
HPLC analysis
Phenolic compounds were determined using a modification of a previously described HPLC technique. 14 An Agilent 1100 series HPLC system, provided with a diode array detector (DAD) model G 1315 A, an G 1313 A autosampler, and a G 1311 A pump, was used. The separation was achieved on a Waters Spherisorb 5 μm (ODS2 250 mm × 4.6 mm) at 40°C. The mobile phase consisted of (A) aqueous phosphoric acid (0.22 M) and (B) acetonitrile. The solvent gradient started at 10% A reaching 35% A in 20min, and 100% A in 60 min followed by post-time isocratic conditions for 10 min at 10% A before the next injection. The flow rate was 1 mL/min, and the injection volume was 10 μL. The monitoring wavelengths were 280 and 350 nm with a scan from 200 to 600 nm. The identification of each compound was based on a combination of retention time and spectral matching with reference phenolics. Quantification of the identified phenolic compounds was performed by correlating the measured peak area with the calibration curves obtained with reference compounds (0.5, 5, 20, 50, 100 and 1000 μg/mL) (Figure 1).

Figure 1: Quantification of the identified phenolic compounds
Antioxidant assay
DPPH radical scavenging activity: The antiradical activity of the extracts was evaluated by the scavenging of the free anionic DPPH radicals as described by Gyamfi et al. [10]. Briefly, 50 μl of the extracts were mixed with 1 ml of 0.1 mM DPPH (2,2-diphenylhydrazil)-methanol solution and 0.45 ml of 50 mM Tris–HCl buffer (pH7.4). After 30 min incubation period at room temperature in the dark, the absorbance of the resulting solution and blank (with same reagents except the samples) was recorded at 517 nm against ascorbic acid as positive control [1]. Three replicates of samples were recorded. The percentage of inhibition of DPPH free radicals was calculated with Asample is the absorbance of the compound and Ablank the absorbance of the control solution. The IC50 value, which represented the concentration of the tested extracts that caused 50% reduction of the initial DPPH concentration, was calculated from a nonlinear regression curve of log concentration of tested extract (μg/mL) against the mean percentage of the radical scavenging activity.
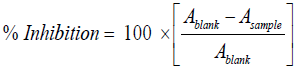 (1)
(1)
ABTS radical-scavenging activity
A second functional assay was also used based on the cationic ABTS radical-scavenging activity [11]. The radical was generated by reacting 7 mM ABTS (2,2'-azino-bis(3-ethylbenzothiazoline-6- sulphonic acid)) and 2.45 mM potassium persulfate for 16 h at room temperature in the dark, then diluted to get an absorbance of 0.70 ± 0.02 at 734nm. 50 μL of the sample was added to 950μL of the ABTS solution and incubated for 10 min. The absorbance recorded at 734 nm against a methanol blank was compared to the antiradical potency of Trolox, used as a reference.
Iron reducing power
Another reaction pathway in electron donation is reduction of an oxidized antioxidant molecule to regenerate the “active” reduced antioxidant. The reducing power of the extracts was determined according to the method of Oyaizu [12]. Various concentrations of A. altissima extracts (200 μL) were mixed with 500 μL of 200 mmol/L Na3PO4 buffer (pH 6.6) and 2.5 mL of 1% potassium ferricyanide. The mixture was incubated at 50°C for 20 min; then, 2.5 mL of 10% trichloroacetic acid (w/v) were added, and the mixture was centrifuged at 650 rpm for 10 min. The upper layer (500 μL) was mixed with 500 μL deionized water and 100 μL of 0.1% ferric chloride, and absorbance was measured at 700 nm: higher absorbance indicates higher reducing power. The assays were carried out in triplicate, and the results are expressed as means ± standard deviations. The extract concentration that gave 0.5 absorbance (IC50) was calculated from a graph of absorbance at 700 nm against extract concentration. Ascorbic acid was used as the standard.
Antioxidant enzymes activities measurements
Assessment of SOD activity: SOD activity was determined using the method of Dieterich et al. [13]. Pyrogallol autoxidation by O2.- present in the air can be inhibited by the SOD scavenging of O2.-. Therefore, changes in pyrogallol autoxidation rate through the presence of SOD in the test samples allow the potency of inhibitors/activators to be assessed. Briefly, 1 ml of reaction contained 770 μl Tris-HCl diethylenetriaminepenta-acetic acid (DTPA) buffer pH 8.2 (0.05 mM Tris-HCl, 1 mM DTPA), 100 μl of test extract at different concentrations (20-200 μg/ml) and 30 μl of RBCL diluted 1:10. The samples were mixed and incubated for 5 min at room temperature. The reaction was initiated by the addition of pyrogallol (final concentration 80 μM) and the absorbance was immediately measured at 420 nm for 3 min. Control samples were prepared identically to the test samples without the extracts.
Many polyphenols are potential scavengers of O2.- [14]. Therefore; we tested the possible inhibitory effects of extracts on pyrogallol autoxidation without the presence of SOD. The reaction mixture (1 ml) contained 800 μl Tris-HCl DTPA buffer pH 8.2 (0.05 mM Tris- HCl, 1 mM DTPA) and 100 μl test extract. The reaction was initiated by the addition of pyrogallol (final concentration 80 μM) and the absorbance was immediately read at 420 nm for 3 min. Control samples were prepared identically to the test samples without the extracts.
The concentration of extract increasing SOD activity by 50% was determined through decrease in pyrogallol autoxidation rate.
Assessment of CAT activity: CAT activity was determined using the method of Aebi [15]. Changes in the levels of H2O2 decomposed through the presence of CAT in the test samples allow the potency of inhibitors/activators to be assessed. Briefly, 4 μl RBCL (diluted 1:40) in 67 mM sodium potassium phosphate (pH 7.4) and the extract at different concentrations (20-200 μg/ ml) were incubated at 37˚C for 10 min. Afterwards, H2O2 at a final concentration of 30 mM was added to each reaction mixture and the change in absorbance was immediately measured at 240 nm for 2 min. IC50 values were determined as the concentration of sample required to inhibit CAT activity by 50% as monitored through H2O2 decomposition. Sodium azide was used as positive control since it is a known inhibitor of CAT [16].
Microbiological assay: To assess the antimicrobial activity of A. altissima methanolic and aqueous extracts, the following microorganisms were used: Escherichia coli (ATCC 25922), Salmonella typhimurium (ATCC 14024), Pseudomonas aeruginosa (ATCC 9027) strains for Gram-negative, Listeria monocytogenes (ATCC 35152) and Staphylococcus. aureus (ATCC 25932) strains for Gram-positive. Susceptibility of the tested microorganisms to the extract was determined by employing the disc diffusion and broth microdilution methods. Briefly, 100 μL of bacterial culture (which has been adjusted to 108 CFU/mL), was used to lawn Muller Hinton agar plates (MH). For the disc diffusion test, sterile paper discs (6 mm Ø) were added of the test sample (10 μL) and placed onto the inoculated agar surface. After cultivation at 37°C for 24 h, the resulting inhibition zones diameters were measured using ampicillin as control. Inhibited microorganisms were then tested using the broth microdilution method to calculate the minimum inhibitory concentration (MIC). Working solutions were prepared by dilution in microplates at concentrations between 2.5 and 80 mg/mL. The bacterial suspensions were added in the microwells at a concentration of 105 CFU/mL. The plates were incubated aerobically at 37°C for 24 h. Bacterial growth was revealed by the presence of turbidity and a “pellet” on the well bottom. MICs were determined as the first well that did not produce a pellet. For the assessment of bacterial growth with and without inhibitor (WAE), a suspension of 103 CFU/ mL of the bacterium was made in which we added the desired concentration of WAE, and 0.1 μL was plated in MH agar plates. This action was repeated in different plates after dilutions every 3 h with reference to a control without extract. The bacterium was incubated overnight at 37°C, and then, the number of survived bacteria was counted.
Statistical analysis
All tests were run in triplicate and averaged. Means, standard errors, standard deviations, and degrees of significance (using Student's t test) were calculated from replicates within the experiments, and analyses were done using Microsoft Excel XP 2010. Differences of p<0.05 were considered to be significant.
Results
Total phenolic, flavonoids and tannin content determination
Spectrophotometric method is widely used and reported for the simple and rapid estimation of total phenolics, flavonoids and tannic content in plant extracts. The phenolic content in the extracts was evaluated using Folin–Ciocalteu method (Table 1). The content of total phenols in extracts, expressed as gallic acid equivalents (GAE), varied between 8.29 ± 0.3 and 48.91 ± 1.5 mg/g of dry extract and the highest concentration was found in wood aqueous extract with 48.91 ± 1.5 mg GAE/g of dry extract. The flavonoid content expressed as catechin equivalents: mg CA/g of dry extract showed that the highest quantity of flavonoid compounds was found in A. altissima wood aqueous extract (WAE) followed by bark aqueous extract with 31.20 ± 0.9 and 25.89 ± 0.8 mg CA/g of dry extract. The same results were noted for total tannic contents (Table 1). This is evident due to the solubility of these components in water. This is in concordance with the work of Luis et al. who found that high phenolic and flavonoid contents are present in hydroalcoholic and methanolic extracts of stalks and stems of A. alissima.
Table 1: Total phenolic, flavonoids and tannins content of different extracts from Ailanthus altissima. All values are reported as means ± SD (n=3)
| Plant part | ||||
|---|---|---|---|---|
| wood | bark | |||
| Extract solvant | methanol | water | methanol | water |
| total phenolic contenta | 10.29 ± 0.3 | 48.91 ± 1.5 | 16.87 ± 0.7 | 39.45 ± 1.1 |
| total flavonoid contentb | 8.32 ± 0.4 | 31.20 ± 0.9 | 15.53 ± 0.6 | 25.89 ± 0.8 |
| total tannic contentc | 4.56 ± 0.2 | 28.03 ± 0.8 | 9.36 ± 0.3 | 17.27 ± 0.5 |
a mg GAE/g dw; bmg QE/g dw; cmg CA/ g dw
HPLC analysis
The phenolic compounds of WAE were fractionated and analyzed by HPLC-DAD. The use of DAD allows not only the peak identification but also peak purity determination. The purity of all identified peaks in our experiments generally reached 1.00, and the corresponding chromatogram were obtained at 210 nm (Figure 2). These compounds were identified by comparison of the retention times and UV/visible spectra with the available standards corresponding peaks (Table 2). Ten phenolic compounds were found with quinic acid as the most abounded followed by syringic acid with 334436 ± 28463 and 68591 ± 1320 mg/L respectively. These results confirm the phenol content analysis.

Figure 2: HPLC chromatograms of the identified compounds
Table 2: HPLC-DAD analysis of WAE. All values are reported as means ± SD (n=3)
| Compound | Rt (min) | R2 | Concentration (mg/L) ± SD |
|---|---|---|---|
| Quinic Acid | 6.39 | 0.9998 | 334436 ± 28463 |
| Gallic Acid | 7.87 | 0.9995 | 1330 ± 130 |
| Protocatchuic Acid | 11.11 | 0.9981 | 9914 ± 260 |
| Caffeic Acid | 20.76 | 0.9996 | 352 ± 89 |
| Syringic Acid | 23.17 | 0.9985 | 68591 ± 1320 |
| P-Coumaric Acid | 32.58 | 0.998 | 459 ± 95 |
| Trans Frulic Acid | 41.07 | 0.9989 | 195 ± 45 |
| Apegenin-7-O-Glucoside | 67.48 | 0.9992 | 122 ± 29 |
| Cirsilineol | 99.09 | 0.9999 | 4 ± 0.3 |
| Acacetin | 101.46 | 0.9996 | 138 ± 32 |
Antioxidant assay
The DPPH radical has been widely used to test the ability of compounds as free-radical scavengers or hydrogen donors and to evaluate the antioxidant activity of plants extracts and foods. WAE exhibited a strong DPPH• scavenging effect of about 122 ± 0.7 μg/mL (Table 3). DPPH is believed to accept an electron and become a stable diamagnetic molecule [17]. It has been shown that many antioxidant molecules such as ascorbic acid (vitamin C), tocopherol (vitamin E), and flavonoids reduced DPPH due to their hydrogen donating ability, a property that may share A. altissima extract [18].
Table 3: Antioxidant activities of Ailanthus altissima extracts; All values are reported as means ± SD (n=3); IRC: Iron Reducing Capacity; WAE: Wood Aqueous Extract; BAE: Bark Aqueous Extract; BME: Bark Methanolic Extract; WME: Wood Methanolic Extract
| IC50 (µg/mL) | |||
|---|---|---|---|
| Extract | DPPH | ABTS | IRC |
| WAE | 122 ± 0.7 | 201 ± 1.3 | 140 ± 0.9 |
| BAE | 141 ± 1 | 245 ± 1.5 | 182 ± 1.2 |
| BME | 159 ± 1.2 | 320 ± 1.9 | 210 ± 1.5 |
| WME | 180 ± 1.9 | 360 ± 2.1 | 250 ± 1.7 |
| Ascorbic acid control | 58 ± 0.3 | 71 ± 0.7 | 76 ± 0.8 |
The free radical scavenging potential of extracts was also assessed by their ability to quench the cationic ABTS radical generated in the assay system. Wood aqueous extract exhibited the highest quenching activity followed by bark aqueous extract based on the ABTS method with an IC50 of 201 ± 1.3 and 265 ± 1.7 μg/ mL respectively (Table 3). The difference between ABTS/DPPH based antioxidant activities has been observed for other plant extracts and thought to be correlated with the concentration and chemical structure of individual polyphenolic compounds which could selectively scavenge anionic or cationic free radicals [19].
Moreover, the capacity of the WAE extract to reduce iron was assessed and found equivalent to 140 ± 0.9 μg/mL (Table 3). These results are similar to those found by Albouchi et al. [20]. As expected, the antioxidant activity assessment using antioxidant enzymes showed that all plant extracts enhanced the activity of SOD and CAT on the concentration range of 20-200 μg/mL with the highest enhancement recorded to WAE (Figures 3 and 4). These results are in contrast with those found by Spanou et al. who found that grape extracts increase the SOD activity but on the other hand it reduces the CAT activity [21]. This can be due to the concentration range used and is in agreement with the socalled antioxidant paradox [22].

Figure 3: Effects of extracts on SOD activity. The reported values are means of triplicate determinations (n=3) ± standard deviation.

Figure 4: Effects of extracts on CAT activity. The reported values are means of triplicate determinations (n=3) ± standard deviation.
Antimicrobial activity
Using disc diffusion method, only WAE showed a strong antimicrobial activity against P. aeruginosa (ATCC 9027) and isolated strains with an inhibition zone of 12 ± 0.3 mm of diameter including the disc (15.2 ± 0.4 of mm of diameter for ampicillin control). This result is confirmed by broth microdilution method with a MIC of 10.46 mg/mL (Table 4), a relatively high dose compared to the work of Aissani et al. who found that Capparis spinosa leaves methanolic extract inhibits P. aeruginosa growth with a MIC of 0.2 mg/mL and this is due to dicarboxylic acids present in this extract [23].
Table 4: Minimal inhibitory concentrations (mg/mL) of the tested extracts against Gram-negative and Gram-positive bacteria
| Bacterium | Extracts | |||
|---|---|---|---|---|
| WAE | BAE | WME | BME | |
| Gram-positive | ||||
| Listeria monocytogenes (ATCC 35152) | >300 | >300 | >300 | >300 |
| Staphylococcus aureus (ATCC 25932) | >300 | >300 | >300 | >300 |
| Gram-negative | ||||
| Pseudomonas aeruginosa (ATCC 9027) | 10.46 | >300 | >300 | >300 |
| Escherichia coli (ATCC 25922) | >300 | >300 | >300 | >300 |
| Salmonella typhimurium (ATCC 14024) | >300 | >300 | >300 | >300 |
To study the effect of the WAE on bacterial growth, different concentrations (MIC=10.46 mg/mL and 50 mg/mL) of the extract were tested. As compared with the control cell suspensions without WAE, we have shown a dose dependent change of the typical cell growth curves of P. aeruginosa (Figure 5). The addition of these concentrations of our extract to 103 CFU/mL of the bacterium evidenced a longer inhibition phase (Lag phase), cell growth phase resumed by a rate lower than the control cell suspensions. In addition, cultures exposed to WAE entered in a stationary phase at a lower bacteria concentration. When the concentration of the extract was increased, from 10.46 (MIC) to 50 mg/mL, the duration of the inhibition phase increased, whereas the rate of the growth after inhibition as well as the cell concentration at which stationary phase was significantly reduced. This result confirms that the inhibited cells are not totally able to metabolize compounds in WAE or recover from their inhibition. The same mechanism was observed also when Listeria monocytogenes was treated with carob leaves methanolic extract [24].

Figure 5: Growth curves of P. aeruginosa at 37°C without and with WAE at different concentrations.
Based on the same work, we tried to propose a mode of action of the phenolic compounds present in WAE on this bacterium. With the use of proline, we tried to evaluate if phenolic metabolites behave as proline analogues or proline mimics. In this case, polyphenols can inhibit proline oxidation by inhibition of proline dehydrogenase (PDH) at the membrane and therefore inhibit the bacterium growth. The addition of such concentrations of proline could overcome the inhibition of proline analogues with aromatic ring structures. Previous work showed that p-coumaric acid inhibits P. aeruginosa at 450 μg/mL [23].
The antimicrobial effect of gallic acid and (−)-epigallocatechin-3- gallate was removed when 1 mM proline was added [23]. In our work, the antimicrobial effect of gallic acid and p-coumaric was removed when 1.3 mM proline was added into the well. These results can give insight into the mode of action of polyphenols that might act as inhibitors of PDH and disturb the pentose phosphate pathway.
Conclusion
This paper deals with the evaluation of total phenolic, flavonoids and tannic contents as well as antioxidant and antimicrobial activity of Ailanthus altissima wood and bark aqueous and methanolic extracts. Wood aqueous extract contain high levels of phenolic and tannic compounds with a strong antioxidant and antimicrobial activities against Pseudomonas aeruginosa strains. These findings suggest that A. altissima can be used as a promising tool to face microbial infections and to increase food shelf-life. In the future, we will study the antimicrobial activity of A. altissima wood aqueous extract in vivo using meat and fish samples.
Acknowledgments
Special thanks to Dr. Karim Ben Slama for providing bacterial strains and lab facilities.
References
- Gamboe WR, Chavez P, Baker WP (2008) Antimicrobial activity of natural plant extracts against five bacterial species. J Arizona-Nevada Academy Sci 165-167.
- Manzoor AS, Sowriappan JD, Shabir AM (2014) Plant extracts as naturalantioxidants in meat and meat products. Meat Sci 98: 21-33.
- Dillard CJ, German JB (2000) Phytochemicals: Nutraceuticals and human health. J Sci Food Agri 80: 1744-1756.
- De Martino L, De Feo V (2008) Chemistry and biological activities of Ailanthus altissima swingle: A review. Phcog Rev 2: 339-350.
- Kraus W, Koll-Weber M, Maile R, Wunder T, Vogler B (1994) Biologically active constituents of tropical and subtropical plants. Pure Appl Chem 66: 2347-2352.
- Caboni P, Ntalli NG, Aissani N, Cavoski I, Angioni A (2012) Nematicidal Activity of (E,E)-2,4-Decadienal and (E)-2-Decenal from Ailanthus altissima against Meloidogyne javanica. J Agri Food Chem 60: 1146-1151.
- Singelton VR, Orthifer R, Lamuela-Raventos RM (1999) Analysis of total phenols and other oxidation substrates and antioxidants by means of Folin–Ciocalteu reagent. Method Enzymol 299: 152-178.
- Willet WC (2002) Balancing life-style and genomics research for disease prevention. Science 296: 695-698.
- Sun B, Richardo-Da-Silvia JM, Spranger I (1998) Critical factors of vanillin assay for catechins and proanthocyanidins. J Agri Food Chem 46: 4267-4274.
- Gyamfi MA, Yonamine M, Aniya Y (1999) Free-radical scavenging action of medicinal herbs from Ghana: Thonningia sanguine on experimentally-induced liver injuries. Gen Pharmacol 32: 661-667.
- Re R, Pellegrini N, Proteggente A, Pannala A, Yang M, et al. (1999) Antioxidant activity applying an improved ABTS radical cation decolorization assay. Free Radical Biol Med 26: 1231-1237.
- Oyaizu M (1986) Studies on products of the Browning reaction prepared from glucose amine. Jpn J Nutr 44: 307-315.
- Dieterich S, Bieligk U, Beulich K, Hasenfuss G (2000) Gene expression of antioxidative enzymes in the human heart: increased expression of catalase in the end-stage failing heart. Circulation 101: 33-39.
- Cos P, Ying L, Calomme M, Hu JP, Cimanga K, et al., (1998) Structure-activity relationship and classification of flavonoids as inhibitors of xanthine oxidase and superoxide scavengers. Nat Prod 61: 71-76.
- Aebi H (1984) Catalase in vitro. Method Enzymol 105: 121-126.
- Aksoy Y, Balk M, Ogus H, Özer N (2004) The Mechanism of Inhibition of Human Erythrocyte Catalase by Azide. Turk J Biol 28: 65-70.
- Luis A, Gil N, Amaral ME, Domingues F, Coelho Duarte AP (2012) Ailanthus Altissima (Miller) Swingle: A source of bioactive compounds with antioxidant activity. BioRessources 7: 2105-2120.
- Kumaran A, Karunakaran RJ (2007) In vitro antioxidant activities of methanol extracts of five Phyllanthus species from India. LWT Food Sci Technol 40: 344-352.
- Da Porto C, Calligaris S, Celloti E, Nicoli MC (2000) Antiradical properties of commercial cognacs assessed by the DPPH(.). J Agri Food Chem 48: 4241-4245.
- Albouchi F, Hassen I, Casabianca H, Hosni K (2013) Phytochemicals, antioxidant, antimicrobial and phytotoxic activities of Ailanthus altissima (Mill.) Swingle leaves. S Afr J Bot 87: 164-174.
- Spanou C, Veskoukis AS, Stagos D, Liadaki K, Anastasiadi M, et al. (2011) Effects of grape extracts on the in vitro activity of enzymes involved in oxidative stress regulation. In Vivo 25: 657-662.
- Halliwell B (2000) The antioxidant paradox. Lancet 355: 1179-1180.
- Aissani N, Caboni P, Saba M, Di Nicola G, Iori R, et al. (2014) Dicarboxylic acids from Caper leaves enhance antibiotic susceptibility of Pseudomonas aeruginosa to vancomycin. Int J Curr Microbiol App Sci 3: 54-64.
- Aissani N, Coroneo V, Fattouch S, Caboni P (2012) Inhibitory effect of Carob (Ceratonia siliqua) leaves methanolic extract on Listeria monocytogenes. J Agri Food Chem 60: 9954-9958.
Open Access Journals
- Aquaculture & Veterinary Science
- Chemistry & Chemical Sciences
- Clinical Sciences
- Engineering
- General Science
- Genetics & Molecular Biology
- Health Care & Nursing
- Immunology & Microbiology
- Materials Science
- Mathematics & Physics
- Medical Sciences
- Neurology & Psychiatry
- Oncology & Cancer Science
- Pharmaceutical Sciences