Stimulation of Adrenal Stress Hormone Secretion Associated with Ovarian Activity in the Catfish Heteropneustes fossilis: A Comparison of Physiological and Environmental Stress Responses
1Department of Zoology, Centre of Advanced Study, Banaras Hindu University, Varanasi, India
2Department of Biotechnology, Cochin University of Science and Technology, Kochi, India
- Corresponding Author:
- Joy KP
Department of Biotechnology
Cochin University of Science and Technology, Kochi, India
Tel: +919935614935
E-mail: kpjoybhu@gmail.com
Received date: March 28, 2017; Accepted date: April 20, 2017; Published date: April 27, 2017
Citation: Kumar R, Joy KP. Stimulation of Adrenal Stress Hormone Secretion Associated with Ovarian Activity in the Catfish Heteropneustes fossilis: A Comparison of Physiological and Environmental Stress Responses. Insights Aquac Cult Biotechnol 2017, 1:1.
Abstract
Background: Catecholamines and cortisol are stress hormones in teleosts secreted, respectively, by the adrenal homologs, chromaffin and interrenal tissues. It is well known that the stress hormones respond to a variety of stress stimuli, induced or natural. There is a cross-talk between the stress and reproductive axis but the physiological implications are debated. It is believed that breeding activity stimulates the stress hormone axis and, if so, the stress hormone levels will be greater at peak reproductive stage comparable with the responses during stress. In the current study the hypothesis was tested.
Methods and findings: The stress hormones were measured in the head kidney of female catfish H. fossilis in different phases of the reproductive cycle (preparatory, pre-spawning, spawning, post-spawning and resting) and in fish exposed to confinement stress at various time points over 24 h duration. Catecholamines were identified and measured by gradient HPLC elution of head kidney (adrenal) samples in a C-18 reverse phased column with a fluorescence detector. Cortisol was measured using a specific ELISA kit. Epinephrine and norepinephrine levels increased significantly in gonad active phases (preparatory, pre-spawning phase and spawning phases). Epinephrine is the dominant catecholamine, about two-fold higher than NE. In contrast, dopamine and its metabolite 3,4-dihydroxyphenylacetic acid (DOPAC) levels were higher in gonad-inactive phase (post-spawning and resting phases) and early recrudescence (preparatory phase) but lower in the pre-spawning and spawning phases. Cortisol level was low in gonad-inactive phase and early recrudescence but increased in the prespawning phase to reach the peak in the spawning phase. In the confinement stressed fish, the epinephrine level was elevated at 2 h, 4 h and 8 h with the peak rise at 4 h. The norepinephrine level registered a significant increase only at 4 h but the norepinephrine metabolite normetanephrine level decreased throughout. The dopamine level increased at 8 h with a decrease in the DOPAC level. Similarly, cortisol level increased significantly with the peak rise at 4 h.
Conclusion: Comparable changes occurred in the levels of the stress hormones epinephrine, norepinephrine and cortisol during the peak reproductive activity and during the confinement-stress and may be indicative of metabolic stress aimed at energy partitioning for reproduction and stress mitigation, respectively. Confinement stress may mimic high stocking density stress and is a critical ecological factor that needs management like water quality and diet.
Keywords
Catecholamines; Cortisol; Head-kidney; Seasonal changes; Stocking density; Stress
Introduction
Glucorticoids and catecholamines are the primary indicators of stress response and the metabolic changes that follow the hormonal changes are secondary or adaptive to cope up with hostile conditions. Glucocorticoids (cortisol or corticosterone) are secreted from the adrenal cortex, controlled by the hypothalamopituitary- adrenal-axis (HPA-axis) [1-5]. Glucocorticoids are involved in metabolism and inhibition of immune system function by inhibiting cytokine production [3,5-9]. Catecholamines are secreted by the adrenal medulla and modulate respiratory and cardiovascular systems and mobilize energy for high metabolic activity during stress [10-14]. In teleosts, the adrenal homologues interrenal and chromaffin tissues are embedded in the head kidney around the posterior cardinal vein and its branches, and surrounded by the hemopoietic cell mass that contains immune cells [15-19]. These tissues secrete stress hormones, glucocorticoids and catecholamines, respectively, and are released in response to a variety of stress stimuli [20,21]. The proximity or intermingling of the steroidogenic and chromaffin tissues in the head kidney facilitates potential anatomical, biochemical and functional interactions between the two [22]. During stress, the stress hormone levels are elevated, accompanied by changes in overall physiological functions like growth, metabolism and osmoregulation [3,5,10,23-27]. Elevated plasma cortisol level leads to an increased secretion of epinephrine and norepinephrine from the chromaffin cells of the head kidney of teleosts [28,29]. The role of catecholamines on glucocorticoid secretion differs: for e.g. in sea bass, the amines stimulate cortisol secretion [30] while in amphibians and reptiles, they suppress cortisol production [31,32]. Since seasonal variations in plasma cortisol or brain and ovarian catecholamines have been reported in relation to the annual reproductive cycle of the catfish [33-35], there is a need to extend such studies to adrenal hormone dynamics to delineate the functional relationship between the stress hormones. Such investigations on the seasonal dynamics and functional relationship of adrenal catecholamines and cortisol secretion are almost non-existent.
In aquaculture, fishes are exposed to various kinds of stress; stocking density is one such critical factor. The impact of stocking density has been reported using confinement experiments, restricting movements [36,37]. The confinement also may cause hypoxia due to overcrowding which is an important factor to be considered in such studies [36,38]. In this context, the catfish being air-breathing is a useful model for confinement stress experiments that rules out any interference of hypoxia state. Because of the high sensitivity and short half-life of catecholamines, they have not been assayed in many stress-related studies, instead cortisol assay, which is comparatively easier, has been extensively used to monitor stress response. Further, in such studies measuring the hormone levels in circulation (blood) has been often resorted to. Since the hormone levels in the blood are influenced by several other factors like extra-adrenal secretions, binding proteins, etc., measuring the hormone levels in the adrenal tissue will be more reliable to validate stress responses.
From the literature outlined above, animals undergo a physiological stress to mobilize energy for reproductive function and adrenal is expected to be active during the breeding period and hence an increase in the levels of stress hormones. This was tested by measuring the adrenal hormones, catecholamines and cortisol simultaneously, which are indicators of stress as well as metabolic hormones. Along with the functional adrenal catecholamines, their precursor dopamine and its metabolite 3, 4-dihydroxyphenylacetic acid (DOPAC) were also measured to know if the adrenal catecholamine metabolic pathway undergoes differential seasonal changes during the annual reproductive cycle, like brain and ovarian catecholamines [34,35]. As a comparator, adrenal activity was measured in catfish exposed to confinement stress.
Methods
Chemicals
Epinephrine, norepinephrine, normetanephrine, 3,4-dihydroxy- L-phenylalanine (L-DOPA), dopamine, 3,4-dihydroxyphenylacetic acid, (DOPAC), L-tryptophan and serotonin were purchased from Sigma Chemicals, St. Louis, USA. Perchloric acid (PCA), HPLC grade trifluoroacetic acid (TFA) and methanol were purchased from E. Merck, Mumbai, India. Cortisol ELISA kit was purchased from Labor Diagnostika North GmbH and Co. KG; LDN, Nordhorn, Germany. All other chemicals were of analytical grade and purchased from HiMedia Laboratories Pvt. Ltd., Mumbai, India.
Animals
The experiments were conducted according to the guidelines of the Animal Ethics Committee of Banaras Hindu University, Varanasi, India. All care was taken to prevent any cruelty on animals.
Heteropneustes fossilis (weight 30-35 g) were collected from the same hatchery pond stock at Chaukaghat in Varanasi during resting (December-January), preparatory (February-April), pre-spawning (May-June), spawning (June-July) and post-spawning (September- November) phases of the annual reproductive cycle. The preparatory, pre-spawning and spawning phases are the breeding seasons and post-spawning and resting phases are the non-breeding periods. The fish were acclimated in aquarium tanks under normal photoperiod (resting phase- 10.5 L:13.5 D; preparatory phase- 12.5 L:11.5 D; pre-spawning phase- 13 L:11 D; spawning phase- L:11 D; post-spawning- 12.5 L:11.5 D and ambient temperature 22.5 ± 2oC). The pH of water was 7.2 ± 0.1. The fish were fed daily with boiled egg white and liver flakes ad libitum.
Seasonal study
In each phase, 5 female catfish were weighed and sacrificed by decapitation between 9 and 10 h to minimize variations due to circadian activity. Ovaries were dissected out and weighed (n=5). Gonado-somatic index (GSI) was expressed in percentage as weight of ovary/weight of fish × 100. The paired head kidney was dissected out and transferred to 2 mL tubes containing cold 0.2 M perchloric acid (PCA) under dark conditions. The samples were homogenized and centrifuged at 10000 rpm for 15 min at 4oC. The supernatant was collected in separate dark tubes to protect from light and the supernatant was directly used for catecholamine assay by high performance liquid chromatography (HPLC).
For the enzyme-linked immunosorbent assay (ELISA) of cortisol, fish were collected in each reproductive phase, as described above. The head kidneys were removed and weighed and kept at -80oC for 2 days until the steroid was extracted.
Confinement stress
In the resting phase, 35 acclimatized female fish (weight 30-35 g; length 16.2-17.6 cm) were divided into seven groups of five fish each. Thirty fish were given confinement stress. For the confinement stress, six small tanks of length (17.5 cm), breadth (14 cm) and height (11 cm) of 2.5 L capacity were used. The tanks were filled with 2 L of water and 5 fish were kept in each tank. The movement of the fish was hindered in the small tanks. Five control fish were kept in a large tank that allowed unhindered movement in water where fish can move freely. The fish were sacrificed after 2, 4, 6, 8, 12 and 24 h. The head kidneys were removed, weighed and kept at -80oC for 2 days until cortisol was extracted and assayed.
In the second short experiment, 5 fish (control) were kept in a large water tank that allowed unhindered movement in water. Fifteen fish (n=5 per group) were used for the confinement stress and kept in tanks of 5 fish each, as described above. They were sacrificed after 2, 4 and 8 h. The head kidneys were removed, weighed and kept at -80oC in dark tubes for 2 days. These samples were used for the catecholamine assay.
Catecholamine assay
Catecholamines were assayed by the HPLC method of Wood and Hall [39], as described earlier [35], on a Shimadzu (Kyoto, Japan) binary system (LC-10 ATVP), system controller (SCL- 10 AVP) and digital fluorescence detector (RF-10AVP). The system was operated with Shimadzu Class VP series software. Chromatographic separation was carried out on a Phenomenex Luna (2) C18 reverse phase column (150 × 4.5 mm ID; 5 μm particle diameter; 80 Aº pore size) connected to a Phenomenex guard column filled with the same material. Mobile phase consisted of solvent A- 0.05% aqueous TFA-methanol (97.5:2.5, v/v) and solvent B-0.05% aqueous TFA-methanol (40:60, v/v). A flow rate of 1 mL/min was used over 20 min with the following gradient: 0.00–1.00 min 100% A; 16 min, 50% A and 50% B (linear gradient from 1 to 16 min); 16.05 min, 100% A to return the column to initial conditions by 20 min. Detection was by native fluorescence using excitation at 220 nm and emission at 320 nm. All the solvents were degassed just before use. The standards and samples (n=5) were injected into the column by a Hamilton microliter syringe in a volume of 20 μL. The response curve was linear over the concentration range of the standards used (1-1000 ng/mL). The minimum detection was 1 ng/mL except for L-DOPA which was 15 ng/mL. Known concentrations of the standards in different dilutions were processed for recovery. The percentage recovery was calculated from the concentrations of the standards injected directly and after extraction (n=5), similar to the tissue samples. The percentage recovery was: 3,4-dihydroxyphenylalanine - 91.4 ± 3%, dopamine - 95.63 ± 2.1%, norepinephrine - 97.7 ± 1.2%, epinephrine - 92.1 ± 2.4%, DOPAC - 94± 2%, normetanephrine – 93.4 ± 3%. No correction was made for the loss. The coefficients of inter-and intra-assay variations in percentage were 1.99 and 2.63 for tyrosine, 5.13 and 6.79 for L-3,4-dihydroxyphenylalanine - 2.99 and 3.27 for dopamine, 7.25 and 6.8 for norepinephrine, 1.88 and 2.6 for epinephrine, 8 and 6 for 3,4-dihydroxyphenylacetic acid, and 3.63 and 2.6 for normetanephrine, respectively.
Cortisol assay
Extraction
The head kidney samples were homogenized separately in 4 volumes of cold PBS (pH 7.4) with an ultrasonic homogenizer (XL–2000 Microson, Misonix, USA) at 4oC. The homogenate was centrifuged at 2000 rpm for 15 min at 4oC and extracted with 3 volumes of diethyl ether, three times. The ether phase was collected and pooled group-wise, evaporated and dried under nitrogen gas and stored at -20oC until estimation.
Assay procedure
Each sample was dissolved in 100 μL of methanol. The assay was carried out using an ELISA kit for cortisol as per the manufacturer’s protocol. Briefly, 20 μL each of cortisol standard (0, 0.5, 2.0, 5.0, 10.0, 30.0, 60.0 μg/dL) and samples were transferred to the anticortisol- immunoglobulin G-coated plate. The immunoreaction was started by adding 100 μL of cortisol-HRP (horseradish peroxidase) conjugate solution into each well, followed by incubation at 37oC for 45 min. The content from each plate was removed and washed with 300 μL of wash buffer, five times. Wash buffer was completely drained out from each well. Next 150 μL of the substrate, TMB (3,3′,5,5′-tetramethylbenzidine) was dispensed into each well and incubated at room temperature for 15-20 min in dark. Color development was stopped by adding 50 μL of stop solution (1 M sulphuric acid). Absorbance was taken at 450 nM using a Multiscan microplate reader (EPOCH, BioTek Instruments Inc., USA).
The response–concentration curves for cortisol were linear over 0.5-60 μg/dL range. The sensitivity of the cortisol assay was 0.4 μg/dL. Cross reactivity of the cortisol antibody was Cortisol - 100%, predinsolone – 13.6%, corticosterone – 7.6%, Deoxycorticosterone – 7.2%, cortisone – 6.2%, deoxycortisol – 5.6%, prednisone – 5.6%, dexamethasone – 1.6%, 17-hydroxyprogesterone - 0%, E2—0%, testosterone - 0% and pregnenolone – 0%. Known concentrations of cortisol were processed in the same manner as samples. Percentage recovery of cortisol (15.3 μg/dL added) was 93.8 ± 1.6% (n=5). The coefficients of inter- and intra-assay variations were 5.6% and 5.76%, respectively.
Statistical analysis
The data were expressed as mean ± SEM (n=5) and checked for homogeneity and normality. The data followed a normal distribution in Kolmogorov-Smirnov test. Hence the data were tested by one way ANOVA (p<0.001) using the statistical Package for the Social Science software Program (version 10.0; SPSS). Newman-Keuls’ test was used for multiple comparisons between control and treatment groups (p<0.05).
Results
Seasonal variations in the GSI
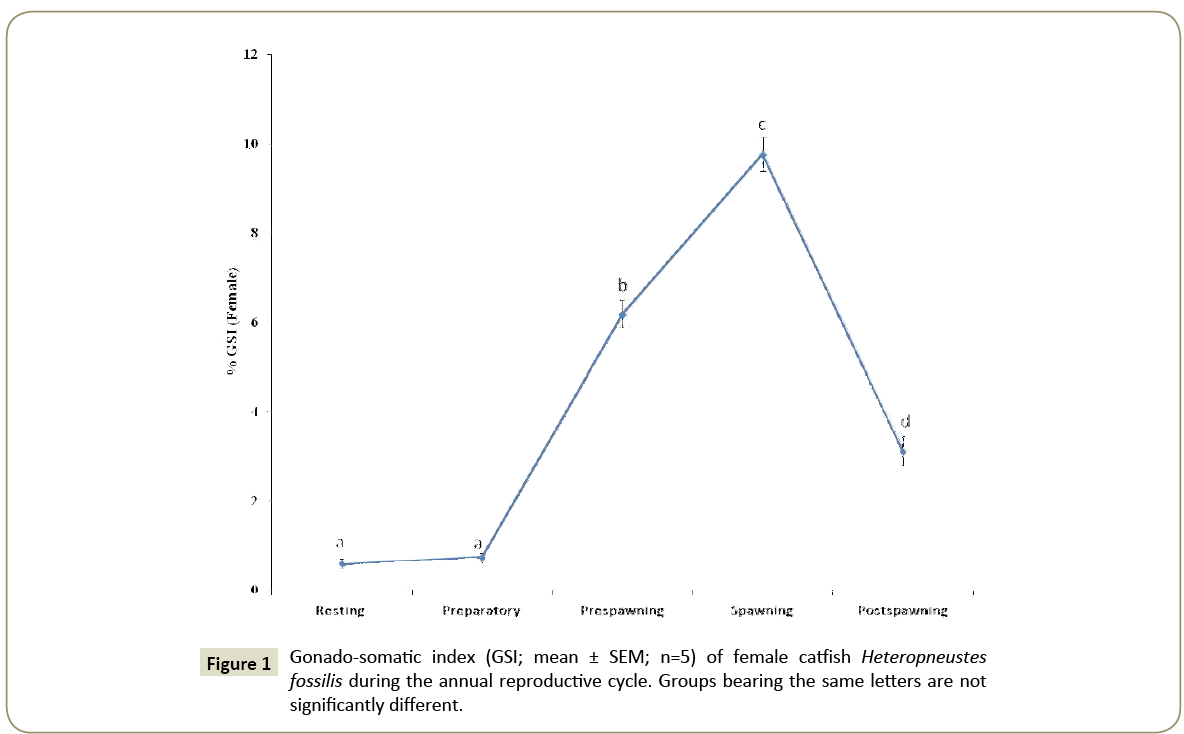
The GSI varied seasonally (Figure 1) as analyzed by one way ANOVA (p<0.001, F=199.23) and Newman-Keuls’ test (p<0.05). The GSI was low in the resting and preparatory phases and increased steeply in the pre-spawning phase to give the peak value in the spawning phase. After spawning, the GSI decreased sharply in the post-spawning phase.
Seasonal variations in catecholamines
Chromatographic profiles
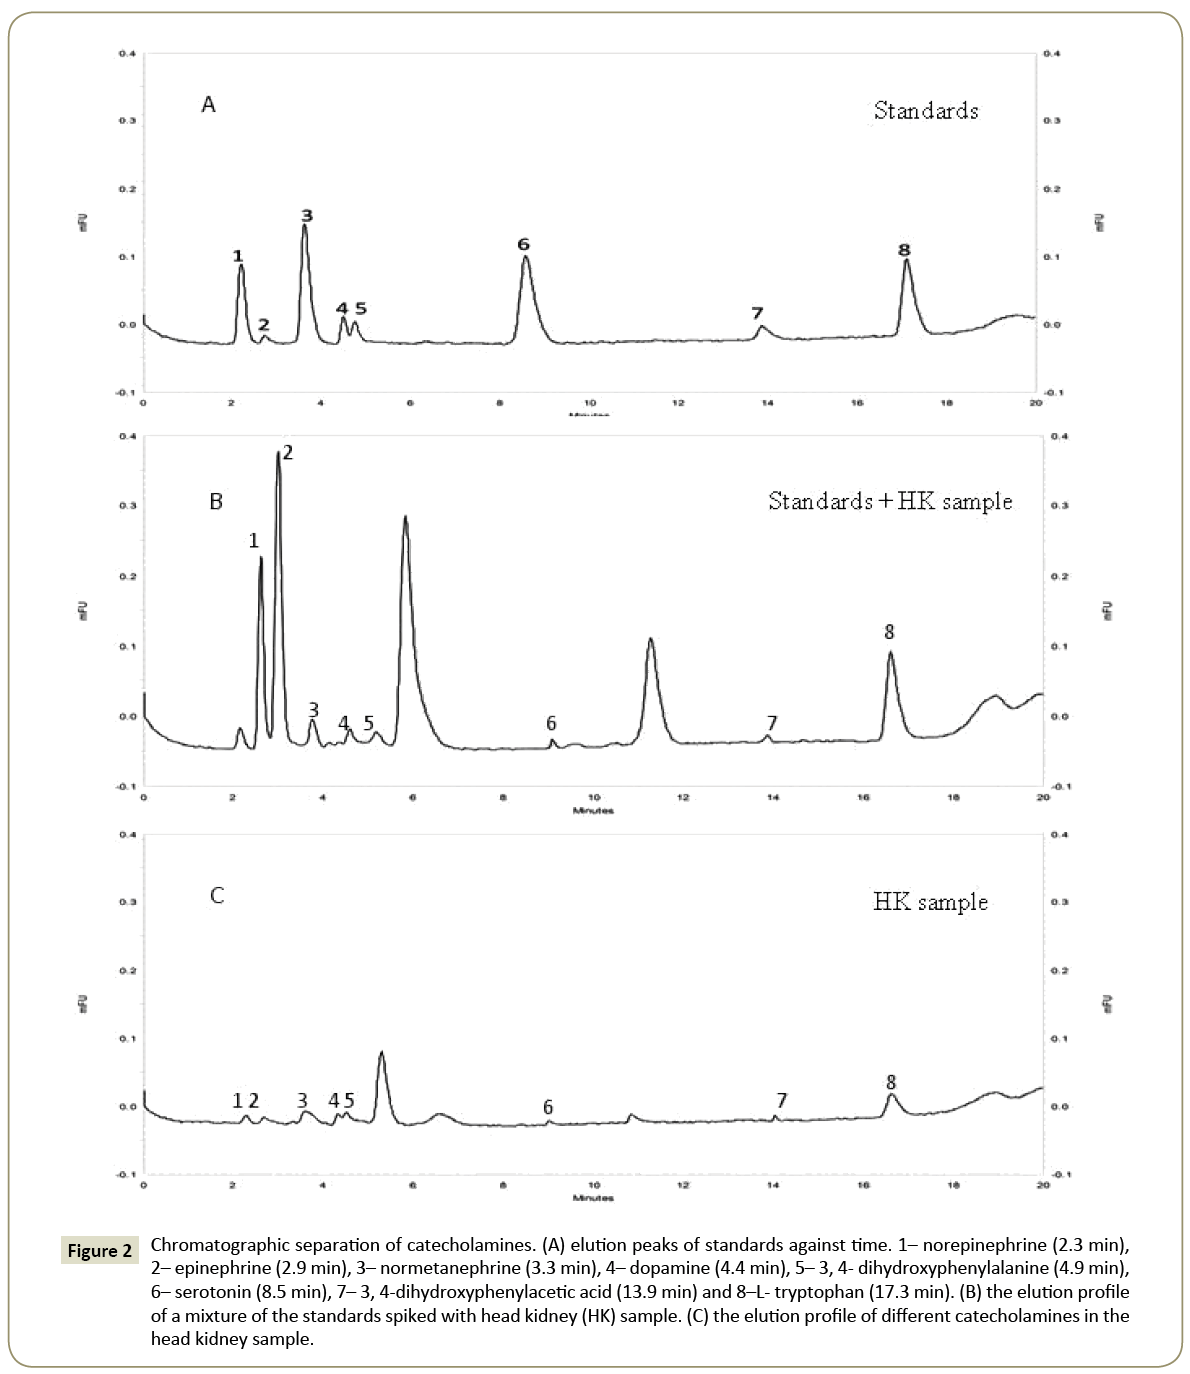
Under the chromatographic conditions described above, the standard compounds were eluted in the following order: norepinephrine (2.3 min), epinephrine (2.9 min), normetanephrine (3.3 min), dopamine (4.4 min), 3,4-dihydroxyphenylalanine (4.9 min), serotonin (8.5 min), 3,4-dihydroxyphenylacetic acid (13.9 min) and L-tryptophan (17.3 min) (Figure 2A). The tissue samples eluted similarly but with minor shifts (Figure 2C). Therefore, the samples were spiked with the standards in a mixture to authenticate the peaks (Figure 2B).
Figure 2: Chromatographic separation of catecholamines. (A) elution peaks of standards against time. 1– norepinephrine (2.3 min), 2– epinephrine (2.9 min), 3– normetanephrine (3.3 min), 4– dopamine (4.4 min), 5– 3, 4- dihydroxyphenylalanine (4.9 min), 6– serotonin (8.5 min), 7– 3, 4-dihydroxyphenylacetic acid (13.9 min) and 8–L- tryptophan (17.3 min). (B) the elution profile of a mixture of the standards spiked with head kidney (HK) sample. (C) the elution profile of different catecholamines in the head kidney sample.
Epinephrine
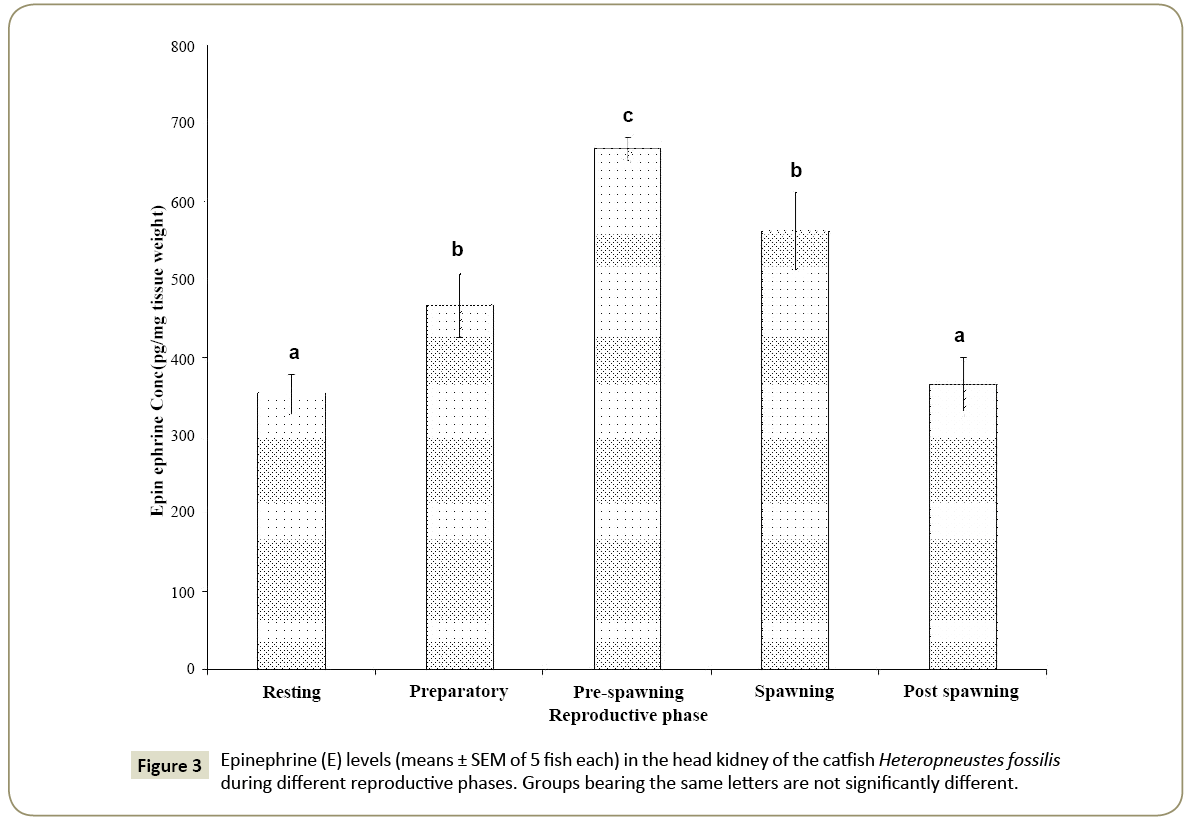
In the head kidney, epinephrine levels showed a significant seasonal variation (Figure 3; one way ANOVA, p<0.001; F=19.38). The epinephrine level was low in the resting phase, increased through the preparatory phase and reached the peak in the prespawning phase. The level decreased in the spawning and postspawning phases. The levels in the resting and post-spawning phases are not significantly different from each other (p<0.05, Newman-Keuls’ test).
Similarly, the levels in the preparatory and spawning phases are not significantly different from each other.
Norepinephrine and normetaphrine
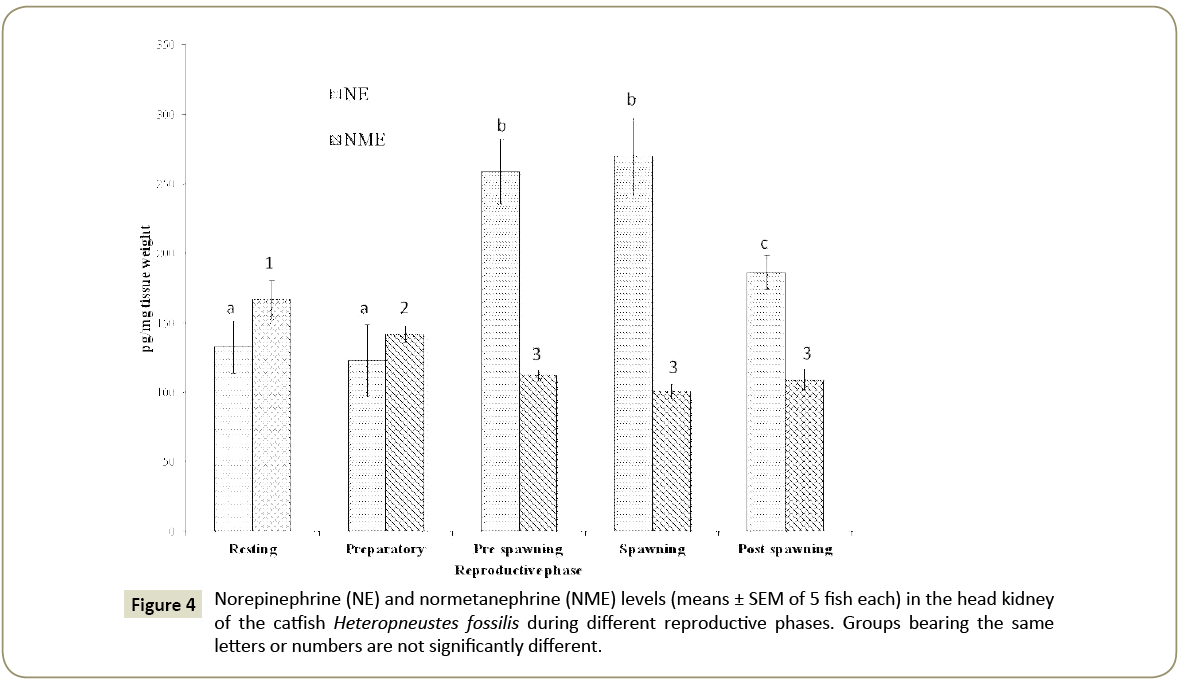
The norepinephrine level showed a significant seasonal variation (Figure 4; one way ANOVA, p<0.001; F=7.70). The concentration was low in the resting and preparatory phases and increased to the highest level in the pre-spawning and spawning phases and decreased in the post-spawning phase. The levels in the resting and preparatory phases are not significantly different from each other. Similarly, the pre-spawning and spawning phase levels are not significantly different from each other (p<0.05, Newman- Keuls’ test).
Normetanephrine level showed a significant seasonal variation (Figure 4; one way ANOVA, p<0.001; F=11.77) and the level was the highest in the resting phase and decreased through the preparatory phase to give low levels in other reproductive phases. The levels in the pre-spawning, spawning and postspawning phases are not significantly different with each other.
The ratio of norepinephrine to normetaphrine was the highest in the preparatory phase (1:3.8) and decreased to give the lowest value in the post-spawning phase (1:1.97) indicating, respectively, a high turnover in the preparatory phase and a low turnover in the post-spawning phase.
Dopamine and DOPAC
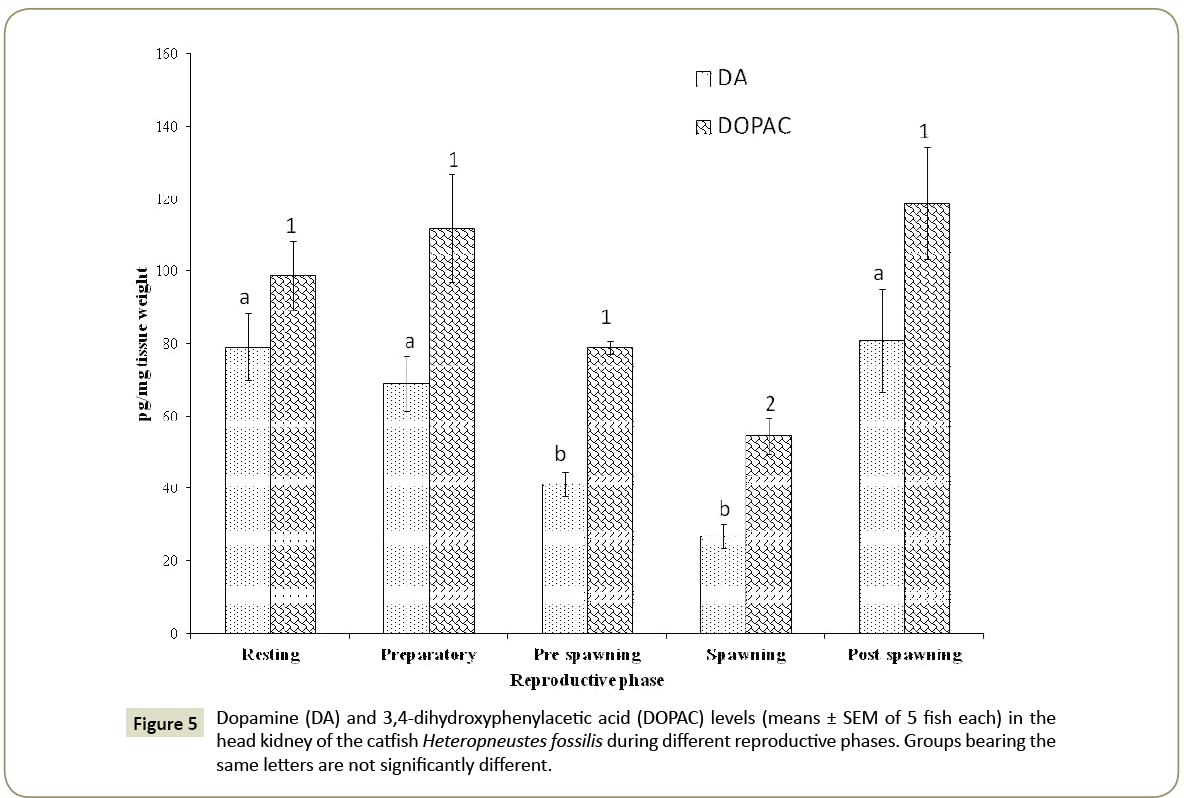
Dopamine showed a significant seasonal variation (Figure 5; one way ANOVA, p<0.001; F=7.93) and the level was low in the prespawning and spawning phases, and high in the post-spawning, resting and preparatory phases without any significant difference between the seasons. The pre-spawning and spawning levels are also not significantly different.
The dopamine metabolite DOPAC level showed a significant seasonal variation (Figure 5; one way ANOVA, p<0.001; F=5.84). The seasonal pattern was similar to that of DA. The levels were high in the post-spawning, resting and preparatory phases, and decreased in the pre-spawning and spawning phases. The DOPAC levels in the resting, preparatory and post-spawning phases are not significantly different (p<0.05, Newman-Keuls’ test).
The dopamine to DOPAC ratio was the highest in the spawning phase (1:2.03) and the lowest in the resting phase (1:1.25) indicating, respectively a high turnover in the spawning phase and a low turnover in the resting phase.
Effects of confinement stress on catecholamine levels
Epinephrine, norepinephrine and normetaphrine
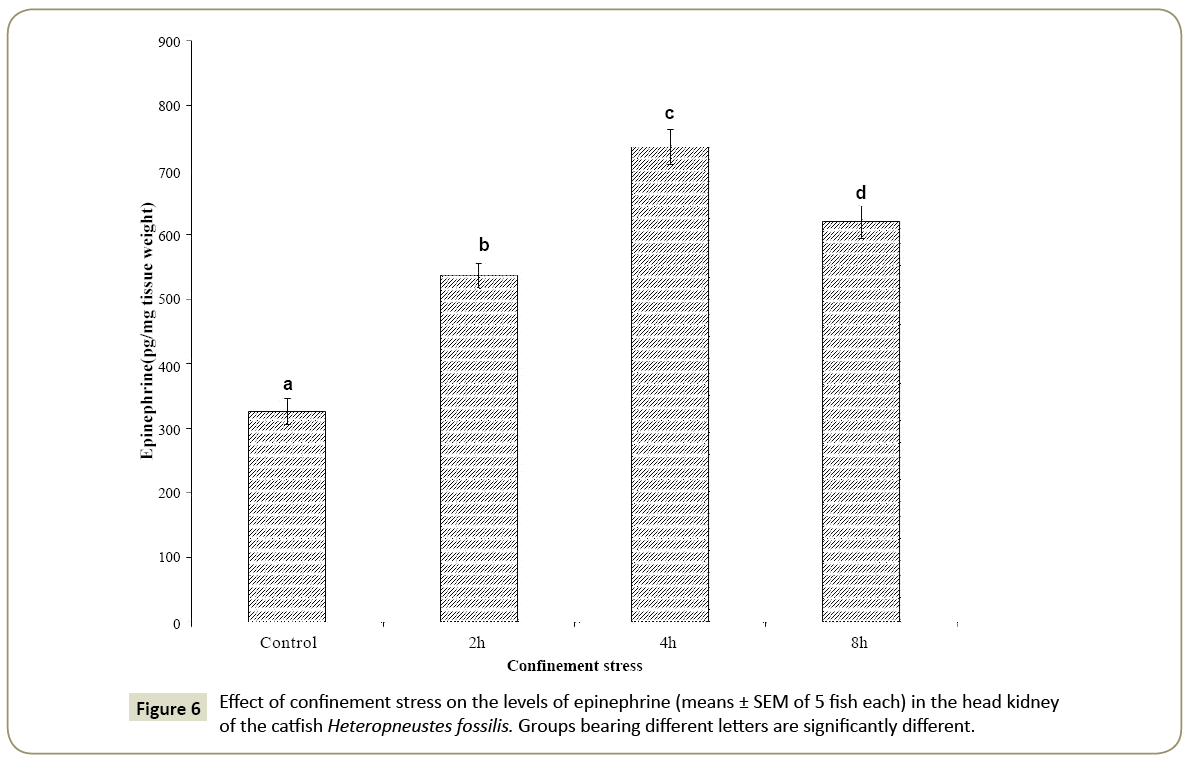
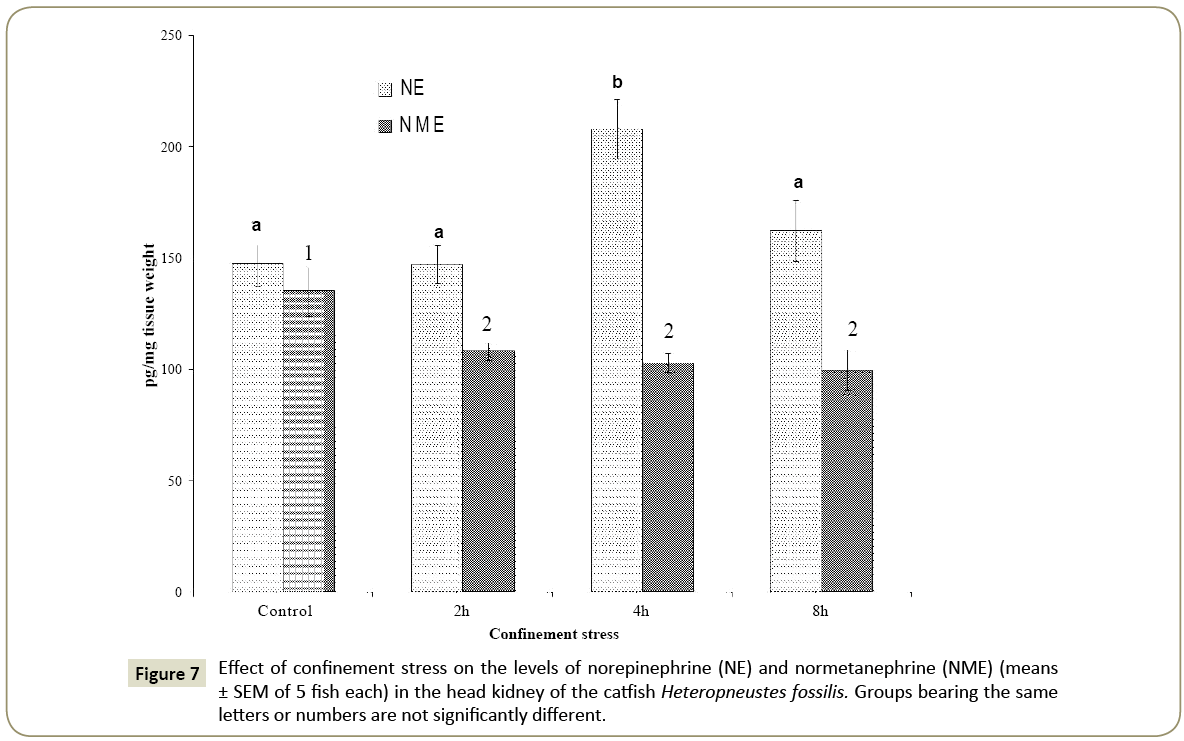
The head kidney epinephrine level was significantly high after 2, 4 and 8 h of the confinement stress as compared with the control (Figure 6; one way ANOVA; p<0.001; F=55.35). The level was the highest at 4 h of the confinement and decreased but remained significantly high at 8 h when compared with the control group (p <0.05, Newman-Keuls’ test). The norepinephrine level increased significantly at 4 h of the confinement stress as compared with the control (Figure 7; one way ANOVA; p<0.001; F=8.01). There was no significant difference in the norepinephrine level at 2 h and 8 h as compared with the control. The normetanephrine level decreased significantly at 2, 4 and 8 h compared with the control group (Figure 7; one way ANOVA; p<0.001; F=4.38; Newman- Keuls’ test; p<0.05).
The norepinephrine to epinephrine ratio increased timedependently (1:3.76 at 8 h) as compared with the control group (1:2.21) indicating a high synthesis of epinephrine. On the other hand, the norepinephrine to normetaphrine ratio decreased in the confinement stress groups with the lowest ratio at 4 h (1:0.51) as compared with the control group (1:0.92).
Dopamine and DOPAC
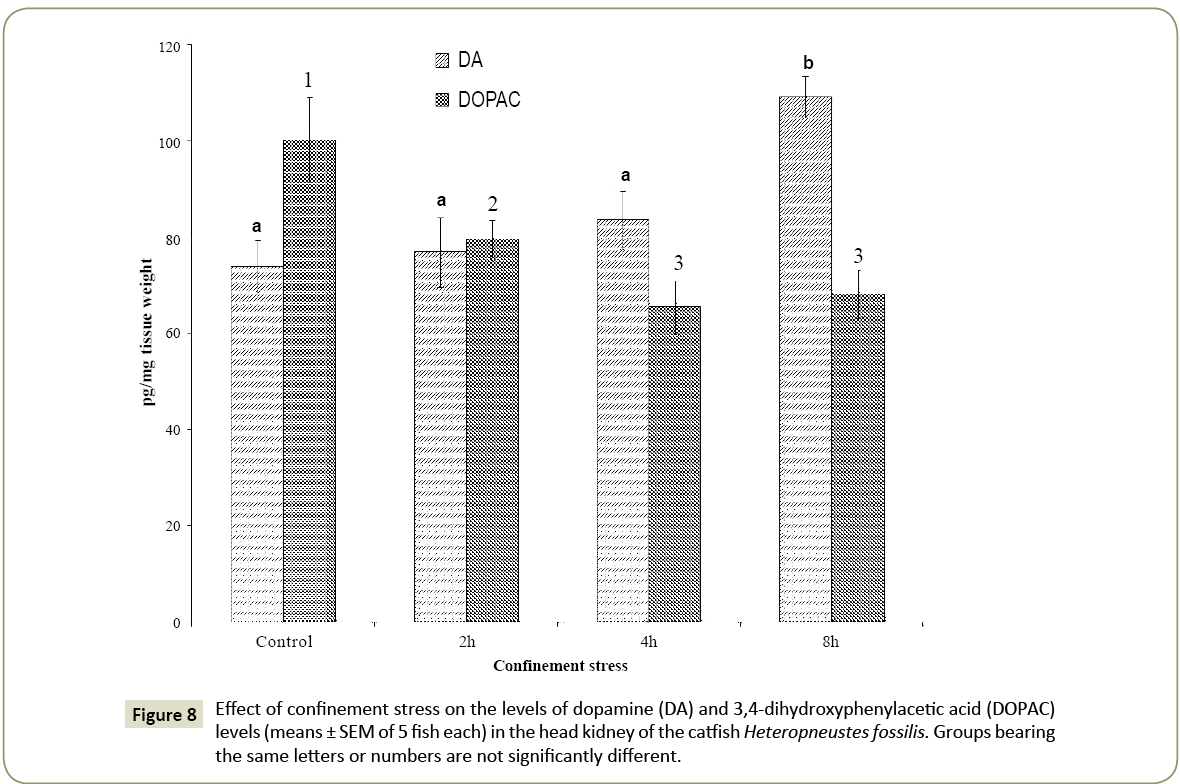
The dopamine level did not vary significantly at 2 h and 4 h but increased significantly at 8 h of the confinement stress as compared with the control (Figure 8; one way ANOVA; p<0.001; F=7.53). The DOPAC level decreased significantly at 2 h, 4 h and 8 h of the confinement stress as compared with the control (Figure 8; one way ANOVA; p<0.001; p<0.05; F=6.76 Newman-Keuls’ test). There was no significant difference in the DOPAC level between 4 and 8 h.
The dopamine to DOPAC ratio decreased with the time of the confinement with the lowest ratio at 8 h (1:0.62) as compared with the control (1:1.36) indicating decreased dopamine turnover.
Seasonal variation in cortisol
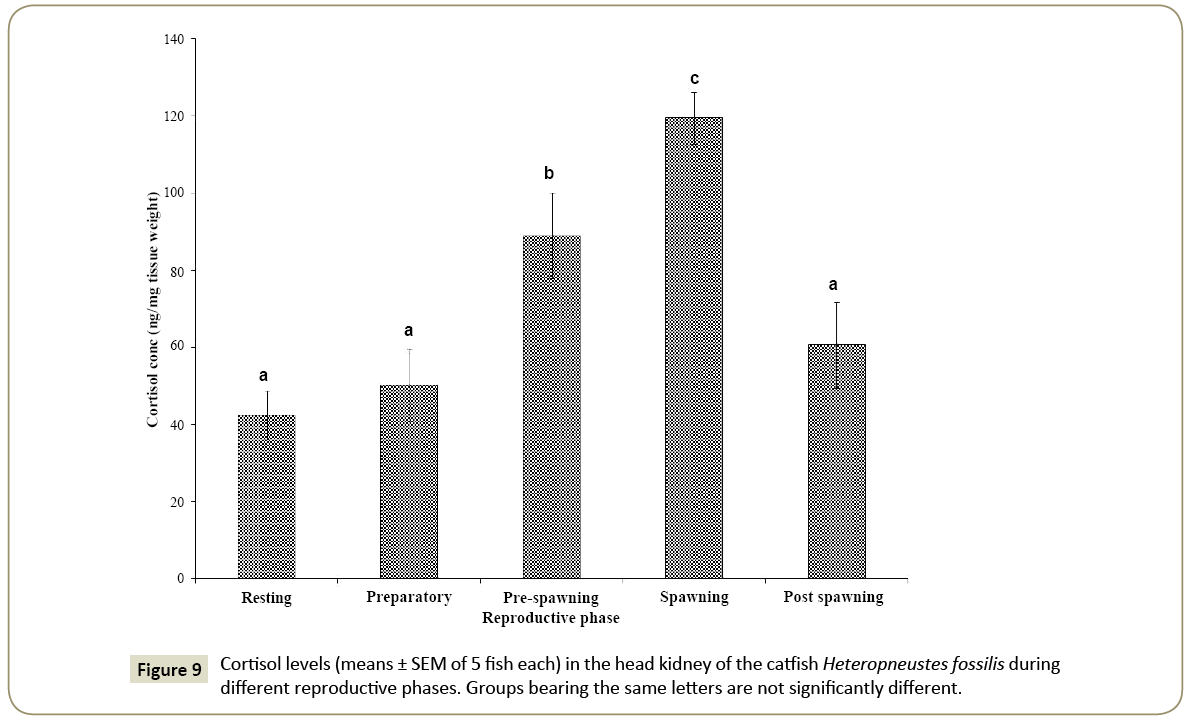
The head kidney cortisol level showed a significant seasonal variation (Figure 9; one way ANOVA, p<0.001; F=11.97) with the level low in the resting and preparatory phases and increased significantly in the pre-spawning and spawning phases. The peak cortisol level was noticed in the spawning phase and decreased in the post-spawning phase after spawning (p<0.05, Newman- Keuls’ test).
Effect of confinement stress on cortisol secretion
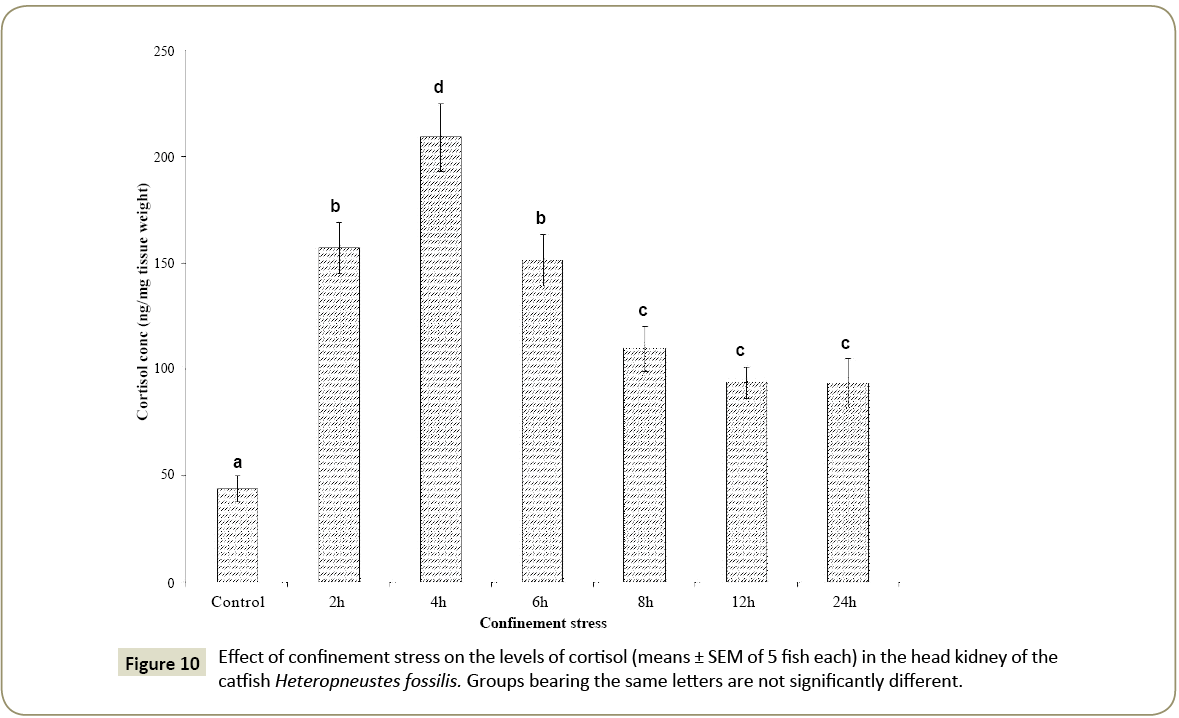
During the confinement, the cortisol level increased significantly to the peak level at 4 h and declined subsequently at 6 h, 8 h, 12 h and 24 h (Figure 10; one way ANOVA, p<0.001; F=23.57). However, the levels were still higher as compared with the control group.
Discussion
The head kidney (chromaffin tissue) is considered the major site of catecholamine biosynthesis in teleosts including the catfish. The presence of dopamine and norepinephrine metabolites (DOPAC and normetanephrine, respectively) indicates that the head kidney is also the site for catecholamine metabolism, which is shown for the first time in a teleost. The biochemical analysis is also supported by evidence from immunocytochemical localization of CA-synthesizing enzymes such as tyrosine hydroxylase (TH), dopamine-β-hydroxylase (DBH) and phenylethanolamine-, N-methyltransferase (PNMT) [15] and chromaffin reaction [40,41] in different teleosts. To our knowledge, studies comparing annual variations in head kidney catecholamines and the GSI are few. The data show that dopamine and norepinephrine/epinephrine showed significant as well as differential annual variations and maintain an inverse relationship with the GSI. The DA level is higher in the gonad-inactive phase (post-spawning and resting phases) when the GSI is low and declines with the commencement of gonad recrudescence (preparatory, pre-spawning and spawning phases) when the GSI increases progressively. Conversely, both norepinephrine and epinephrine levels are low in the gonad-inactive phase but have increased with gonad recrudescence (pre-spawning and spawning phases). The rise in the GSI is due to vitellogenesis and the high levels of epinephrine and norepinephrine may suggest a role in vitellogenesis as metabolic hormones.
In the catfish head kidney, epinephrine is the predominant catecholamine: the concentration ranges from ~350 to 650 pg/mg tissue weight while norepinephrine varies from ~150 to 280 pg/ mg tissue weight. In the head kidney of tilapia, epinephrine level varied from 400-750 ng/g tissue weight and norepinephrine from 650-2000 ng/g tissue weight [42], suggesting possible species variations. The high level of epinephrine in the pre-spawning and spawning phases may be due to a simultaneous increase in its biosynthesis and decreased norepinephrine degradation as evident from the decreased level of normetanephrine. The norepinephrine to normetanephrine ratio also supports this inference. Since both dopamine and DOPAC levels are low in the pre-spawning and spawning phases in comparison to other phases, a higher conversion of dopamine to norepinephrine is highly plausible. However, the dopamine to DOPAC ratio is high in the pre-spawning and spawning phases compared to other phases. On one hand dopamine is preferentially converted to norepinephrine, and on the other hand the residual dopamine is rapidly metabolized. Since dopamine inhibits steroidogenic activity [43], its removal is functionally significant. The high adrenergic activity during the pre-spawning and spawning phases may lead to increased metabolic activities. Chakrabarti and Ghosh [44] correlated the increase in the epinephrine level with high active phosphorylase activity. Epinephrine is a strong glycogenolytic hormone [10] and its high level may be related to energy demands in the ovary. In the pre-spawning and spawning phases, the gonads develop fully and are laden with gametes ready for ovulation/spermiation. The heightened metabolic activity and intra-gonadal pressure due to growth may be potential stress-like signals to elevate the levels of adrenergic hormone. These stress-like signals may act via the central and peripheral autonomic nervous system to release the adrenal catecholamines. In the hypothalamus and ovary of the catfish, catecholamines show significant seasonal variations with dopamine activity high in the gonad-resting phase and decreased during gonad recrudescence [34,35]. Adrenergic activity is low in the gonad-inactive phase and increases to the peak in the prespawning- spawning phases. The seasonality in hypothalamic catecholaminergic activity has been attributed to the regulation of gonadotropin [45]. In the ovary, catecholaminergic activity has been related to steroidogenesis [35,43]. The adrenal CA dynamics may be associated with ovarian maturation and ovulation that involve altered hemodynamics, and fluid and ion homeostasis (oocyte hydration) [46]. It is possible that the ovary-laden eggs may stimulate baroreceptors, both peripheral and central, causing catecholamine release. Subhedar et al. [47] reported that the application of intraovarian pressure stimulated vasopressin (vasotocin)-positive neurons in the nucleus preopticus of the catfish Clarias batrachus. In teleosts, vasotocin is involved in the activation of the HPI axis [48,49], implying an increased cortisol secretion.
Similar to catecholamines, the adrenal cortisol level varied seasonally with the peak level in the spawning phase. Epinephrine/norepinephrine and cortisol levels increase parallel with the GSI; epinephrine attained the peak earlier than cortisol. This shows that the chromaffin cells respond earlier than cortisol that requires the involvement of the HPI axis [15]. The high levels of epinephrine/norepinephrine and cortisol in the breeding phase may be associated with high energy demands (intense metabolic activity) during ovarian recrudescence, maturation and ovulation. Cortisol elicits both direct and permissive roles in glycogenolysis [3]. Both catecholamines and cortisol participate in glycogenolysis, catecholamines may have a short term effect while cortisol may have a long term role [50]. Cortisol also may be related to its role in final oocyte maturation and associated oocyte hydration [51,52]. Mishra and Joy [53] reported that catfish ovary synthesizes cortisol and corticosterone, suggesting a direct role in final oocyte maturation and oocyte hydration.
The data of confinement stress experiments show that both catecholamines and cortisol are involved in stress responses and are useful biomarkers of stress. Both epinephrine/norepinephrine and cortisol levels were elevated maximally at 4 h post stress. The period up to 4 h can be recognized as the acute primary response and the post 4 h period, which marks the lowering of epinephrine/ norepinephrine and cortisol levels may indicate the adaptation phase, even though the cortisol level remained about 2-fold high even at 24 h. Stress prepares the animals to release the FIGHT and flight hormones, epinephrine/norepinephrine [10], which is also true with the confinement stress. The confinement stress altered the catecholamine metabolism; the dopamine, normetanephrine and DOPAC levels remained low at 2 h and 4 h. The low levels of normetanephrine and DOPAC indicate reduced CA catabolism but increased dopamine conversion to norepinephrine and then to epinephrine. At 8 h, the dopamine level only increased with a concomitant decrease in epinephrine and norepinephrine, suggesting perhaps initiation of the adaptation phase.
The cortisol level remained high throughout the 24 h stress period with the peak elevation at 4 h. The pattern of cortisol secretion also followed the epinephrine/norepinephrine pattern initially. The secretion of cortisol is initiated by stress through the activation of the HPI-axis [1,3]. Chen et al. [45] reported that the duration of cortisol release into the circulation by the interrenal tissue is longer compared to the catecholamine release by the chromaffin cells. We could not substantiate this observation since we did not measure catecholamine levels beyond the 8 h confinement. Trenzado et al. [36] reported elevation of plasma cortisol in confinement stressed rainbow trout within 1 to 6 h and the response continued up to 168 h. The cortisol response varied with trouts having low or high cortisol-responsiveness; in low response fish, the peak was obtained at 6 h while in high response fish, the peak was reached at 2 h. Cortisol level increased rapidly by acute stress caused by chasing the fish with a net and chronic stress caused by overcrowding of fish [14]. These authors showed a rapid increase in cortisol release in gilthead seabream due to acute stress and the fish showed the highest level of cortisol release between 1 and 6 h, similar to the catfish.
Conclusion
The increases in the levels of the stress hormones epinephrine, norepinephrine and cortisol during the peak reproductive activity and the confinement-stress are comparable and may be indicative of metabolic stress aimed at energy partitioning for reproduction and stress mitigation, respectively. Confinement stress may mimic high stocking density stress and is a critical ecological factor that needs management like water quality and diet in fish culture practices.
Funding
The research was supported by Rajiv Gandhi National Fellowship of University Grants Commission, New Delhi to RK, No. UGCRGNF- 263/S-43/11700.
Competing Interest
The authors declare that no competing interests exist with regard to this manuscript.
References
- Barton BA (2002) Stress in fishes: A diversity of responses with particular reference to change in circulating corticosteroids. Integr Comp Biol 42: 517−525.
- Fanouraki E, Divanach P, Pavlidis M (2007) Baseline values for acute and chronic stress indicators in sexually immature red porgy (Pagrus pagrus). Aquaculture 265: 294−304.
- Mommsen TP, Vijayan MM, Moon TW (1999) Cortisol in teleosts: Dynamics, mechanisms of action and metabolic regulation. Rev Fish Biol 9: 211−268.
- Reid SG, Vijayan MM, Perry SF (1996) Modulation of catecholamine storage and release by the pituitary-interrenal axis in the rainbow trout, Oncorhynchus mykiss. J Comp Physiol B 165: 665−676.
- Wendelaar Bonga SE (1997) The stress response in fish. Physiol Rev 77: 591−625.
- Bruhn A, Verdant C, Vercruysse V, Su F, Vray B, et al. (2006) Effects of dexamethasone on macrophage migration inhibitory factor production in sepsis. Shock 26: 169−173.
- Castillo J, Castellana B, Acerete L, Planas JV, Goetz FW, et al. (2008) Stress-induced regulation of steroidogenic acute regulatory protein expression in head kidney of gilthead seabream (Sparus aurata). J Endocrinol 196: 313−322.
- Castillo J, Teles M, Mackenzie S, Tort L (2009) Stress-related hormones modulate cytokine expression in the head kidney of gilthead seabream (Sparus aurata). Fish Shellfish Immunol 27: 493−499.
- Giamarellos-Bourboulis EJ, Dimopoulou I, Kotanidou A, Livaditi O, Pelekanou A, et al. (2010) Ex vivo effect of dexamethasone on cytokine production from whole blood of septic patients: Correlation with disease severity. Cytokines 49: 89−94.
- Fabbri E, Capuzzo A, Moon TW (1998) The role of circulating catecholamines in the regulation of fish metabolism: An overview. Comp Biochem Physiol C 120: 177−192.
- 11. Janssens PA, Waterman J (1988) Hormonal regulation of gluconeogenesis and glycogenolysis in carp (Cyprinus carpio) liver pieces cultured in vitro. Comp Biochem Physiol A 91: 451−455.
- 12. McNeill B, Montpetit CF, Perry SF (2003) Catecholamine secretion in trout chromaffin cells experiencing nicotinic receptors desensitization is maintained by non-cholinergic neurotransmission. J Exp Biol 206: 4247−4254.
- 13. Ottolenghi C, Puviani AC, Gavioli ME, Fabbri E, Brichenti L, et al. (1989) Glycogenolytic action of glucagon-family peptides and epinephrine on catfish hepatocytes. Fish Physiol Biochem 6: 387−394.
- Pottinger TG, Carrick TR (2001) ACTH does not mediate divergent stress responsiveness in rainbow trout. Comp Biochem Physiol A 129: 399−404.
- Abelli L, Gallo VP, Civinini A, Mastrolia L (1996) Immunohistochemical and ultrastructural evidence of adrenal chromaffin cell subtypes in sea bass Dicentrarchus labrax (L.). Gen Comp Endocrinol 102: 113−122.
- Chester J, Ingleton PM, Phillips JG (1986) Fundamentals of comparative vertebrate endocrinology. New York: Plenum Press, pp: 95−120.
- Mastrolia L, Gallo VP, La Marca A (1984) The adrenal chromaffin cells of Salmo gairdneri Richardson (Teleostei, Salmonidae). J Anat 138: 503−511.
- Reid SG, Perry SF (1994) Storage and differential release of catecholamines in rainbow trout (Oncorhynchus mykiss) and American eel (Anguilla rostrata). Physiol Zool 67: 216−237.
- Reid SG, Bernier NJ, Perry SF (1998) The adrenergic stress response in fish: Control of catecholamine storage and release. Comp Biochem Physiol C 120: 1−27.
- Chi DS, Qui M, Krishnaswamy G, Li C, Stone W (2003) Regulation of nitric oxide production from macrophages by lipopolysaccharide and catecholamines. Nitric Oxide 8: 127−132.
- 21. Davis KB, Small BC (2006) Rates of cortisol increase and decrease in channel catfish and sunshine bass exposed to an acute confinement stressor. Comp Biochem Physiol C 143: 134−139.
- Ehrhart-Bornstein ME, Bornstein SR (2008) Cross-talk between adrenal medulla and adrenal cortex in stress. Ann N Y Acad Sci 1148: 112−117.
- Auperin B, Baroiller JF, Ricordel MJ, Fostier A, Prunet P (1997) Effect of confinement stress on circulating levels of growth hormone and two prolactins in freshwater-adapted Tilapia (Oreochromis niloticus). Gen Comp Endocrinol 108: 35−44.
- Axelrod J, Reisine TD (1984) Stress hormone: Their interaction and regulation. Science 224: 452−459.
- 25. Barton BA (2000) Salmonid fishes differ in their cortisol and glucose responses to handling and transport stress. N Am J Aquacult 62: 12−18.
- Barreto RE, Volpato GL (2004) Caution for using ventilator frequency as an indicator of stress in fish. Behav Processes 66: 43−51.
- Sumpter JP (1997) The endocrinology of stress. In: Iwama GK, Pickering AD, Sumpter JP, Schreck CB, Editors. Fish Stress and Health in Aquaculture: Cambridge University Press, Cambridge, U K pp 102.
- Vijayan MM, Pereira C, Grau EG, Iwama GK (1997) Metabolic responses associated with confinement stress in tilapia: the role of cortisol. Comp Biochem Physiol C 116: 89−95.
- 29. Jonsson A, Wahlqvist I, Hansson T (1983) Effects of hypophysectomy and cortisol on the catecholamine biosynthesis and catecholamine content in chromaffin tissue from rainbow trout, Salmo gairdneri. Gen Comp Endocrinol 51:278−285.
- Rotllant J, Ruane NM, Dinis MT, Canario AVM, Power DM (2006) Intra-adrenal interaction in fish: Catecholamine stimulated cortisol release in sea bass (Dicentrarchus labrax L.). Comp Biochem Physiol A 143: 375−381.
- Capaldo A, Laforgia V, Sciarrillo R, De Falco M, Valiante S, et al. (2004) Effects of dopamine on the adrenal gland of Podarcis sicula (Reptilia, Lacertidae). Gen Comp Endocrinol 135: 17−24.
- Capaldo A, Gay F, Valiante S, Laforgia V, Varano L (2004) Effects of adrenaline administration on the interrenal gland of the newt, Triturus carnifex: Evidence of intra-adrenal paracrine interaction. J Morphol 261: 18−25.
- 33. Lamba VJ, Goswami SV, Sundararaj BI (1983) Circannual and circadian variations in plasma levels of steroids (cortisol, estradiol-17 beta, estrone and testosterone) correlated with the annual gonadal cycle in the catfish, Heteropneustes fossilis (Bloch). Gen Comp Endocrinol 50: 205−225.
- Senthilkumaran B, Joy KP (1995) Changes in hypothalamic catecholamines, dopamine-β-hydroxylase and phenylanolamine-N-methyltransferase in the catfish Heteropneustes fossilis in relation to season, raised photoperiod and temperature, ovariectomy and estradiol-17β replacement. Gen Comp Endocrinol 97: 121−134.
- Singh V, Chaube R, Chourasia TK, Joy KP (2010) Temporal and periovulatory changes in ovarian catecholamines in catfish Heteropneustes fossilis. Gen Comp Endocrinol 168: 46−54.
- Trenzado CE, Carrick TR, Pottinger TG (2003) Divergence of endocrine and metabolic responses to stress in two rainbow trout lines selected for differing cortisol responsiveness to stress. Gen Comp Endocrinol 133: 332−340.
- Barton BA, Rahn AB, Feist G, Bollig H, Schreck CB (1998) Physiological stress responses of the freshwater chondrostean paddlefish (Polyodon spathula) to acute physical disturbances. Comp Biochem Physiol A 120: 355−363.
- Pickering AD (1992) Rainbow trout husbandry: Management of the stress response. Aquaculture 100: 125−139.
- Wood AT, Hall MR (2000) Reversed-phase high-performance liquid chromatography of catecholamines and indolamines using a simple gradient solvent system and native fluorescence detection. J Chromatogr B 744: 221−225.
- Joy KP (1984) A histochemical study on the adrenal of the teleost Heteropneustes fossilis (Bloch). Z Mikrosk.-anat Forsch 98: 396−402.
- Joy KP, Sathyanesan AG (1978) An enzyme cytochemical study on the adrenal of the freshwater teleost, Clarias batrachus (L). Gegenbaurs Morph Jahrb 124: 607−618.
- Chen WH, Sun LT, Tsai CL, Song YL, Chang CF (2002) Cold-stress induced the modulation of catecholamines, cortisol, immunoglobulin M, and leukocyte phagocytosis in tilapia. Gen Comp Endocrinol 126: 90−100.
- Joy KP, Singh V, Chaube R (2014) An in vitro study on catecholamine modulation of ovarian steroidogenic activity in the catfish Heteropneustes fossilis. Gen Comp Endocrinol 196: 91−99.
- 44. Chakrabarti P, Ghosh SK (2014) Cyclical changes in interrenal and chromaffin cells in relation to testicular activity of olive barb, Puntius sarana (Hamilton). Arch Pol Fish 22: 151−158.
- 45. Senthilkumaran B, Joy KP (1996) Effects of administration of some monoamine-synthesis blockers and precursors on ovariectomy-induced rise in plasma gonadotropin II in the catfish Heteropneustes fossilis. Gen Comp Endocrinol 101:220−226.
- 46. Singh V, Joy KP (2010) An involvement of vasotocin in oocyte hydration in the catfish Heteropneustes fossilis: a comparison with effects of isotocin and hCG. Gen Comp. Endocrinol 166: 504−512.
- 47. Subhedar N, Krishna NSR, Deshmukh (1987) The response of nucleus preopticus neurosecretory cells to ovarian pressure in the teleost, Clarias batrachus (Linn.). Gen Comp Endocrinol 68: 357−368.
- 48. Backstrom T, Schjolden J, Overli O, Thornqvist P, Winberg S (2011) Stress effects on AVT and CRF systems in two strains of rainbow trout (Oncorhynchus mykiss) divergent in stress responsiveness. Horm Behav, 59: 180−186.
- 49. Gestro M, Soengas JL, Rodriguez-Illamola A, Miguez JM (2014) Arginine vasotocin treatment induces a stress response and exerts a potent anorexigenic effect in rainbow trout, Oncorhynchus mykiss. J Neuroendocrinol 26: 89−99.
- Weber JM, Shanghavi DS (2000) Regulation of glucose production in rainbow trout: Role of epinephrine in vivo and in isolated hepatocytes. Am J Physiol Regulat Integr Comp Physiol 278: 956−963.
- Sundararaj BI, Goswami SV (1977) Hormone regulation of in vivo and in vitro ocyte maturation in the cattish, Heteropneustes fossilis (Bloch). Gen Comp Endocrinol 32: 17−28.
- LaFleur G, Thomas P (1991) Evidence for a role of Na+, K+ ATPase in the hydration of Atlantic croaker and spotted sea trout oocytes during final maturation. J Exp Zool 258: 126−136.
- 53. Mishra A, Joy KP (2006) Effects of gonadotrophin in vivo and 2-hydroxyoestradiol-17β in vitro on follicular steroid hormone profile associated with oocyte maturation in the catfish Heteropneustes fossilis. J Endocrinol 189: 341−353.
Open Access Journals
- Aquaculture & Veterinary Science
- Chemistry & Chemical Sciences
- Clinical Sciences
- Engineering
- General Science
- Genetics & Molecular Biology
- Health Care & Nursing
- Immunology & Microbiology
- Materials Science
- Mathematics & Physics
- Medical Sciences
- Neurology & Psychiatry
- Oncology & Cancer Science
- Pharmaceutical Sciences
