Soil Fertility Dynamics of Ultisol as Influenced by Greengram and Mucuna Green Manures
Saria AG1*, Sibuga KP1, Semu E2 and Høgh-Jensen H3
1Department of Crop Science and Horticulture, Sokoine University of Agriculture Morogoro, Tanzania
2Department of Soil and Geological Sciences, Sokoine University of Agriculture, Morogoro, Tanzania
3National Food Institute, Technical University of Denmark, Copenhagen, Denmark
- Corresponding Author:
- Saria AG
Department of Crop Science and Horticulture
Sokoine University of Agriculture Morogoro, Tanzania
E-mail: adolfsaria@gmail.com
Received Date: March 22, 2018; Accepted Date: April 17, 2018; Published Date: April 25, 2018
Citation: Saria AG, Sibuga KP, Semu E, Høgh-Jensen H (2018) Soil Fertility Dynamics of Ultisol as Influenced by Greengram and Mucuna Green Manures. J Plant Sci Agric Res. Vol. 2 No. 2:14.
Copyright: © 2018 Saria AG, et al. This is an open-access article distributed under the terms of the Creative Commons Attribution License, which permits unrestricted use, distribution, and reproduction in any medium, provided the original author and source are credited.
Abstract
Synchronisation between supply of plant available nutrients to crops’ needs and uptake is a major challenge in Sub- Saharan Africa. Experiments were set to evaluate release patterns and availability of nutrients by leguminous green manures in soil. Mucuna and greengram materials were buried 10 cm in mesh bags. Replicated bags removed weekly and analysed to determine decomposition rates and quantities of nutrients released into soil. Mucuna decomposition was faster compared to greengram, from third to twelve weeks of incubation. This implies that greengram has relatively more resistant materials to decomposition compared to mucuna. Maximum effect on soil nutrient content occurred in sixth and seventh weeks after application of green manures. Total organic C in soils increased by a factor of 2.3 to 3.2. Total N increased significantly from 1.28% to 2.64% at sixth week in soil with greengram and 2.83% at seventh week in soil with mucuna. Available P content of soil increased from 0.03 to 0.39 and 0.37 mg kg-1 in soil treated with greengram and mucuna. Optimum microbial population was attained from fifth to seventh week after manure application, with 2.3 × 10⁸ in soil with greengram and 3.08 × 10⁸ with mucuna, significantly improved compared to original population.
Keywords
Green manure; Soil fertility; Incubation period; Cover crop
Introduction
Poor soil fertility has been one among the major problems in agriculture in Sub-Saharan Africa, leading to poor crop productivity [1] Agriculture in many African countries is subjected to poor nutrient replenishment in soils, leading to soil degradation and hence poor productivity [2-4]. However, the use of inorganic fertilisers alone cannot be a long-term solution for soil fertility management among poor African farmers, and thus integrated soil fertility management has been proposed [5]. The synchronisation between sufficient supply of plant available nutrients like phosphorus (P), potassium (K) and nitrogen (N) to the crops needs and uptake is a major challenge [6-8]. However, the use of leguminous plants as green manure can be a good alternative for replenishing soil fertility and diversify farm productivity in intensive production because legumes generally are nutrient rich [8,9].
Therefore, agriculture intensification in poor fertility soils can be supported through natural means of improving and sustaining the soil fertility [10]. Cover crops, which are used for pests control in organic agriculture, can be a good source of nutrients as green manure [11,12] and increase soil organic matter content which can support soil microbial activity [13]. The use of cover crops as green manure and for weed control was adopted as strategy for replenishing soil nitrogen that had been taken up by crops and to provide organic matter for maintaining soil’s fertility and improving its properties [14]. Marandu et al. observed an increase of about 12.4 mg mineral N kg-1 soil when maize was grown in rotation with greengram [15]. There is evidence on the ability of Mucuna spp green manure to influence soils’ physical and biological and chemical properties [16,17]. However, lack of synchrony between mineralization of organic N from green manure and plant N requirements of a subsequent crop is a major challenge [18,19]. Understanding the nutrient release patterns of the green manure applied is thus a prerequisite to optimize an efficient use of the green manure and to sustain a high value vegetable crop [20,21].
The objective of the current study consequently was to determine relative decomposition patterns, nutrient release rates and microorganism proliferation as influenced by two leguminous green manure crops, mucuna (Mucuna pruriens) and greengram (Vigna radiata (L.), that were incorporated into the soil under field conditions in Morogoro, Tanzania, using the mesh bag approach.
Material and Methods
Experimental site
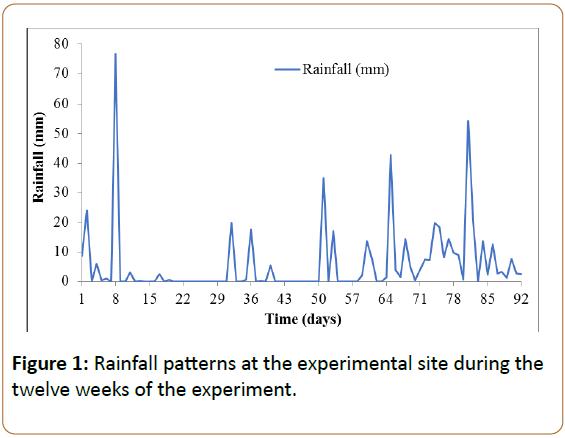
The field decomposition study was carried out at Sokoine University of Agriculture (SUA) Crop Museum in at an average elevation of 534 m.a.s.l. The location has bimodal rainfall of 800-1000 mm annually with the short rains in November to January and the longest from March to May. Rainfall patterns for the twelve weeks at the experimental area during the experiment are presented in Figure 1.
For the previous three seasons the field was used for cultivating various annual crops. The initial soil analysis of the experimental site within SUA crop museum was done for a composite soil sampled diagonally diagonal across the site within the 0-20 cm depth. The area is characterized by kaolinitic clay soils which are well drained. The physiographic features of the area are characteristically an undulating convex land and the slope is about 4% [22]. The sample was air dried and ground to pass through a 2 mm sieve.
Experimental layout and sampling
Mucuna (Mucuna pruriens) and greengram (Vigna radiate L.) were grown adjacent to the experimental site to the 50% flowering stage. The crops were harvested just above the soil surface, chopped and 500 g fresh weight filled into polyethylene plastic mesh bags (20 × 20 cm) of 2 mm mesh size. The litterbags were buried 5-10 cm deep into the soil in four replicates. For twelve consecutive weeks, with exact intervals of 7 days, four replicated mesh bags were sampled for decomposition analysis. The 5 cm soil located directly below the mesh bags was collected. The plant and soil samples were air dried in a screen house for 72 hours and then oven dried for 24 hours at 70°C to constant weight. The samples were ground ready for analysis to determine their decomposition patterns.
Plant analysis
Total nitrogen: 0.2 g of the sample of green manure was transferred to a 500 ml Kjeldahl tube and two grams of mixed salts catalyst (K2SO4+CuSO4+selenium powder, in the ratio of 10:10:1 by weight) was added. Ten ml of H2SO4 were added. The mixture digested for one hour at 360°C. After cooling, 50 ml of water were added, followed by 25 ml of H3BO3 and 50 ml of 40% NaOH. The mixture was distilled and about 200 ml of distillate collected. The distillate was titrated using 0.05N H2SO4 [23].
Phosphorus content: extractable P was determined using the Bray 1 method [24]. A sample of three grams was taken in to the extraction bottle, 20 ml of extraction solution and shaken thoroughly. Then the mixture was filtered through filter paper. Five millilitres aliquot of the sample mixture was transferred to 50 ml volumetric flask and 10 ml of water added. Two millilitres of phosphate reagent were added, and the volume was made to 50 ml, the colour could develop in 15 minutes. Then phosphorus content in solution was determined in a spectrophotometer at 882 nm.
Soil analysis
Organic soil carbon: Organic carbon analysis of the green manure was done using the Walkely-Black method (Yeomans and Bremner 1988). Duplicate samples of 1 g were weighed in an Erlenmeyer flask, 10 ml of 1N K2Cr2O7 was added followed immediately by 20 ml concentrated H2SO4 and hand shaken for about a minute to oxidize the soil’s organic carbon. Then the mixture could stand on asbestos plates for 30 minutes. About 100 ml of water were added followed by 10 ml orthophosphoric acid and 10 drops of diphenylamine indicator. The solution was titrated with FeSO4 to determine the organic carbon.
Total soil nitrogen and phosphorus: these elements were also determined using the same methods used for the analysis of the plant materials.
Ca and Mg content: the exchangeable Ca and Mg were determined from the same solution used to determine P using atomic absorption spectrophotometer [25].
Cation exchange capacity: the soil remained after exchangeable bases extraction filtration was washed using 100 ml of ethanol and then placed into plastic bottles. 50 ml of 4% KCL were added and shaken for 30 minutes, distilled and the distillate collected over Boric acid. Then the distillate was titrated with 0.1N H2SO4 and the titre value was used to calculate the CEC [26].
Total microbial count: Microbial count was done by determining moisture content of the sample. Ten grams sample was placed in 90 ml water and shaken vigorously to uniform suspension to detach microbial cells from soil particles in to the suspension. One ml of the suspension was transferred to 9 ml water, and similarly the dilution was continued up to a dilution of 107. Then the 103 to 107 dilutions were plated into petri dishes with nutrient agar and spread evenly. The plates were incubated 21°C for four days and then plates with 30-300 colonies were selected for microbial population counting and calculation of microbial populations. The microbial population per gram of soil was calculated using the formula:

Data analysis
Data were subjected to analysis of variance using GENSTAT statistical program (Genstat release 6.1 Laws Agricultural Trust). Treatment means were ranked using Duncan’s Multiple Range Test at P ≤ 0.05.
Results
Decomposition patterns of the green manures
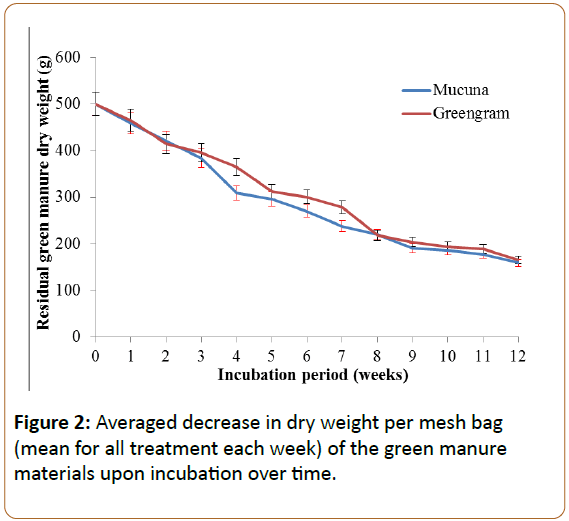
The decomposition patterns of the green manures were assessed using decreases of organic carbon (C), total nitrogen (N), phosphorus (P) content and associated changes in nutrient content and total microbial populations in the mesh bags and in the soil just below the mesh bags. Initially the weight of the green manure incubated in the soil decreased with time immediately from the first week throughout the incubation period (Figure 2) following a first-order negative exponential curve (mucuna: R2=0.98 and greengram R2=0.98) as commonly found in other studies [27-29].
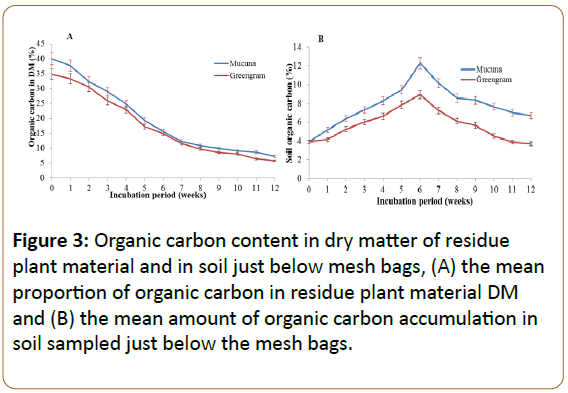
The proportion of organic C content in the plant materials was about 40% for mucuna and 35% for greengram. However, the half-life (t1/2) of the two materials was similar as both attained their half-life at the fifth week of incubation (Figure 2). Due to the negative exponentially, the decomposition pattern of the two green manures were fast to about the seventh week of incubation which concur with other studies [30,31]. This pattern of decomposition lead to the rapid decrease of the proportion of organic C in the mesh bags in first six to seven weeks of incubation. Some of the C is respired but others are eventually added and incorporated in the soil below the mesh bag (Figure 3).
Decrease in nitrogen in the residual plant materials and nitrogen gains in soil
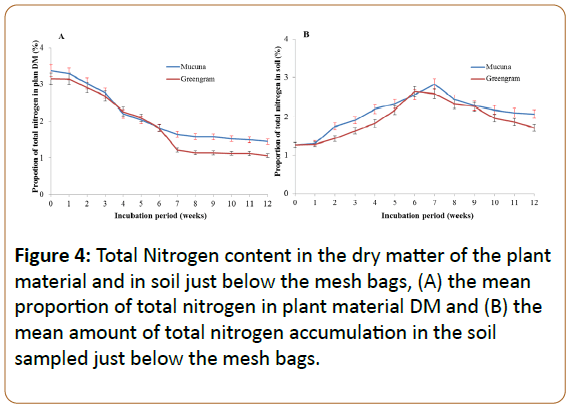
For both green manure materials, the trend in the proportion of N in the mesh bag mirrored the trend in the proportion of carbon (Figure 4A). The net release of N from the mesh bag was evident in the soils below the mesh bag (Figure 4B) until week 7, after which release rates must have decreased substantially as the microbial biomass started to decrease (Figure 4B), precipitation increases and the content in the soil stabilized (Figure 4B).
Phosphorus decrease in decomposed residual plant materials and P gains in soil
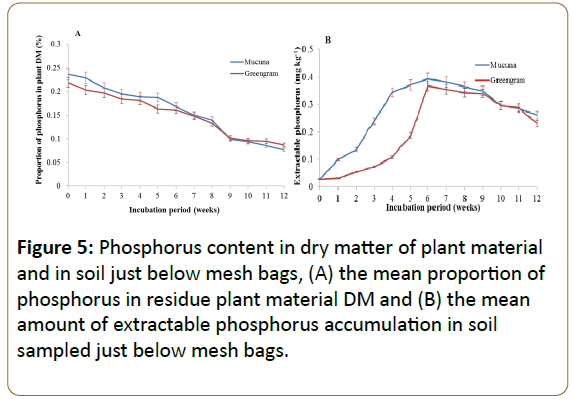
The P content of the degrading green manures followed a linear decline (Figure 5A) with R2=0.94 for mucuna and R2=0.95 for greengram. The degradation of P from both types of plant materials did not differ significantly. In both green manures the P release was fast up to the ninth week and then became stagnant. However, the quantity of P in the decomposing mucuna materials was higher for the first five weeks as compared to that in greengram and then it dropped below that of greengram at the tenth to twelfth weeks of incubation.
Interestingly, the amount extractable inorganic P (Bray 1) accumulation in the soil was faster and higher in the soil under mucuna compared to greengram (Figure 5B). At the fourth week, soil incubated with mucuna had attained 0.35% of P compared to 0.1% of greengram (Figure 5B). At the sixth week, the extractable P had reached the same level, but green gram had a slower start.
Decrease in calcium in plant materials and calcium gains in soil
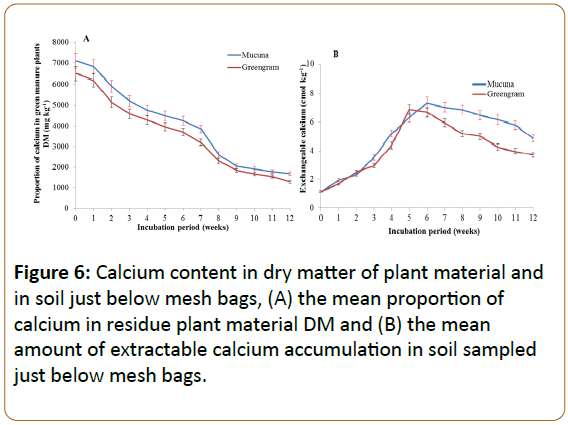
The trend of Ca release by the green manures and gain by the soil is presented in Figure 6. Calcium release from the plant materials proceeded steadily, with the rate decreasing somewhat in the last three weeks. Throughout the incubation period the residual green manures did not differ in their Ca contents and the release into the soil below it. The faster rate of decomposition and nutrient release by green manure was also observed by Cobo et al. [32], where mucuna had high release of Ca up to the twentieth week after incorporation in the soil, as revealed by higher accumulation in the soil. This was also observed in the present study where the plant materials continued to release Ca for all the twelve weeks.
In the soil, the Ca gain trend was similar between the two green manures. However, soils incubated with mucuna attained highest total Ca at the sixth week, which was one week later as compared to greengram which attained its peak at the fifth week. The decrease of Ca observed in the present study beyond the fifth and sixth weeks was due to its high immobilisation in the soil. Cobo et al. observed a similar trend of Ca release from decomposing green manure; however, no consistent trend was found on the Ca accumulation patterns due to its high immobilisation [33]. Other authors reported high ability of Ca immobilisation in the decomposing materials in different ways and through its accumulation in fungi found in the decomposing materials [33,34].
Decrease in magnesium in plant materials and magnesium gains in soil
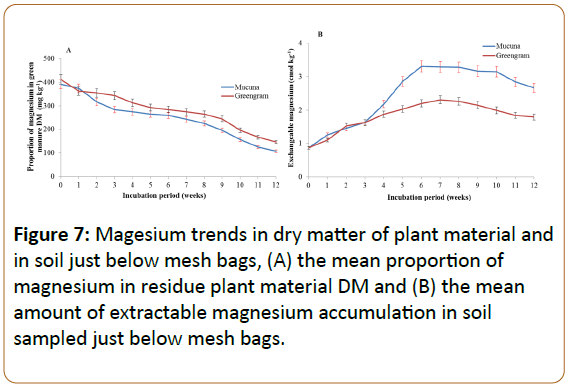
The release of Mg from the two green manures and its gain in the soil throughout the incubation period (Figure 7). Mucuna released slightly higher amount of Mg as compared to the greengram.
Soil incubated with mucuna had the highest amount of Mg at the sixth week after incubation, while that with greengram reached its highest level at the seventh week. Thereafter, there was a slight decrease in soil Mg.
Microbial populations in the soils under decomposing green manure materials
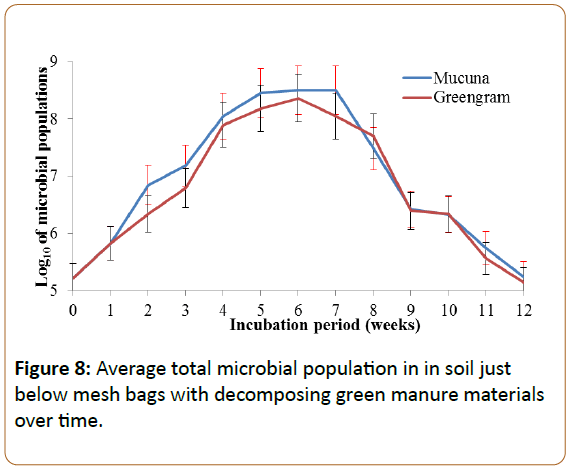
The total microbial population following the introduction of the two green manures increased for six weeks, with a subsequent decrease. The population in the initial soil was about 1.628 × 10⁵, which increased up to 2.3 × 10⁸ in the soil with greengram and up to 3.08 × 10⁸ in the soil with mucuna. Transformed into Log10, these values translated to 5.21, 8.05 and 8.50, respectively (Figure 8).
CEC changes in soil supplemented with mucuna and greengram
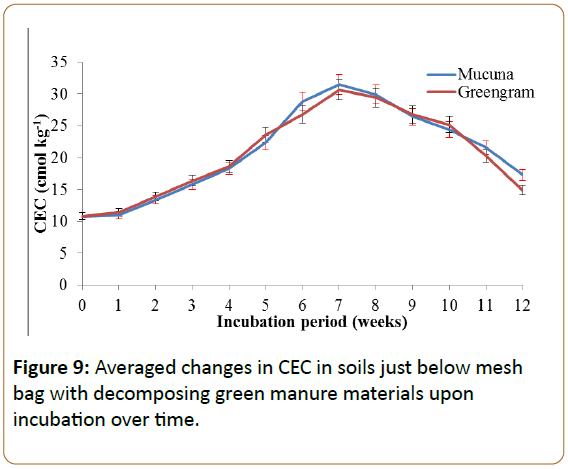
The soil treated with mucuna and greengram green manure attained higher CEC in the seventh week, as presented in Figure 9. The CEC in the soil treated by mucuna was 31.5 while that with greengram was 30.6 cmol kg-1, respectively, at the seventh week as compared to the original soil whose CEC was 10.8 cmol kg-1 (Figure 9).
Discussion
The organic C compounds released from the plant materials could be seen accumulating in the soil immediately below the decomposing material in the first six weeks. The accumulation did not continue throughout but reached its optimum at the 6th week and subsequently decreased (Figure 3B). This dynamic is attributed to the early build-up of the soil microbial population (Figure 6) that use the organic compounds as substrate and to the fact extensive that leaching has taken place due to excess of precipitation during the last 5-6 weeks of the experiment (Figure 1).
In accordance with the negative exponential degradation pattern, amounts and rates of C being released from the mesh bags decreased substantially after the seventh week and simultaneously the release rates from the mesh bags most likely also decreased due to the stabilisation of the litter, i.e. the carbon content approaching stability (Figure 3A) as the C:N ratio of the residual litter approached 8-9 at week 5 after incubation after which the microbial activity may have been slowed down [36].
For both manure substrates, the C:N ratio decreased from approximately 12 initially to 5 at week 12 after burying the litter bags, following a simple linear pattern (data not shown). This demonstrates the potency of the green manures in the sense that it decomposes very rapidly (Figure 2) and at the 12th week had reached a structure that resembled soil. The relative low C:N ratio will also lead to a net release of N almost instantly. The apparent linearity agrees with theory [35,36] whereby these substances, as green manures with an initially low C:N ration of approximately 12, must be viewed towards at the late period of the exponential process.
The relatively low C:N ratios is the exact reason for terming these substrates “green manure”. The low C:N ratios indicate that the degradation of the organic materials will not cause a net immobilisation but be able to net release inorganic N into the soil matrix that can benefit crop growth. The rapid decomposition under the current conditions contrast with relatively low mineralisation rates under north European conditions [37].
The experimental site had been used for cropping the previous cropping during seasons and yet it has a good total N content (1.28%). The inclusion of the green manures however was a high injection of N to the soil such that a high flux of inorganic N must be anticipated (not measured). Other studies [38,39] also observed significant increase of N in different soils treated with different green manures in long term application, explaining the difference in N contribution to the soil by these different green manures. The higher soil N under mucuna may be since mucuna had higher leaf: stem ratio than stem materials which accounts for the higher total N (Figure 4). These results agree with Cobo et al. who observed mucuna released higher amount of N as compared to the other green manures [32]. In addition to that, in a similar decomposition study, Chikowo showed prolonged N immobilisation while in under field conditions [40]. After the seventh and eighth weeks, the amount of N in soil started to decrease since most of the N released was nitrified and then lost or leached as nitrate upon watering, where it was leached beyond the sampling zone.
Despite the delay in enriching the soil in extractable P (Bray-1) for greengram it still reached the same high level as mucuna and its still justified to call them green manures when it comes to supplying plant available P to the crops, which concur with Randhawa et al. [41]. The chemical composition of the source material did not differ (Figure 5A) so we speculate that differences may be caused by the morphological differences between the two species, particular the leaf:steem ratio [42]. This has been seen to influence the release rate in other studies and possible interactions between the leaf-stem due to high soluble C contents in the stem [33,43]. The fast decrease of P in the residual of the decomposing plant materials may be due to its soluble nature in the plant cell. Studies by Frossard et al. and Giacomini et al. (2003) observed that soluble P in plant tissues is also available in the form of diesters (nucleic acids, phospholipids, and phosphoproteins) which can easily be released through microbial decomposition activities [44,45]. This led to the release of most of the P from the two green manures in the first eight weeks of incubation. The difference P content compared to the N content in the litter is since P to a higher degree is organically bound [43,46] whereas a higher proportion of the N content initially is soluble [47].
Mg release from plant materials was almost similar in both green manures. In both plant materials the trend of decomposition was similar, with a somewhat steady rate of decomposition throughout. The difference between the two types of green manures was in the gains of Mg in the soil, whereby the soil incubated with mucuna gained more Mg as compared to that incubated with greengram. Other studies have also observed that soil Mg usually accumulated and became higher mainly in the top soil then decreased with depth [48].
The increase in soil microbial the population was a result of increase in the energy and nutrient sources for the microorganisms due to the addition of the green manures. Bakken et al., and Lavelle and Spain observed that organic material provided by green manure promotes the activity of soil organisms, as a source of energy and nutrients [49,50]. Cover crops and mulch increase the populations of macro-organisms and microorganisms, and their activities in the soil, because they increase the total inputs of organic materials to the soil [51]. Increase in total microbial population density in the soil is ascribed to the ability of a green manure to provide conducive environments like increased soil moisture content, ensuring moderate changes in soil temperatures, providing food sources at the soil surface and retention of soil burrows that favour growth and multiplication of macro and microorganisms. A study by Elfstrand et al. on the responses by soil microbial communities to green manuring detected an increase in soil microbial biomass [18]. Lundquist et al. also reported an increase of 24 to 52% of active bacteria due to the application of rye green manure [13]. Some studies have revealed the ability of mucuna plants to increase soil organic matter and improve soil moisture regimes [32]. Other studies have shown that the increase in microbial population depended on the availability of the organic matter supplied by the soil amendment materials and that the population increase is rather short lived following plant incorporation [13].
The improvement of CEC was mainly due to the ability of the two green manures to release the bases like Ca and Mg, as well as other cations, upon decomposition. This was also observed by Kimetu et al. (2008) who explained the importance of green manure in the improvement of soil CEC [2]. The soil CEC protects cations from leaching out of the plant root zone and makes them available to plant roots [52].
The decrease in CEC beyond the seventh week was due to the oxidation of NH4+ to give NO3- which is highly soluble and in turn is leached beyond the sampling zone. Chikowo et al. (2004) observed the accumulation of NO3- beyond 40 cm depth of soil just three weeks after the beginning of the rainy season [41]. On the other hand, NH4+ which is lost from the soil as ammonia gas through the process of volatilization contributes to the decrease in CEC beyond the seventh week. This was also observed by Zhenghu and Honglang (2000) who found a negative correlation between ammonium volatilization and soil CEC.
Conclusions and Perspectives
Using mucuna and greengram as green manure can be of great potential in increasing soil fertility, which can contribute to improving crop production. However, to achieve this, the optimal period when the plant can benefit from the nutrients released should be well synchronized with the optimal release of the nutrients from the decomposing green manures. The sixth to eighth weeks after incorporation seem to maximize nutrients release form the green manure, and planting of main crops should target to take advantage of this maximum release period of the green manure. This investigation provides justifiable insights for improving soil fertility and demonstrates the suitability of mucuna and green manures as suitable in the overall scenario of integrated soil fertility management strategy to enhance soil nutrient dynamics and plant nutrition under these tropical soil conditions.
References
- Camara O, Heineman E (2006) Overview of the fertilizer situation in Africa: “Backround paper of the African Fertilizer Summit. June 9-13, 2006, Abuja, Nigeria. " Nepad: Pretoria.
- Kimetu JM, Lehmann J, Ngoze SO, Mugendi DN, Kinyangi JM, et al. (2008) Reversibility of soil productivity decline with organic matter of differing quality along a degradation gradient. Ecosyst 11: 726-739.
- Abate E, Hussein S, Laing M, Mengistu F (2017) Soil acidity under multiple land-uses: assessment of perceived causes and indicators, and nutrient dynamics in small-holders’ mixed-farming system of northwest Ethiopia. Acta Agric Scand Sect B 67: 134-147.
- Shepherd KD (2007) Saving Africa's Soils: Science and technology for improved soil management in Africa. World Agroforestry Centre, Nairobi 2007.
- Sanginga N, Woomer PL (editors) (2009) Integrated soil fertility management in Africa: principles, practices, and developmental process. CIAT, 2009.
- Edmeades DC (2003) The long-term effects of manures and fertilisers on soil productivity and quality: a review. Nutr Cycl Agroecosyst 66: 165-180.
- Sharma KL, Neelaveni K, Katyal JC, Srinivasa Raju A, Srinivas K, et al. (2008) Effect of combined use of organic and inorganic sources of nutrients on sunflower yield, soil fertility, and overall soil quality in rainfed Alfisol. Communications in soil science and plant analysis 39: 1791-1831.
- Mafongoya PL, Bationo A, Kihara J, Waswa BS (2006) Appropriate technologies to replenish soil fertility in southern Africa. Nutr Cycl Agroecosyst 76: 137-151.
- Diacono M, Montemurro F (2010) Long-term effects of organic amendments on soil fertility. A review. Agron Sustainable Dev 30: 401-422.
- Vanlauwe B, Coyne D, Gockowski J, Hauser S, Huising J, et al. (2014) Sustainable intensification and the African smallholder farmer. Curr Opin Environ Sustainability 8: 15-22.
- Mulvaney RL (2008) Advances in methodology for research on nitrogen transformations in soils. In Schepers JS, Raun WR (editors). Nitrogen in Agricultural Systems. ASA, CSSA, SSSA, Madison, Wisconsin, USA. pp. 437-504.
- Sarwar MA, Ibrahim M, Tahir M, Ahmad K, Khan ZI, et al. (2010) Appraisal of pressmud and inorganic fertilizers on soil properties, yield and sugarcane quality. Pak J Bot 42: 1361-1367.
- Lundquist EJ, Jackson LE, Scow KM, Hsu C (1999) Changes in microbial biomass and community composion, soil carbon and nitrogen pools after incorporation of rye into three California agricultural soils. Soil Biol Biochem 31: 221-236.
- Ganry F, Feller C, Harmand JM, Guibert H (2001) Management of soil organic matter in semiarid Africa for annual cropping systems. Nutr Cycl Agroecosyst 61: 105-118.
- Marandu AET, Mrema JP, Semu E, Nyaki AS (2011) Potential of Cowpea, Pigeonpea and Greengram to Contribute Nitrogen to Maize in Rotation on Ferralsol in Tanga–Tanzania. Innovations as Key to the Green Revolution in Africa. Springer Netherlands: 317-323.
- Djigal D, Saj S, Rabary B, Blanchart E, Villenave C (2012) Mulch type affects soil biological functioning and crop yield of conservation agriculture systems in a long-term experiment in Madagascar. Soil Tillage Res 118: 11-21.
- Elfstrand S, Hedlund K, Mårtensson A (2007) Soil enzyme activities, microbial community composition and function after 47 years of continuous green manuring. Appl Soil Ecol 35: 610-621.
- Palm CA, Myers RJK, Nandwa SM (1997) Combined use of organic and inorganic nutrient sources for soil fertility maintenance and replenishment. In: Buresh RJ, Sanchez PA, Calhoun F (editors). Replenishing soil fertility in Africa, SSSA. American Society of Agronomy, Madison, Wisconsin, USA: 193–217.
- Mafongoya PL, Giller KE, Palm CA (1998) Decomposition and nitrogen release patterns of tree prunings and litter. Agrofor Syst 38: 77-97.
- Baijukya FP, De Ridder N, Giller KE (2006) Nitrogen release from decomposing residues of leguminous cover crops and their effect on maize yield on depleted soils of Bukoba District, Tanzania. Plant Soil 279: 77-93.
- Möller K (2009) Influence of different manuring systems with and without biogas digestion on soil organic matter and nitrogen inputs, flows and budgets in organic cropping systems. Nutr Cycl Agroecosyst 84: 179-202.
- Kisetu E, Mtakimwa ZS (2013) Incorporating pigeon pea compost with Minjingu fertilizer brands to determine their effects on maize production in Morogoro, Tanzania. World J Agric Sci 1: 294-298.
- Horneck DA, Miller RO (1998) Determination of total nitrogen in plant tissue. Handbook of reference methods for plant analysis 2: 75-83.
- Sims JT (2000) Soil test phosphorus: Bray and Kurtz P-1. Methods of phosphorus analysis for soils, sediments, residuals, and waters: 13-14.
- Cheng KL, Bray RH. 1951. Determination of Calcium and Magnesium in soil and plant material. Soil Sci 72:449-458.
- Rhoades JD (1982) Cation exchange capacity. Methods of soil analysis. Part 2. Chemical and microbiological properties. American Society of Agronomy, Madison, Wisconsin, USA : 149-157.
- Melillo JM, Aber JD, Linkins AE, Ricca A, Fry B, et al. (1989) Carbon and nitrogen dynamics along the decay continuum: Plant litter to soil organic matter. Plant Soil 115: 189-198.
- Palm CA, Sanchez PA (1990) Decomposition and nutrient release patterns of the leaves of three tropical legumes. Biotropica 22(4): 330-338.
- Campbell CA, Jame YW, Akinremi OO, Cabrera ML (1995) Adapting the potentially mineralizable N concept for the prediction of fertilizer N requirements. Nutr Cycl Agroecosyst 42: 61-75.
- Omollo JO, Abayo G (2011) Effect of phosphorus sources and rates on sugarcane yield and quality in Kibos, Nyando Sugar Zone. In Innovations as Key to the Green Revolution in Africa. Springer Netherlands: 533-537.
- Whitbread AM, Jiri O, Maasdorp B (2004) The effect of managing improved fallows of Mucuna pruriens on maize production and soil carbon and nitrogen dynamics in sub-humid Zimbabwe. Nutr Cycl Agroecosyst 69: 59-71.
- Cobo JG, Barrios E, Kass DCL, Thomas RJ (2002) Decomposition and nutrient release by green manures in a tropical hillside agroecosystem. Plant Soil 240: 331-342.
- Lehmann J, Schroth G, Zech W (1995) Decomposition and nutrient release from leaves, twigs and roots of three alley-cropping tree legumes in central Togo. Agrofor Syst 29: 21-36.
- Alvarez E, Marcos ML, Torrado V, Sanjurjo MJ (2008) Dynamics of macronutrients during the first stages of litter decomposition from forest species in a temperate area (Galicia, NW Spain). Nutr Cycl Agroecosyst 80: 243-256.
- Manzoni S, Jackson RB, Trofymow JA, Porporato A (2008) The global stoichiometry of litter nitrogen mineralization. Science 321: 684-686.
- Ågren GI, Bosatta E (1996) Theoretical Ecosystem Ecology. Understanding Element Cycles. Cambridge University Press, Cambridge. pp. 13-24.
- Baggs EM, Watson CA, Rees RM (2000) The fate of nitrogen from incorporated cover crop and green manure residues. Nutr Cycl Agroecosyst 56: 153-163.
- Thorup-Kristensen K, Magid J, Jensen LS (2003) Catch crops and green manures as biological tools in nitrogen management in temperate zones. Adv Agron 79: 227-302.
- Chikowo R, Mapfumo P, Nyamugafata P, Giller KE (2004) Maize productivity and mineral N dynamics following different soil fertility management practices on a depleted sandy soil in Zimbabwe. Agric Ecosyst Environ 102: 119-131.
- Randhawa PS, Condron LM, Di HJ, Sinaj S, McLenaghen RD (2005) Effect of green manure addition on soil organic phosphorus mineration. Nutr Cycl Agroecosystem 73: 181-189.
- Albrecht KA, Wedin WF, Buxton DR (1987) Cell-wall composition and digestibility of alfalfa stems and leaves. Crop Sci 27: 735-741.
- Quemada M, Cabrera ML (1995) Carbon and nitrogen mineralized from leaves and stems of four cover crops. Soil Sci Soc Am J 59: 471-477.
- Frossard E, Frossard M, Hedley MJ, Matherell A (1995) Reactions controlling the cycling of P in soil. In: TIESSNM, H., org. Phosphorus in the global environment: Transfers, cycles and management. John Wiley, Chichester. pp. 107-146.
- Giacomini SJ, Aita C, Vendruscolo ERO, Cubilla M, Nicoloso RS, et al. (2003) Dry matter, C/N ratio and nitrogen, phosphorus and potassium accumulation in mixed soil cover crops in Southern Brazil. Rev Bras Cienc Solo 27: 325-334.
- Hassan W (2013) C and N mineralization and dissolved organic matter potentials of two contrasting plant residues: effects of residue type, moisture, and temperature. Acta Agric Scand Sect B 63: 642-652.
- Hättenschwiler S, Vitousek PM (2000) The role of polyphenols in terrestrial ecosystem nutrient cycling. Trends Ecol Evol 15: 238-243.
- Brar MS, Khurana MPS, Kansal BD (2002) Effect of irrigation by untreated sewage effluents on the micro and potentially toxic elements in soils and plants. In 17. World Congress of Soil Science, Bangkok (Thailand) 14-21 Aug 2002.
- Bakken AK, Breland TA, Haraldsen TK, Aamlid TS, Sveistrup TE (2006) Soil fertility in three cropping systems after conversion from conventional to organic farming. Acta Agric Scand Sect B. 56: 81-90.
- Lavelle P, Spain AV (2001) Soil ecology. Dordrecht: Kluwer Academic: 642.
- Reddy KN, Zablotowicz RM, Locke MA, Koger CH (2003) Cover crop, tillage and herbicide effects on weeds, soil properties, microbial populations and soybean yield. Weed Sci 51: 987-994.
- Orcutt DM (2000) The physiology of plants under stress: soil and biotic factors. John Wiley & Sons 2: 31-54.
- Zhenghu D, Honglang X (2000) Effects of soil properties on ammonia volatilization. Soil Sci Plant Nutr 46: 845-852.
Open Access Journals
- Aquaculture & Veterinary Science
- Chemistry & Chemical Sciences
- Clinical Sciences
- Engineering
- General Science
- Genetics & Molecular Biology
- Health Care & Nursing
- Immunology & Microbiology
- Materials Science
- Mathematics & Physics
- Medical Sciences
- Neurology & Psychiatry
- Oncology & Cancer Science
- Pharmaceutical Sciences
