Related Study of Psychiatric Characteristics Classification using KLNS Method for Predicting Psychiatric Disorder
Md Sydur Rahman* and Boshir Ahmed
Department of Computer Science and Engineering, Rajshahi University of Engineering and Technology, Rajshahi, Bangladesh
*Corresponding author: Md Sydur Rahman, Department of Computer Science and Engineering, Bangladesh Army University of Science and Technology, Saidpur, Bangladesh, E-mail: sydur.ruet.113044@gmail.com
Received date: May 30, 2022, Manuscript No. JBBCS-22-13645; Editor Assigned date: June 01, 2022, PreQC No. JBBCS-22-13645 (PQ); Reviewed date: June 10, 2022, QC No. JBBCS-22-13645; Revised date: June 17, 2022, Manuscript No. JBBCS-22-13645 (R); Published date: June 30, 2022, DOI: 10.36648/jbbcs.5.4.4289.
Citation: Rahman MS, Ahmed B (2022) Related Study of Psychiatric Characteristics Classification using KLNS Method for Predicting Psychiatric Disorder. J Brain Behav Cogn Sci Vol.5 No.4: 4289.
Abstract
Psychiatry is the branch of medicine dealing with the study, diagnosis and treatment of mental disorders. A range of personal and interpersonal, community and familial factors in- fluence the overall health of a patient. A positive self-image, great communication skills, and the cultivation of resiliency are all components of mental health. Psychiatry contributes to the emergence of mental illness by distorting mental strength. Schizophrenia is a common term for a mental disorder that has more severe effects on women than on males. Psychologically unwell patients are more likely to participate in antisocial behavior. Consequently, social divides and conflict have developed. According to global data, anxiety, substance abuse, risky conduct, arrogance, suicide ideation, despair, disorientation, and consciousness are prevalent among 17-year-olds to 24-year-olds. The majority of these individuals want new experiences and independence, which results in unexpected mental illness. According to Adult Prevalence of Mental Illness (AMI) 2022, an unequal history of mental diseases has increased from 10.5 percent in 1990 to 19.86 percent in 2022, and psychiatry currently accounts for 14.3 percent of global mortality annually (approximately 8 million). Considering all the stated key factors for psychiatry a machine learning classifier has been predicted to classify the corresponding extracted features after applying KLNS (K-Nearest Neighbor (KNN), Logistic regression, Naieve Bayes and Support Vector Machine (SVM)) classifiers.
Keywords: Mental illness; Psychiatric characteristics; KLNS method; Statistical analysis; Result comparison; Prediction; Performance analysis
Introduction
In contrast to conventional classification techniques, machine learning classification is a hypothesis-free technique in which algorithms are learned from training data and then applied to multi-modal data to evaluate the relative categorical importance of multiple factors. A survey was conducted to evaluate psychiatric traits. Each group was given a certain number of questionnaires, which were distributed on a regular basis. In response to the overwhelmingly positive survey replies, a data collection system and processing environment were implemented.
This is due to the fact that there is currently no machine learning classifier that can properly detect the relative psychiatric level when several psychiatric variables and healthy controls are combined. Numerous machine learning algorithms are used to classify a large sample of data that has been exhaustively researched in order to assess the relative importance of various symptoms, mental strength, and the historical and contemporary goals of psychiatry. We hypothesized that by applying an SVM classifier to each predefined feature extracted from a suitable questionnaire, the algorithm would produce non-biased estimates of the most influential factors in classifying psychiatric disorders, which could then be used to inform classification strategies based on the extracted features.
All of the individuals, who had varying degrees of psychiatric disease, were statistically examined, and it is simple to determine a person’s mental competence, physical strength, and training by asking important questions. A secondary objective of the study would be to examine the distinctive characteristics of any healthy controls who were either diagnosed with a mental disease or did not appear to have one during the examination. Geographically, distinct age-based evaluations of psychiatric patients would be classified appropriately. After classifying all the data-sets with specific psychiatric characteristics, it would be easier to estimate a person’s mental capacity, and a recommendation to consult a psychiatrist would be made.
Background study
A machine learning classification method was utilized for medical decision-making that involved sophisticated multi- layer data, such as health evaluations, treatment decisions, and risk factor evaluation [1].
Concerning mental disorders, machine learning approaches have been classified to calculate the variance of different categories of psychiatric patients. Support Vector Machine (SVM) classifier has been used to classify the level of psychiatry using appropriate transformation and transposition of some key factors like anxiety, drug abuse, big risk-taking, arrogance, suicidal attempts, depression and confusion.
Generalized Anxiety Disorder (GAD) is one of the most common mental illnesses, although there is no quick clinical test for it. The goal of this study was to create a short self-report scale that could be used to detect possible instances of GAD and to test its reliability and validity [2].
The DAST-10 is a self-report tool that can be used for population screening, clinical case finding, and treatment evaluation research. It is suitable for both adults and older children. The DAST-10 is a ten-point scale that quantifies the severity of drug-abuse-related outcomes [3].
We approach hubris from a multidisciplinary perspective. We propose three categories of arrogance: individual, comparative and aggressive (each logically related to the next). From an incorrect impression of one’s own abilities to an incorrect judgment of them, an incorrect sense of superiority over others and concomitant disrespectful behavior [4].
Depression level has been analyzed with the reference of depression-anxiety self-assessment quiz [5].
Confusion, like other neurological or medical problems, requires the same examination principles. The doctor can in- crease the likelihood of a correct diagnosis and appropriate management by doing a thorough history, examination and observation [6].
Risk taking has intrigued both scientists and practitioners for centuries. Numerous studies have demonstrated that today’s measurement equipment is insufficiently valid and predictive. In light of current calls for more measures, this study will discuss six critical factors to consider when developing or implementing risk-taking concept measures. Additionally, keep in mind that taking risks is not synonymous with reckless behav ior, reassess passive risk-taking measurement and advocate for more realistic risk-taking activities In general, these concepts should assist researchers in developing more pertinent risk- taking assessments [7].
Consciousness has been addressed from a questionnaire of neuro-science [8]. When confronted with difficult multi-layer data, such as health evaluations, treatment decisions, and risk factor evaluations, a machine learning classification system was utilized to assist in making medical judgements [9].
Methodology
The goal of this thesis works to classify psychiatric characteristics using KLNS Method where K stands for KNN classifier, L for logistic regression, N for Naieve Bayes and S for Support Vector Machine (SVM). And also generate a statistical description of each classifier so that a comparative decision would be implemented. According to the statistics, we can easily predict who are severely, moderately carrying psychiatric disorder and who are free of any type of psychiatric disorder. For the concern, we have to follow some necessary steps.
- Data acquisition
- Feature extraction and
- Classification
Data acquisition
The first step is to collect data with a survey for the following psychiatric characteristics: Anxiety, drug-abuse, risk-taking tendency, arrogance, confusion and depression with adequate questionnaires. The answer to each question has been ranked as values 0,1,2,3 for proper measurement. Then tabular data has been generated from the responses of each individual. The total number of questions required a numeric categorical threshold of the factor which means its existence.
Then sum up the total values of the specified characteristic to generate the score. A similar type of action has been performed for the stated psychiatric characteristics.
Generalized Anxiety Disorder (GAD) is defined by an abnormally high level of concern or anxiety that persists for an extended period of time with no apparent explanation. These emotions are uncontrollable, and the person is usually aware that their fear is unfounded; for example, the simple thought of accomplishing daily tasks might cause anxiety. We assumed that the GAD-7 test would be used to collect data from anxious patients. Sample data for anxiety measurement has been stated in Table 1.
| Q1 | Q2 | Q3 | Q4 | Q5 | Q6 | Q7 | Anxiety |
|---|---|---|---|---|---|---|---|
| 1 | 2 | 2 | 2 | 2 | 3 | 3 | 15 |
| 3 | 2 | 3 | 2 | 2 | 2 | 3 | 17 |
| 2 | 2 | 3 | 2 | 1 | 1 | 2 | 13 |
| 1 | 1 | 3 | 2 | 3 | 3 | 3 | 16 |
| 2 | 1 | 2 | 1 | 2 | 2 | 2 | 12 |
Table 1: Sample data for anxiety measurement.
The Drug Abuse Screen Test (DAST-10) is a self-report instrument that can be used for screening populations, identifying clinical cases, and evaluating treatments in research. It is suitable for both adults and adolescents. The DAST-10 is a numerical indicator for assessing the severity of drug-related side effects. The measure, which can be administered as a self-report or an interview, is administered in roughly five minutes. In a variety of situations, the DAST can be used to quickly diagnose drug abuse problems. Sample data for drug abuse range has been stated in Table 2.
| Q1 | Q2 | Q3 | Q4 | Q5 | Q6 | Q7 | Q8 | Drug abuse |
|---|---|---|---|---|---|---|---|---|
| 3 | 0 | 3 | 2 | 3 | 0 | 0 | 0 | 11 |
| 0 | 0 | 3 | 0 | 0 | 0 | 0 | 0 | 3 |
| 3 | 0 | 3 | 0 | 3 | 0 | 0 | 0 | 9 |
| 0 | 2 | 0 | 3 | 3 | 0 | 0 | 2 | 10 |
| 0 | 0 | 2 | 2 | 3 | 3 | 2 | 2 | 14 |
Table 2: Sample data for drug abuse range.
Regarding the issue of arrogance, we employ an interdisciplinary strategy. We examine six factors that contribute to stimulation, each of which is interconnected with the previous factor [10]. From a defective understanding and lack of abilities, the ingredients progress to an inaccurate evaluation of them, an illogical sense of superiority over others, and a display of contempt. Although each component is likely to be present to some degree when the next component operates, causation may flow in any direction between components. Sample data for Arrogance Level has been stated in Table 3.
| Q1 | Q2 | Q3 | Q4 | Q5 | Q6 | Arrogance |
|---|---|---|---|---|---|---|
| 3 | 3 | 3 | 2 | 2 | 3 | 16 |
| 3 | 3 | 3 | 3 | 3 | 3 | 18 |
| 0 | 0 | 2 | 2 | 3 | 3 | 10 |
| 2 | 2 | 2 | 0 | 3 | 0 | 9 |
| 3 | 0 | 0 | 3 | 3 | 2 | 11 |
Table 3: Sample data for arrogance level.
Clinical depression, unipolar depression, and major depressive disorder are all synonyms for major depressive disorder. Depression is defined by, among other symptoms, a depressed mood and/or a loss of interest and pleasure in daily activities. Symptoms appear daily and persist for at least two weeks. Depression affects many aspects of an individual’s life, including job and social relationships. Depression that is melancholic or psychotic might be mild, moderate, or severe [11]. Sample data for Depression Level measurement has been stated in Table 4.
| Q1 | Q2 | Q3 | Q4 | Q5 | Q6 | Q7 | Dep level |
|---|---|---|---|---|---|---|---|
| 3 | 3 | 3 | 2 | 0 | 2 | 0 | 13 |
| 0 | 3 | 2 | 0 | 0 | 0 | 0 | 5 |
| 3 | 2 | 3 | 3 | 3 | 3 | 3 | 20 |
| 3 | 2 | 3 | 3 | 3 | 3 | 2 | 19 |
| 2 | 3 | 0 | 0 | 3 | 3 | 0 | 11 |
Table 4: Sample data for depression level measurement.
Risk-taking behavior is the propensity to participate in potentially damaging or dangerous activities. This encompasses alcohol abuse, binge drinking, the use of illegal substances, driving under the influence of alcohol, and unprotected sexual conduct [12]. The Centers for Disease Control and Prevention (CDC) report that these behaviors raise the likelihood of unintentional injury and violence. Sample data for big risk taking tendency has been stated in Table 5.
| Q1 | Q2 | Q3 | Q4 | Q5 | Q6 | Q7 | Q8 | Q9 | Risk Taking |
|---|---|---|---|---|---|---|---|---|---|
| 2 | 2 | 3 | 0 | 2 | 0 | 3 | 2 | 0 | 14 |
| 0 | 3 | 3 | 2 | 0 | 0 | 3 | 2 | 0 | 13 |
| 2 | 0 | 2 | 2 | 3 | 3 | 2 | 3 | 3 | 20 |
| 3 | 2 | 2 | 3 | 0 | 3 | 0 | 0 | 3 | 16 |
| 0 | 2 | 0 | 3 | 2 | 2 | 2 | 3 | 3 | 17 |
Table 5: Sample data for big risk taking tendency.
The term confusion refers to a reduction in cognitive aptitude, or our capacity to think, learn, and comprehend. Dementia is usually accompanied by a decline in cognitive functioning. Confusion is characterized by problems with short-term memory, trouble doing tasks, a short attention span, inaccurate speech, and difficulty following a discussion. Occasionally, confusion may occur, but it will pass. Long-lasting chronic illness has the potential to cause confusion on occasion. Sample data for confusion level measurement has been stated in Table 6.
| Q1 | Q2 | Q3 | Q4 | Q5 | Q6 | Q7 | Con Level |
|---|---|---|---|---|---|---|---|
| 3 | 0 | 2 | 3 | 2 | 0 | 3 | 13 |
| 3 | 3 | 3 | 3 | 3 | 2 | 3 | 20 |
| 3 | 3 | 2 | 0 | 2 | 2 | 3 | 15 |
| 3 | 2 | 3 | 3 | 3 | 3 | 3 | 20 |
| 3 | 0 | 0 | 0 | 2 | 0 | 2 | 7 |
Table 6: Sample data for confusion level measurement.
Feature extraction
We must first extract the features from the dataset before we can apply SVM to it. A sample data of six psychiatric factors namely anxiety, drug abuse, arrogance, depression, risk taking tendency and confusion has been given in Table 7. While the data is being scaled for feature extraction, it is also being divided into two feature sets, with the lowest feature set to zero and the highest feature set to one. A compression algorithm reduces the size of the data to ensure that it fits inside a given range, which is commonly from 0 to 1. Data is altered by scaling attributes to a specific range, which is controlled by an attribute scaler. When used to condense a distribution of values into a defined range of values, it does so while maintaining the structure of the original distribution (Table 7).
| Anxiety | Drug | Arrogance | Depression | Risk | Confusion |
|---|---|---|---|---|---|
| 5 | 6 | 7 | 13 | 14 | 11 |
| 10 | 3 | 6 | 5 | 13 | 4 |
| 15 | 0 | 9 | 20 | 20 | 13 |
| 17 | 0 | 11 | 19 | 16 | 20 |
| 12 | 11 | 10 | 11 | 17 | 15 |
| 13 | 9 | 6 | 21 | 20 | 20 |
Table 7: Sample data-set with six psychiatric features.
The Min Max scaling is calculated using:
x std=(x–x min(axis=0))/(x max(axis=0)–x min(axis=0))x scaled=x std(max–min)+min where, min, max=feature range x min(axis=0): Minimum feature value x max(axis=0): Maximum feature value.
Feature extraction
We must first extract the features from the dataset before we can apply KNN, logistic regression, Naieve Bayes, SVM to it.
A sample data of six psychiatric factors namely anxiety, drug abuse, arrogance, depression, risk taking tendency and confusion has been given in Table 8.
| Anxiety | Drug abuse | Arrogance | Depression | Risk taking tendency | Confusion |
|---|---|---|---|---|---|
| 5 | 6 | 7 | 13 | 14 | 11 |
| 10 | 3 | 6 | 5 | 13 | 4 |
| 15 | 0 | 9 | 20 | 20 | 13 |
| 17 | 0 | 11 | 19 | 16 | 20 |
| 12 | 11 | 10 | 11 | 17 | 15 |
| 13 | 9 | 6 | 21 | 20 | 20 |
Table 8: Sample data-set with six psychiatric features.
Min Max scaler divides the feature’s values by the feature’s range after subtracting the feature’s minimum value from each value. The range represents the difference between the highest and lowest initial values. Min Max scaler preserves the shape of the initial distribution. It has no influence on the original information of the data. Notably, Min Max scaler does not diminish the relevance of outliers. Min Max scaler generates a characteristic with a default value range of 0 to 1 [13]. While scaling the data for feature extraction, it is divided into two feature sets, with the lowest feature set equal to zero and the highest feature set equal to one. Compression techniques are used to fit data into a certain range, which is often between 0 and 1. Scaling attributes to a given range, as determined by an attribute scalar, modifies the data. It condenses a value distribution into a specified range of values while preserving the original distribution’s structure. The Min Max scaler is executed using the formula:
x std=(x–x min(axis = 0))/(x max(axis=0)–x min(axis=0)) (1)
x scaled=x std(max–min)+min (2)
where,
min, max=feature range
x min(axis=0): Minimum feature value x max(axis=0): Maximum feature value
A sample scaled data has been given in Table 9.
| Anxiety | Drug Abuse | Arrogance | Depression | Risk Taking Tendency | Confusion |
|---|---|---|---|---|---|
| 0.2222222 | 0.3333333 | 0.3888889 | 0.5789474 | 0.40909091 | 0.55 |
| 0.5 | 0.1666667 | 0.3333333 | 0.1578947 | 0.36363636 | 0.2 |
| 0.7777778 | 0 | 0.5 | 0.9473684 | 0.68181818 | 0.65 |
| 0.8888889 | 0 | 0.6111111 | 0.8947368 | 0.5 | 1 |
| 0.6111111 | 0.6111111 | 0.5555556 | 0.4736842 | 0.54545455 | 0.75 |
| 0.6666667 | 0.5 | 0.3333333 | 1 | 0.68181818 | 1 |
Table 9: Scaled features.
KNN classifier
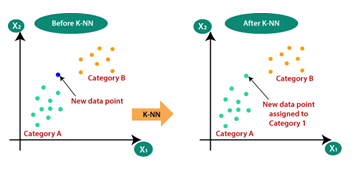
The K-nearest neighbour approach is a basic supervised learning technique. The K-NN method assumes that new cases/data are equivalent to old cases and assigns them to the category that best matches the old categories. For each new data point, the K-NN algorithm compares it to previously classified data to classify it. Using the K-NN method, new data may be quickly sorted into categories [14] (Figure 1).
To begin, we’ll choose the number of neighbors, and hence choose k=5. Following that, the Euclidean distance between the two data points will be determined. The Euclidean distance is a concept introduced in geometry. It is the distance between the two points. After that finally calculating the Euclidean distance we got the nearest neighbors from different classes.
Logistic regression
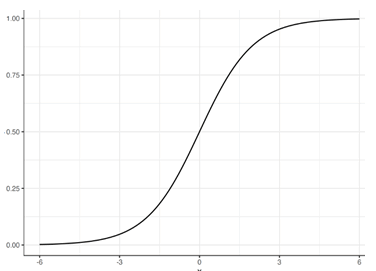
Multiple categorization challenges are natively supported in multinomial logistic regression. By default, logistic regression can only classify two classes. However, to apply some extensions such as one vs-rest, the classification problem must first be split into several binary classification problems [15].
To accommodate multi-class classification issues natively, the multinomial logistic regression algorithm changes the loss function to cross-entropy loss and the predict probability distribution to a multinomial probability distribution which has been strongly stated in Figure 2.
Naieve Bayes classifier
In the Naieve Bayes technique, the Bayes rule is supplemented with a strong assumption that the characteristics are conditionally independent given the class. Despite the fact that this criteria for independence is sometimes ignored in practice, the accuracy of Naieve Bayes classification is generally comparable. Naieve Bayes is frequently utilized in practice because to its computational efficiency and a boatload of other enticing features [16].
Naieve Bayes is a form of bayesian network classifier based on Bayes’ rule using the formula stated below:
P (y|x)=P (y)P (x|y)/P (x) (3)
SVM classifier
SVM is a powerful binary classifier capable of differentiating between two classes. SVM is both linear and nonlinear in nature, with the equation determining the linear hyper-plane and the equation determining the nonlinear hyper-plane:
f (x)=< w.x >+b (4)
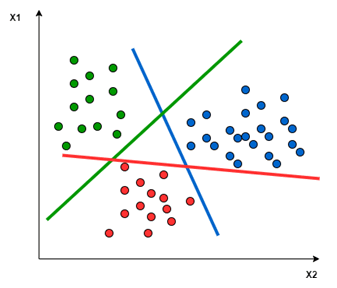
Where x represents the observed data point, w the normal vector, and b a bias factor. We performed train-test-split for the derived dataset to apply the SVM classifier. Our 70% of data is being used as training set. And on the other-hand 30% data of our data is used for testing set [17]. As the data-set contains three different classes of psychiatric patients namely severe level, moderate level and normal patients. Non-linear SVM with polynomial kernel has been applied to categorize the tested data-set [18]. Applying SVM classifier, two different hyper-planes have been drawn to distinguish three different classes of psychiatric patients in Figure 3.
Performance Analysis
Performance evaluation is performed using the following statistical measurements [19]. Using the known terminologies of performance analysis, a statistical description is stated.
True Positive (TP): Class level is induced by each characteristic and the classifier correctly determines its level.
False Positive (FP): The class level does not experience the characteristic but the classifier misinterprets the level as under the characteristics.
True Negative (TN): The class level is not induced by characteristic and the classifier correctly interprets that the class level is not under characteristic.
False Negative (FN): The class level is induced by features but the classifier misinterprets as the level is not under the characteristics.
Recall (sensitivity): Recall is the ratio of accurately predicted positive observations to all observations in the actual class.
Recall (sensitivity)=TP/(TP+FN) (5)
Specificity: Ability of the classifier to correctly identify the class level not under the characteristics.
Specificity=TN/(TN+FP) (6)
Precision/Positive Predictive Value (PPV): Precision is defined as the proportion of accurately anticipated positive observa- tions to the total number of positively predicted observations.
Precision=TP /(TP+FP) (7)
Negative Predictive Value (NPV): The probability that the class level is not under features, when the classifier identifies that the level is not induced by the following characteristics.
Negative Predictive Value (NPV)=TN/(TN+FN). (8)
F1 Score: The weighted average of precision and recall is used to get the F1 Score. As a result, both false positives and false negatives are considered while calculating this score. F1 isn’t as intuitive as accuracy, but it’s usually more beneficial, especially if your class distribution is unequal. When false positives and false negatives cost the same, accuracy is maximized. It’s advisable to consider both precision and recall if the cost of false positives and false negatives is considerably different.
F1 score=2*(Recall*Precision)/(Recall+Precision). (9)
Classification accuracy of the classifier: It is the ratio of the total number of correct assessments to the total number of assessments.
Accuracy=(TN+TP)/(TN+TP+FN+FP). (10)
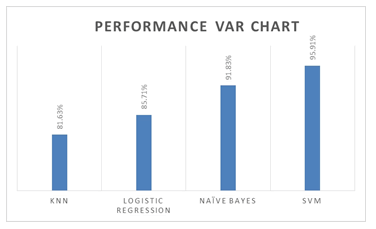
Accuracy found for different classifiers has been defined in Table 10.
| Applied classifier | Accuracy |
|---|---|
| KNN classifier | 81.63% |
| Logistic regression classifier | 85.71% |
| Naive Bayes classifier | 91.83% |
| SVM with polynomial kernel | 95.91% |
Table 10: Accuracy of different applied classifier.
Results
We can easily analysis the statistical findings applying KNN, logistic regression, Naieve Bayes, SVM on different characteristics of Psychiatry.
And classification reports for KNN, logistic regression, Naieve Bayes, SVM have been defined in Tables 11-14.
| Class | Precision | Recall | f1-score | Support |
|---|---|---|---|---|
| 0 | 0.97 | 0.86 | 0.91 | 36 |
| 1 | 0.43 | 0.43 | 0.43 | 7 |
| 2 | 0.6 | 1 | 0.75 | 6 |
| accuracy | 0.82 | 49 | ||
| macro avg | 0.67 | 0.76 | 0.7 | 49 |
| weighted avg | 0.85 | 0.82 | 0.82 | 49 |
Table 11: Classification report of KNN classifier.
| Class | Precision | Recall | f1-score | Support |
|---|---|---|---|---|
| 0 | 0.94 | 0.97 | 0.95 | 31 |
| 1 | 0.86 | 0.67 | 0.75 | 9 |
| 2 | 0.9 | 1 | 0.95 | 9 |
| accuracy | 0.96 | 49 | ||
| macro avg | 0.9 | 0.88 | 0.88 | 49 |
| weighted avg | 0.92 | 0.92 | 0.91 | 49 |
Table 12: Classification report for polynomial kernel of SVM.
| Class | Precision | Recall | f1-score | Support |
|---|---|---|---|---|
| 0 | 0.97 | 0.97 | 0.97 | 30 |
| 1 | 0.73 | 0.89 | 0.8 | 9 |
| 2 | 1 | 0.8 | 0.89 | 10 |
| accuracy | 0.92 | 49 | ||
| macro avg | 0.9 | 0.89 | 0.89 | 49 |
| weighted avg | 0.93 | 0.92 | 0.92 | 49 |
Table 13: Classification report for Naive Bayes classifier.
| Class | Precision | Recall | f1-score | Support |
|---|---|---|---|---|
| 0 | 1 | 0.77 | 0.87 | 39 |
| 1 | 0 | 0 | 0 | 0 |
| 2 | 1 | 0.8 | 0.89 | 10 |
| accuracy | 0.85 | 49 | ||
| macro avg | 0.67 | 0.52 | 0.59 | 49 |
| weighted avg | 1 | 0.78 | 0.87 | 49 |
Table 14: Classification report for logistic regression classifier.
ROC of SVM with Polynomial Kernel
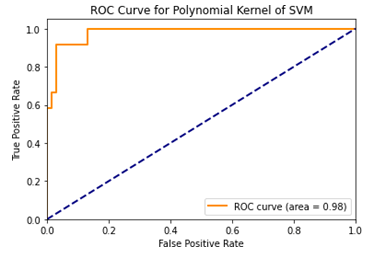
Plotting all the classified features of psychiatry generated from train-test-splitting criterion we got a ROC for a single class for the polynomial kernel of applied SVM classifier which has been represented by Figure 5.
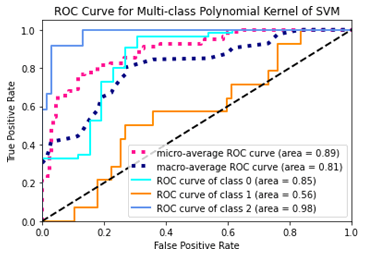
Finally, we got ROC curve for all the classified level of psychiatry for the data-set manipulated from the stated characteristics of psychiatry for the polynomial kernel of SVM which has been represented by Figure 6.
Prediction
A predictive study has been designed for any individual using some questionnaires for each characteristic using KNN, Logistic Regression, Na¨Ä±ve Bayes, SVM with polynomial kernel.
Considering all classification reports and ROC curves for each classifier, we have finally found that the accuracy of our proposed methodology of SVM with polynomial kernel retains the highest accuracy of 96%.
Conclusion
We have discovered a system for accurately classifying psychiatric diseases. Following the completion of a survey on many psychiatric characteristics, the approach was used to build a statistical study in which an individual can easily verify his mental strength by following the appropriate steps and applying a support Vector Machine (SVM) classifier.
Acknowledgment
We would also like to show our gratitude to the authority and staff of mental hospital, Pabna, Bangladesh for sharing their documents of each psychiatric patient and pearls of wisdom with us to attain the goal of data collection during the course of this research, and we specially thank to Dr. Ratan Kumar Ray for his tremendous support and co-operation to collect data.
References
- Walsh-Messinger J, Jiang H, Lee H, Rothman K, Ahn H, et al. (2019) Relative importance of symptoms, cognition, and other multilevel variables for psychiatric disease classifications by machine learning, Psychiatr Res 278: 27-34.
[Crossref], [Google Scholar], [Indexed]
- Spitzer RL, Kroenke K, Williams JB, Lowe B (2006) A brief measure for assessing generalized anxiety disorder: The gad-7," Arch Int Med 166: 1092-1097.
[Crossref], [Google Scholar], [Indexed]
- French MT, Roebuck MC, McGeary KA, Chitwood DD, McCoy CB, et al. (2001) Using the drug abuse screening test (dast-10) to analyze health services utilization and cost for substance users in a communitybased setting. Subst Use Misuse 36: 927-943.
[Crossref], [Google Scholar], [Indexed]
- Cowan N, Adams EJ, Bhangal S, Corcoran M, Decker R, et al. (2019) Foundations of arrogance: A broad survey and framework for research. Rev Gen Psychol 23: 425-443. 2019.
[Crossref], [Google Scholar], [Indexed]
- Epstein-Lubow G, Gaudiano BA, Hinckley M, Salloway S, Miller IW (2010) Evidence for the validity of the american medical association's caregiver self-assessment questionnaire as a screening measure for depression. J Am Geriatr Soc 58: 387-388.
[Crossref], [Google Scholar], [Indexed]
- Johnson MH (2001) Assessing confused patients. J Neurol Neurosurg Psychiatry 71 suppl 1: i7-i12.
[Crossref], [Google Scholar], [Indexed]
- Bran A, Vaidis DC (2020) Assessing risk-taking: What to measure and how to measure it. J Risk Res 23: 490-503.
[Crossref], [Google Scholar]
- Vink P, Tulek Z, Gillis K, Jonsson AC, Buhagiar J, et al. (2018) Consciousness assessment: A questionnaire of current neuroscience nursing practice in europe. J Clin Nurs 27: 3913-3919.
[Crossref], [Google Scholar], [Indexed]
- Hortal E, Ubeda A, anez EI, Planelles D, Azorin JM (2013) OnlineËœclassification of two mental tasks using a svm-based bci system," in 2013 6th International IEEE/EMBS Conference on Neural Engineering (NER). IEEE: 1307-1310.
[Crossref], [Google Scholar]
- Thorngate W (1976) Ignorance, arrogance and social psychology: A response to helmreich. Pers Soc Psychol 2: 122-126.
[Crossref], [Google Scholar]
- Durstewitz D, Koppe G, Meyer-Lindenberg A (2019) Deep neural networks in psychiatry. Mol Psychiatr 24: 1583-1598.
[Crossref], [Google Scholar], [Indexed]
- Bzdok D, Meyer-Lindenberg A. Machine learning for precision psychiatry: Opportunities and challenges. Biol Psychiatr Cogn Neurosci Neuroimaging 3: 223-230.
[Crossref], [Google Scholar], [Indexed]
- Saranya C, Manikandan G (2013) A study on normalization techniques for privacy preserving data mining. Int J Eng Technol 5: 2701-2704, 2013.
[Crossref], [Google Scholar]
- Zhang (2020) Cost-sensitive KNN classification. Neurocomputing 391: 234-242.
[Crossref], [Google Scholar]
- Karsmakers P, Pelckmans K, Suykens JA (2007) Multi-class kernel logistic regression: A fixed-size implementation. IEEE 18: 1756-1761.
[Crossref], [Google Scholar]
- Rish I (2001) An empirical study of the naive bayes classifier. in IJCAI 2001 workshop on empirical methods in artificial intelligence 3: 41-46.
- Mayoraz E, Alpaydin E (1999) Support vector machines for multi-class classification. In international work-conference on artificial neural networks. Springer pp: 833-842.
- Hsu CW, Lin CJ (2002) A comparison of methods for multiclass support vector machines. IEEE Trans Neural Netw13: 415-425.
[Crossref], [Google Scholar], [Indexed]
- Vanitha L, Suresh GR (2013) Hybrid svm classification technique to detect mental stress in human beings using ecg signals," in 2013 International Conference on Advanced Computing and Communication Systems. pp: 1-6.
[Crossref], [Google Scholar]
Open Access Journals
- Aquaculture & Veterinary Science
- Chemistry & Chemical Sciences
- Clinical Sciences
- Engineering
- General Science
- Genetics & Molecular Biology
- Health Care & Nursing
- Immunology & Microbiology
- Materials Science
- Mathematics & Physics
- Medical Sciences
- Neurology & Psychiatry
- Oncology & Cancer Science
- Pharmaceutical Sciences
