ISSN : 2348-9502
American Journal of Ethnomedicine
Nutritional Evaluation of Curcuma Species Collected from Different Agro Climatic Regions of Chhattisgarh
Akanksha Jain and Parihar DK*
Department of Biotechnology, Guru Ghasidas Vishwavidyalaya, Koni, Bilaspur, Chhattisgarh, India
- *Corresponding Author:
- Parihar DK
Department of Biotechnology
Guru Ghasidas Vishwavidyalaya
Koni, Bilaspur, India
Tel: +9977170733
Fax: +91-7752-260148
E-mail: parihardkp@rediffmail.com
Received Date: December 05, 2017; Accepted Date: December 20, 2017; Published Date: December 29, 2017
Citation: Jain A, Parihar DK (2017) Nutritional Evaluation of Curcuma Species Collected from Different Agro Climatic Regions of Chhattisgarh. Am J Ethnomed Vol.4 No.2:20
Abstract
In present study rhizomes of Curcuma longa, Curcuma caesia and Curcuma aromatica from different regions of Chhattisgarh choose for best chemo type identification based on their nutritional evaluation and proximate analysis. Curcuma samples collected from Sarguja district showed highest antioxidant potential in most of the in-vitro assay. All the values compared by standard curcumin and showed significant variation in region wise. It can be conclude from the result that irrespective of the origin or variety, Curcuma is a good natural reservoir of energy whose nutritive components can be used as a food supplement.
Keywords
Curcuminoids; Curcumin; Radical scavenging activity; Nutrition; Lowry’s method; Anthrone
Introduction
In past century traditional systems of medication have been used and medicinal plants have played a crucial role to treat lots of disease. Therefore in recent practices plant secondary metabolites have been extensively used as a source of medicinal agents [1]. Antimicrobial agents of plant origin are not associated with side effect and are also cheap, easily available and affordable as compare to the synthetic drugs [2]. There is a wide diversity of compounds isolated from plants, especially secondary metabolites, and studies have shown that these compounds have anticancer, antibacterial, analgesic, anti-inflammatory, antitumor, antiviral and many other activities to a greater or lesser extent [3,4]. phytochemical compounds include flavonoids, phenols and phenolic glycosides, saponins and cyanogenic glycosides, stilbenes, tannins, nitrogen compounds (alkaloids, amines, betalains), terpenoids and some other endogenous metabolites [3,5].
Curcuma plants (rhizomes and leaves) have a camphoraceous aroma and contain many functional compounds such as phenolics, flavonoids and different antioxidant enzymes. Genus Curcuma is a medicinal plant that botanically belongs to Zingiberacea family [6]. It is also known as “Indian saffron”, as it was are taken from the flowers, rhizome, roots or leaves broadly used as a substitute to the more costly saffron of numerous plants and provide specific color, smell, spice [7,8]. Zingiberacea is best known for its antioxidant and blood purifier, clear skin color, remove wounds, antimicrobial properties against pathogens. It hepatoprotective, stop liver obstruction, heals wound, is widely consumed as a flavoring, preservative and stimulant and sedative [9]. Components of turmeric are named curcuminoids which include mainly curcumin (diferuloylmethane, demethoxycurcumin, and bismethoxycurcumin). Curcumin biochemical name is diferuloylmethane and the important curcuminoids contain lots of biological activities. It is soluble in organic solvents but insoluble in water [10]. Curcumin, have a potent antioxidant, antiinflammatory, anti-platelet, cholesterol lowering, antibacterial and antifungal effects [11].
It has a high nutritional status like rich source of carbohydrates, proteins, alkaloids, flavonoids etc. vitamins or vitamin precursor found in curcumin which produces vitamin C, beta-carotene as well as polyphenol coupled with fatty acid and essential oil. Turmeric leaves are great source of vitamin and minerals [6]. Rhizome of Curcuma longa used traditionally as household remedy in curing various diseases such as anorexia, cough, rheumatism and intestine disorder. Curcuma caesia is commonly known as black turmeric (Kali haldi) which is a perennial herb found throughout the Himalayan region, North-east and central India. The paste of rhizome is used traditionally for the treatment of leucoderma, asthma, tumor, piles etc. Curcuma caesia has medicinal value due to its bioactive compound viz alkaloids, steroids, phenolics, and tannins. The rhizome oil of C. Caesia contains 76.6% δ-camphor; 1,8-cineole (9.06%), ocimene (15.66%), 1-ar-curcumene (14.84%), δ-camphor (18.88%), δ-linalool (20.42%), δ-borneol (8.7%) and zingiberol (12.60%) [12]. Curcuma caesia has scientifically studied for various therapeutical activities like antioxidant, antibacterial, antipyretic, larvicidal, insecticidal, antimicrobial, wound healing and anti-hyperglycemic [13]. These include free radical scavenging, antioxidant, anti-thrombotic, antiapoptotic, anti ischemic, anti-arhythmic, anti-hypertensive, and antiinflammatory activities [14]. The rhizomes of C. aromatica possess a reputed property to promote health conditions by arresting ageing and have immunomodulatory effects. Therefore it has to be need to investigate turmeric and its other species scientifically so that it would not be used only traditionally but industrially in food and drug production. This study will give an insight of the nutritional, phytochemical evaluation of ethanolic rhizome extracts of Curcuma longa collected from different locations of Chhattisgarh (India). The objectives of this work are to determine the proximate, vitamin, nutritional, phytochemical property of different chemotypes of Curcuma longa, Curcuma caesia and Curcuma aromatica. The present study explores the nutritional status of three non convensional Curcuma chemotypes by profiling their biochemical attributes i.e. protein, carbohydrate, fats and many more.
Materials and Methods
Materials and reagents
Rhizome of Curcuma longa L. (BH-Bargaon District-Rajnadgaon, MH-Margaon District-Rajnadgaon, NH-Navagaon District- Rajnadgaon, UH: Udhyaniki Bilaspur, SH-Sarguja), Curcuma caesia Roxb. (AK-Acholi District-Rajnadgaon, ANK-Andi Balod district, BKBenderkatta District-Rajnadgaon, SK: Sarguja, ICC: IGKV Bilaspur, RK: Ratanpur Bilaspur), Curcuma aromatica Salibs(JA: Jamsarar District-Rajnadgaon, BA-Bargaon District-Rajnadgaon, GA-Ganeri District-Rajnadgaon, ABJA: Aaybhandha beet, MA-Manhora Salhe District-Rajnadgaon, ICA-IGKV Bilaspur, SJ-Sarguja) species were collected from different agroclimatic location/villages of Chhattisgarh, India. Gallic acid, ascorbic acid, potassium ferricyanide(III), DPPH (2,2-diphenyl-1-picryhydrazyl),2,2- azino-bis(3-ethylbenzothiazoline)-6 sulphonic acid (ABTS), 2,4,6-tripyridyl-s-tiazine (TPTZ), tannic acid, Quercetin, aluminum chloride, FeCl3, sodium nitroprusside, sulphanilic acid, NEDD, Curcumin (Himedia), Camphor (SRL), sodium phosphate, ammonium molybdate, anthrone, were purchased from Sigma- Aldrich (USA). Folin-Ciocalteu’s phenol reagent, trichloro acetic acid (TCA), solvents ethanol, methanol and other reagents were of analytical grade. Ultrapure water (Elix, Merck Millipore, India) was used throughout the experiments.
Rhizome extract of Curcuma species
For the extract preparation the regional rhizome samples of Curcuma species were dried and grounded to fine powder. For extraction of curcuminoids ethanol (E) were used in soxhlet extraction unit (Decibel). All the extracts were evaporated to dryness and concentrated the extract using vacuum evaporator for further use. The graphical representation of nutritional evaluation of Curcuma has shown in Figure 1.

Figure 1: The graphical representation of nutritional evaluation.
Estimation of Curcumin
Estimation of Curcumin was done by following the standard [15-17] rhizome extract of C. longa used to quantify the curcumin content. Prepare a series of dilution and the absorption maxima of curcumin will be measured at 425 nm. Curcumin content measured by formula as follows:
Curcumin content g/100 g=0.0025 × A425 × vol. make up × Dilution factor × 100/0.42 × weight of sample × 1000
Estimation of Camphor
C. Caesia and C. aromatica rhizome extracts were used to quantify camphor content. Prepare a series of dilution and the absorption maxima of camphor was measured at 288 nm. Camphor content measured by calibration curve of camphor.
Protein estimation by Lowry’s method
Protein can be estimated by method developed from previous study [18]. The stock solution of Lowry’s reagent prepared as 2% sodium carbonate in 0.1 N NaOH (Reagent A), 0.5% copper sulphate in 1% potassium sodium tartrate (Reagent B). Mix 50 ml of A and 1 ml of B to prepare alkaline copper solution (Reagent C). Folin-Ciocalteau reagent (Reagent D). Take 500 mg dry rhizome powder of C. longa, C. Caesia, C. aromatica. Add 5 ml of PBS and grind well with a pestle and mortar. Centrifuge at 5000 rpm for 10 min then use the supernatant for protein estimation. Take 100 μl sample and make the volume up to 1 ml. Add 5 ml of reagent C mix well and allow to stand for 10 min then add 0.5 ml of reagent d and incubate at room temperature in dark for 30 min. Blue color is developed by the reduction of the phosphomolybdic – phosphotungstic component and absorbance take at 660 nm. Draw the calibration curve of standard BSA and calculate the amount of protein in the sample.
Protein estimation by Bradford method
Preparation of Bradford reagent as 100 mg of Coomassie brilliant blue in 50 ml of 95% ethanol then add 100 ml of concentrated ortho phosphoric acid make up the volume up to 200 ml by DW. Take 1 ml of dye with 4 ml of distilled water for use as working of Bradford reagent. Protein of Curcuma species was extracted in PBS. Add 5 ml of diluted dye to protein sample and mix well allow the color to develop for 10 min. and absorbance was taken at 595 nm. Plot a standard curve of BSA and calculate the protein in experimental sample using the calibration line [19].
Estimation of starch by anthrone
Total carbohydrate content can be determined by the method [20]. Take 200 mg anthrone in 100 ml of ice cold 95% H2SO4 prepare fresh before use. 50 mg of dry rhizome powder of C. longa, C. Caesia, C. aromatica hydrolyse by 2.5 ml of 2.5 N HCl by keeping it in a boiling water bath and make the volume to 50 ml, centrifuge at 5000 rpm for 10 min then collect the supernatant for analysis. Prepare the standard glucose 1 mg/ml stock and prepare the dilution series of glucose and make the volume upto 1 ml in all the tubes. Then add 4 ml of anthrone reagent and heat for eight minutes in boiling water bath and absorbance take at 630 nm. Concentration of carbohydrate was calculated in standard curve of glucose.
Phenol sulphuric acid method for total carbohydrate
The phenol sulphuric acid method to estimate total carbohydrate was described by the method [21,22] with slight modification. Prepare the standard glucose 1 mg/ml by taking (200 μg/ml-25 μg/ml) of working standard. Make up the volume to 1 ml in all the tubes including plant sample prepare in 2.5 N HCl by adding DW. Then add 1 ml of 5% phenol solution to each test tube, add 5 ml of 96% sulphuric acid mix properly and add 5 ml of DW. Heated all the tubes in water bath at 25-30°C for 20 min after cooling read the color intensity at 490 nm. Draw the calibration curve and calculate the amount of carbohydrate present in sample.
Estimation of total free amino acids
In a test sample add 1 ml of ninhydrin solution to each tube mix well and allow the color to develop for 20 min in a boiling water bath add 2 ml distilled water and after 15 min the intensity of the purple color measured against a reagent at 570 nm. Draw the standard graph using absorbance versus concentration find out the concentration of the total free amino acids in the sample and express as percentage equivalent of leucine [23].
Quantification of lipid content
The vanillin reagent was used for estimation of lipid, method described [24] with slight modification. Take 0.25 ml of standard Lipid (Oleic acid) and sample and placed in boiling water bath at 100°C to allow the solvent to evaporate. Add 0.1 ml of concentrated H2SO4 vortex and heated at 100°C for 10 min. Cool the sample and add 2.4 ml of vanillin reagent (100 mg vanillin in 100 ml hot water and 400 ml 85% phosphoric acid) then pink color develop after 5 min, reaction mixture were diluted with 5 ml of DW and read the absorbance at 490 nm.
Spectrophotometric analysis of quantitative estimation of vitamin C
Ascorbic acid was oxidised by copper to form dehydroascorbic acid and diketoglutaric acid. These products when treated with 2,4-dinitrophenyl hydrazine (DNPH) forms the derivative bis-2- 4-dinitro phenylhydrazone, which underwent rearrangement to found a product with absorption maximum at 520 nm. Thiourea provided a mild reducing medium that helped to prevent interference from non-ascorbic acid chromogens [25]. In a 5 mg of rhizome powder was treated with 4 ml of 10% TCA then centrifuged for 20 min at 3500 rpm. Take 0.5 ml of supernatant and mixed with 0.1 ml DTC reagent (2, 4-dinitrophenyl hydrazinethiourea- copper sulphate reagent). DTC - In 100 ml 9 N H2SO4, 0.4 g thiourea, 0.05 g copper sulphate and 3.0 g DNPH were dissolved). The tubes were incubated at 37°C for 3 hr. 0.75 ml of ice cold 65% HCl was added and the tubes were allowed to stand at RT an additional 30 min. A set of standards containing 10-50 μg of vitamin C was processed similarly along with a blank containing 0.5 ml of 10% TCA. The color developed was read at 520 nm.
Estimation of carotenoids
Carotenoid content was determined by method given [26]. Dissolve 0.05 g of weighed moisture free rhizome powder (C. longa, C. Caesia, and C. aromatica) dissolve in 2 ml 80% acetone and centrifuge at 5000 rpm for 10 min. Take supernatant and volume made up to 5 ml. Read the absorbance of solution at 480 and 510 nm. The carotenoid content was calculated by the formula as follows: 7.6 [E480-1.49 E510].
Moisture content
Moisture was determined by the standard [27]. One grams of well-mixed sample were weighed accurately in clean preheated dish of known weight by using sensitive balance. The uncovered sample and dish were kept in an oven provided with a fan at 105°C and let to stay 3 hr. The dish was covered and transferred to a desiccator and weighed after reaching room temperature. The loss of weight was calculated as present of sample weight and expressed as moisture content.
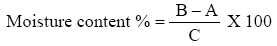
Where
B=wt of sample containing petriplate after drying
A=wt of sample containing
C=wt of sample used
Oil/Fat content determination
Total fat was determined by previous study [28]. One grams of sample were placed in extraction thimple and plugged by a piece of cotton, then the thimple was placed in soxhlet extractor. A dry and accurately weighted flask was fitted to the extractor, then solvent (Petroleum ether) was poured in to the flask, the extractor and condenser was fitted together. Water was allowed to flow through the condenser and heat was applied from an electrical heater, extraction period from 6-8 hr. After that the solvent was distilled off, pour the oil in empty petriplate dried in oven for 30 min at 100°C, cooled and weighed.
The Fat content was calculated according to the following equation.
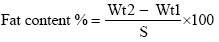
Where:
Wt1=weight of empty plate.
Wt2=weight of plate with extracted oil.
S=weight of sample.
Ash content determination
Total ash was determined according to previous studies [28]. One grams of well mixed sample were weighed in porcelain crucible of known weight. The crucible ignited at 550°C in a muffle furnace until light gray ash was obtained. The content of the crucible was cooled in desiccator and weighed soon after it reached room temperature. Percentage of ash calculated from the increase in the weight of the crucible.
Ash content was calculated using the following equation:
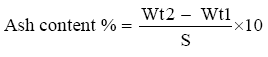
Where:
Wt1=weight of the crucible with sample.
Wt2=weight of the crucible with ash.
S=weight of sample.
Protein content determination
Nitrogen content determinations were made on the sample by micro-kjeldahl technique following the method from previous studies [29]. 1 gm of rhizome samples were weight accurately into a micor kjeldahl flask, 0.4 gm of catalyst mixture (90% potassium sulphate and 10% cupric sulphate) and 3.5 ml of concentrated sulphuric acid were added, the flask was placed in the digestion equipment for 3 hours. The sample placed in the distillation apparatus; 20 ml of 40% NaOH were added. The ammonia evolved was received in 10 ml of 2% Boric acid solution. The trapped ammonia is titrated against 0.02 M HCl using universal indicator (methyl red+bromocresol green).
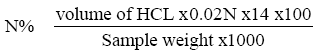
Protein%=N% X 6.25.
Carbohydrate determination
The carbohydrate content was determined according to previous studies [30] by subtracting the total crude protein, oil, moisture and ash from the total dry matter.
Carbohydrate (%)=100 - {Moisture (%)+Protein (%)+Fat (%)+Ash (%)}
Determination of total polyphenolic content (TPC)
The concentration of total polyphenolic content (TPC) in plant extracts was determined using Folin Ciocalteau method described by previous studies [31] with slight modification. Different regional extract of rhizome of (C. longa, C. Caesia and C. aromatica) in concentration of 1 mg/ml was used for analysis. To 0.4 ml of extract was added to 2 ml of 10% Folin Ciocalteau’s reagent and 1.6 ml of 20.25% Sodium carbonate. After shaking the sample were incubated in dark for 2 h. The absorbance were determined using spectrophotometer at 738 nm. The samples were prepared in triplicates for each analysis and the mean value of absorbance was obtained. The calibration line was constructed by gallic acid as standard. The Total phenolic content were expressed as μg of gallic acid equivalents per mg of sample.
Determination of total flavonoids
Aluminum chloride spectrophotometric method was used for flavonoids determination described by previous studies [32]. Take 250 μl of extracts (1 mg/ml) were mixed with 1.25 ml of distilled water and 75 μl of 5% NaNO2 solution. After 5 min, 150 μl of 10% AlCl3 solution was added. After 6 min, 500 μl of 1 M NaOH and 275 μl of distilled water were added to the mixture. The solution was mixed well and the absorbance was read at 510 nm. Different concentrations of Quercetin was used to plot standard curve and the results were expressed as μg of (±) - Quercetin Equivalents per mg of extract (QUEs).
Result and Discussion
Estimation of Curcumin
Curcumin is one such widely studied pharmaceutical bioactive compound that was first discovered about two centuries ago from the rhizomes of C. longa [33,34]. Curcumin has the potential to treat a wide variety of inflammatory diseases including cancer, diabetes, cardiovascular diseases, arthritis, Alzheimer's disease, psoriasis, etc. [35]. Yellow color of curcumin was showed maximum absorbance at 425 nm. All regional samples of C. longa showed varying content of curcumin in there rhizome because of lots of environmental and genetic factor. Curcumin content measured in range of BH: 4.35 ± 1.12, NH: 5.21 ± 0.15, MH: 6.68 ± 2.45, SH: 6.51 ± 0.08, and UH: 4.63 ± 0.04 g/100 g.
Estimation of camphor
As compare to C. longa camphor is found abundant in C. Caesia and C. aromatica, therefore in this study we estimate the camphor content in regional samples of same. Camphor is a bioactive compound of many pharmaceutical importance. Camphor concentration in g/100 g obtain in AK-22.87 ± 6.11, ANK: 23.01 ± 9.86, BK: 21.41 ± 4.16, SK-29.14 ± 4, ICC: 25.41 ± 3.05, RK-24.41 ± 11.0, SJ-26.94 ± 2, JA-20.54 ± 7.57, BA-19.21 ± 4.16, ABJA-18.27 ± 7.02, GA: 19.47 ± 3.05, MA: 19.14 ± 5.29, ICA- 20.27 ± 1.15.
Determination of protein content by Bradford and Lowry’s method
The blue color developed by the reduction of the phosphomolybdic phosphotungstic components in the Folin-Ciocalteau by the amino acids tyrosine and tryptophan present in the protein and color developed by the biuret reaction of protein with the alkaline cupric tartrate are measured in the Lowry’s method [36]. In bradford method protein binds to coomassie brilliant blue G250 and form a complex whose extinction coefficient is much greater than of the free dye. Protein content of Curcuma species collected from different region were estimated by Bradford and Lowry’s method. Highest protein content was observed in RK, C. Caesia in Bradford test with value 221.41 ± 16.65 and highest aromatic amino acid also found to be high in AK, C. Caesia sample by Lowry’s method, 322.39 ± 5.31 μg/mg lowest protein concentration was found to be 42.53 ± 2.54 μg/mg of SH in Bradford method and in Lowry’s method MA have a lowest protein content 66.43 ± 7.80 μg/mg. All the result was shown in Table 1. According to result we can say that C. Caesia have a high concentration of protein as compare to other two species of Curcuma.
Table 1: Nutrient composition of Curcuma rhizome.
| Curcuma species | Sample | Carbohydrate (Anthrone test) (μg/mg) | Carbohydrate (phenol sulphuric acid method) (μg/mg) | Protein (Bradford method) (μg/mg) | Protein (Lowry’s method) (μg/mg) | Free Amino acid (Leucin method) (μg/mg) | Lipid(vaniline test) (μg/mg) | Carotenoids (μg/mg) | Vitamin C(g/100g) |
|---|---|---|---|---|---|---|---|---|---|
| Curcuma longa | BH | 730.52 ± 1.79*** | 616.06 ± 8.83*** | 144.19 ± 0.48*** | 220.18 ± 3.47*** | 111.69 ± 1.37*** | 1.12 ± 0.05*** | 15.99 ± 0.33*** | 0.76 ± 20.02*** |
| NH | 741.35 ± 4.59** | 577.87 ± 6.03*** | 127.80 ± 0.48*** | 116.22 ± 4.06*** | 111.06 ± 1.09*** | 1.04 ± 0.006*** | 17.96 ± 0.01ns | 1.34 ± 26.25*** | |
| MH | 560.64 ± 13.9*** | 682.72 ± 10.3*** | 154.47 ± 0.48*** | 159.97 ± 0.95*** | 73.444 ± 1.37*** | 1.92 ± 0.006*** | 18.09 ± 0.10ns | 1.98 ± 37.27 | |
| SH | 583.26 ± 10.9*** | 681.21 ± 10.3*** | 42.527 ± 2.54*** | 94.770 ± 6.16*** | 144.07 ± 0.55*** | 2.92 ± 0.009*** | 16.06 ± 0.11*** | 0.39 ± 12.50*** | |
| UH | 723.97 ± 3.39*** | 715.45 ± 1.83*** | 64.472 ± 10.7*** | 146.02 ± 4.01*** | 669.63 ± 5.49*** | 2.14 ± 0.016*** | 18.13 ± 0.01 | 1.57 ± 20.80*** | |
| Curcuma caesia | AK | 708.73 ± 5.48*** | 634.84 ± 10.65*** | 155.86 ± 0.48*** | 322.89 ± 5.31 | 195.19 ± 6.59*** | 1.53 ± 0.05*** | 1.15 ± 0.03*** | 0.20 ± 18.79*** |
| ANK | 671.71 ± 1.08*** | 682.72 ± 12.62*** | 146.41 ± 0.83*** | 82.062 ± 1.25*** | 76.142 ± 0.82*** | 1.63 ± 0.01*** | 0.76 ± 0.03*** | 0.37 ± 0.32*** | |
| BK | 719.69 ± 10.8*** | 723.03 ± 9.106*** | 154.19 ± 1.27*** | 139.14 ± 4.16*** | 156.14 ± 7.42*** | 0.84 ± 0.04*** | 0.76 ± 0.03*** | 0.19 ± 5.88*** | |
| SK | 724.09 ± 8.28*** | 730.90 ± 13.72*** | 188.08 ± 12.6** | 122.06 ± 2.72*** | 324.39 ± 5.22*** | 4.88 ± 0.01 | 0.87 ± 0.03*** | 0.29± 2.24*** | |
| ICC | 664.80 ± 13.8*** | 523.33 ± 4.665*** | 173.08 ± 19.5*** | 131.02 ± 3.81*** | 621.38 ± 4.12*** | 1.58 ± 0.01*** | 0.79 ± 0.03*** | 0.64 ± 21.85*** | |
| RK | 760.88 ± 6.68ns | 754.92 ± 12.33** | 221.41 ± 16.6 | 129.35 ± 7.81*** | 229.95 ± 9.89*** | 4.03 ± 0.01*** | 0.90 ± 0.03*** | 0.40 ± 32.23*** | |
| Curcuma aromatica | SJ | 694.80 ± 13.69*** | 775.15 ± 32.83ns | 128.08 ± 19.70*** | 91.02 ± 1.44*** | 157.73 ± 4.67*** | 0.72 ± 0.02*** | 5.46 ± 0.02*** | 0.22 ± 16.27*** |
| JA | 740.76 ± 4.404** | 735.75 ± 6.449*** | 144.75 ± 0.83*** | 140.3 ± 3.14*** | 88.523 ± 1.64*** | 0.47 ± 0.02*** | 0.21 ± 0.02*** | 0.09 ± 8.09*** | |
| BA | 741.35 ± 4.285** | 722.72 ± 12.72*** | 144.47 ± 0.962*** | 151.6 ± 6.00*** | 38.841 ± 2.74*** | 2.39 ± 0.02*** | 0.49 ± 0.01*** | 0.07 ± 4.98*** | |
| ABJA | 746.35 ± 1.904* | 723.93 ± 10.53*** | 148.36 ± 1.272*** | 162.6 ± 7.68*** | 149.31 ± 4.39*** | 2.46 ± 0.02*** | 0.21 ± 0.01*** | 0.07 ± 2.88*** | |
| GA | 733.85 ± 3.690*** | 670.60 ± 9.106*** | 142.80 ± 15.64*** | 150.6 ± 6.29*** | 843.60 ± 3.85 | 2.04 ± 0.02*** | 0.23 ± 0.02*** | 0.09 ± 11.47*** | |
| MA | 743.02 ± 2.380** | 691.21 ± 6.385*** | 127.80 ± 14.68*** | 66.43 ± 7.80*** | 330.33 ± 0.27*** | 1.51 ± 0.02*** | 0.37 ± 0.02*** | 0.05 ± 2.24*** | |
| ICA | 767.90 ± 6.309 | 794.54 ± 12.23 | 202.52 ± 3.849ns | 269.77 ± 1.90*** | 625.34 ± 0.27*** | 0.84 ± 0.02*** | 0.17 ± 0.01*** | 0.10 ± 8.32*** |
Values represent mean ± standard deviation (SD) of three independent experiments (n=3). Significantly different from highest activity control at ***p<0.0001, **p<0.001, *p<0.05. Graph pad prism 5 One way ANOVA by Dunnett’s tests.Samples are collected from various places of Chhattisgarh as BH: Bargaon District-Rajnadgaon, MH: Margaon District-Rajnadgaon, NH: Navagaon District-Rajnadgaon, UH: UdhyanikiBilaspur, SH: Sarguja, AK: Acholi District-Rajnadgaon, ANK: AndiBalod district, BK: Benderkatta District-Rajnadgaon, SK: Sarguja, ICC: IGKV Bilaspur, RK: RatanpurBilaspur, JA: Jamsarar District-Rajnadgaon, BA: Bargaon District-Rajnadgaon, GA: Ganeri District-Rajnadgaon, ABJA: Aaybhandha beet, MA: ManhoraSalhe District-Rajnadgaon, ICA: IGKV Bilaspur, SJ: Sarguja.
Starch estimation by anthrone method
Starch present in sample bind to anthrone and forms a green colored product, which can be showed an absorption maximum at 630 nm [37]. The total carbohydrate content of all the Curcuma samples collected from different regions were varied significantly to each other. Anthrone method is most commonly used for estimation of total carbohydrate content. Carbohydrate content of all the three species of Curcuma varied from 767.90 ± 6.3 to 560.64 ± 13.9 μg/mg eq to glucose. The highest starch content was observed in 767.90 ± 6.3 μg/mg of ICA. Rather than lowest amount of starch was observed in MH. Starch present in all the samples were summarized in Table 1.
Total carbohydrate estimation by phenol sulphuric acid
Phenol sulphuric acid method is also used for total carbohydrate estimation of Curcuma. The carbohydrate content was expressed of Curcuma. The carbohydrate content was expressed in terms of eq to glucose (Standard curv Y=0.0011x-0.022, R2=0.956). The carbohydrate content range from 794.54 ± 12.23 to 577.87 ± 6.03 μg/mg eq to glucose. Here that same as anthrone method ICA have highest content of carbohydrate in all among the sample. Minimum concentration of carbohydrate was found to be NH 577.87 ± 6.03. All the values are significant to each other (p< 0.05).
Ninhydrin by leucin free AA test
Ninhydrin, a powerful oxidizing agent, decarboxylates the alpha amino acids and yields an intensely colored bluish purple product which is colorimetrically measured at 570 nm [38,39]. Free Amino acid was found to be varying range in all the regional sample of Curcuma. GA, have a highest concentration of free amino acid. It can be determined by ninhydrin test which bind to free amino acid in the sample and convert yellow to purple color. GA and ICC contain high% of free amino acid with 859 and 830.90 ± 53.6 μg/mg. lowest value was observed in MH Curcuma longa sample with the value range 73.44 ± 1.37 μg/mg.
Lipid estimation by vanillin reagent
Vanillin test is used for estimation of lipid content in the sample. SK observed that high percent of lipid quantity with 4.38 ± 0.01 μg/mg and lowest concentration was found to be JA 0.47 ± 0.02 μg/mg. Varying range of lipid content was noted in all the regional sample and all the result shown in Table 1.
Carotenoids
Carotenoids, the tetraterpenoid (C40) compounds, are ubiquitous in plants. These terpenoids existing as hydrocarbons (carotenes) or oxygenated derivatives, are accessory pigments in photosynthetic systems and give characteristic color to plant parts. Estimation of carotenoids present in the regional samples of all the three species of Curcuma was done by standard protocol, highest percent of carotenoids was observed in (UH Bilaspur) C. longa extract with 18.13 ± 0.01 μg/mg and lowest yield of carotenoids was found to be ICA C. aromatica 0.17 ± 0.01 μg/mg. Results were shown in Table 1. C. longa have a much higher percent of carotenoids as compare to other two species of Curcuma. Protein, carbohydrate, free amino acid, lipid, vitamin C and carotenoid concentration present in each samples of all three Curcuma species present in table:
Proximate analysis
Proximate analysis of all the regional Curcuma genotypes were determined in standard protocol. Result should be present in Table 2 [40-49].
Table 2: Proximate analysis of rhizome of Curcuma genotypes.
| Curcuma species | Samples | % moisture content | Nutrient percent % (DM) | ash % | % Crude protein | Fat % | Carbohydrate % |
|---|---|---|---|---|---|---|---|
| Curcuma longa | BH | 6.1 | 93.9 | 1.95 | 15.26 | 2.5 | 97.5 |
| NH | 6 | 94 | 1.9 | 15.13 | 4.4 | 95.6 | |
| MH | 9.5 | 90.5 | 1.94 | 15.62 | 2.3 | 97.7 | |
| SH | 9.3 | 90.7 | 1.85 | 15.92 | 2.6 | 97.4 | |
| UH | 6.56 | 93.44 | 1.9 | 16 | 2 | 98 | |
| Curcuma caesia | AK | 6.4 | 93.6 | 2.24 | 20.81 | 0.6 | 99.4 |
| ANK | 7.6 | 92.4 | 2.41 | 18.88 | 0.4 | 99.6 | |
| BK | 12.2 | 87.8 | 1.98 | 20.57 | 1.2 | 98.8 | |
| SK | 7.97 | 92.03 | 2.21 | 20.44 | 1.3 | 98.7 | |
| ICC | 9.3 | 90.7 | 2.22 | 20.69 | 2.4 | 97.6 | |
| RK | 5.3 | 94.7 | 2.48 | 20.71 | 1.3 | 98.7 | |
| Curcuma aromatica | SJ | 19 | 81 | 3.21 | 19.44 | 2.5 | 97.5 |
| JA | 13.8 | 86.2 | 3 | 17.52 | 1.4 | 98.6 | |
| BA | 8.1 | 91.9 | 2.8 | 18.23 | 2.1 | 97.9 | |
| ABJA | 7 | 93 | 3.54 | 18.73 | 3.83 | 96.17 | |
| GA | 9.6 | 90.4 | 2.9 | 18.85 | 5.8 | 94.2 | |
| MA | 6.5 | 93.5 | 3.36 | 18.09 | 5 | 95 | |
| ICA | 9.8 | 90.2 | 2.54 | 18.42 | 1.6 | 98.4 |
Samples are collected from various places of Chhattisgarh as BH: Bargaon District-Rajnadgaon, MH: Margaon District-Rajnadgaon, NH: Navagaon District-Rajnadgaon, UH: UdhyanikiBilaspur, SH: Sarguja, AK: Acholi District-Rajnadgaon, ANK: AndiBalod district, BK: Benderkatta District-Rajnadgaon, SK: Sarguja, ICC: IGKV Bilaspur, RK: RatanpurBilaspur, JA: Jamsarar District-Rajnadgaon, BA: Bargaon District-Rajnadgaon, GA: Ganeri District-Rajnadgaon, ABJA: Aaybhandha beet, MA: ManhoraSalhe District-Rajnadgaon, ICA: IGKV Bilaspur, SJ: Sarguja.
Total phenolic content
The total phenolic content in the examined plant extracts differ in region wise using the follin cioclteu’s reagent is expressed in terms of gallic acid equivalent the standard curv (Y=0.0067x+0.095, R2=0.99). Total phenolic content in the examined samples ranged from 25.81 ± 4.91: 151.33 ± 13.9 μg/mg eq to gallic acid. The highest concentration of phenols was measured in ESH, EUH and ESJ with 151.33 ± 13.9, 141.23 ± 14.6 and 138.7 ± 3.27 μg/mg eq to gallic acid respectively. Standard curcumin contain 151.66 ± 22.4 μg/mg eq to gallic acid, these is much similar to ESH. The order of TPC was as follows: Curcumin>ESH>EUH>ESJ>ENH>EBH >EMH>ERK>EMA>EICA>ESK>EBA>EGA>EANK>EICC>EAK>EABJA> EJA>EBK.
Total flavonoid content
The flavonoid content was measured by aluminum chloride spectrophotometric method. Regional variations was observed in TFC with significant difference to each other and also show significant difference as compare to curcumin. Curcumin have a highest flavonoids as compare to others but ESH and ESJ have also contain promising flavonoid content which show much antioxidant potential. TFC value range from 14.10 ± 3.24: 106.8 ± 2.76 μg/mg eq to QUE. Curcumin TFC value 144.57 ± 2.68 μg/ mg eq to QUE. Flavonoid is responsible for antioxidant as well as antimicrobial activity. The order of TFC was as follows: Curcumin >ESH>ESJ>ENH>EBH>EUH>EABJA>EBK>EBA>ERK>ESK>EMH>EM A>EICA>EANK>EICC>EJA>>EAK>EGA.
Conclusion
From the nutritional analysis of Curcuma species, it was found that the rhizome of Curcuma rich in carbohydrate 55-70%, protein 13-19% and crude lipid 2-5%. Therefore, it may be used as potentially attractive source of lipid, protein and carbohydrate. In addition, the rhizome is a good source of vitamin C that are important for our health. The extract is nutritionally rich as it contains some essential vitamins and nutrient needed for body growth. The results of the study support the development of new drugs, which is ecofriendly and safe to health.
References
- Idris S, Ndukwe GI, Gimba CE (2009) Preliminary phytochemical screening and antimicrobial activity of seed extracts of Perseamericana (avocado pear). Bayero Journal of Pure and Applied Sciences 2: 173-176.
- Anand SP, Doss A,Nandagopalan V (2011) Antibacterial studies on leaves of Clitoriaternatea Linn-a high potential medicinal plant. International journal of applied biology and pharmaceutical technology 2: 453-456.
- Cai YZ, Luo Q, Sun M, Corke H (2004) Antioxidant activity and phenolic compounds of 112 traditional Chinese medicinal plants associated with anticancer. Life Sci 74: 2157-2184.
- Miliauskas G, Venskutonis PR, Beek TA (2004) Screening of radical scavenging activity of some medicinal and aromatic plant extracts. Food Chem 85: 231-237.
- Abdelwahab SI, Abdul AB, Elhassan MM, Mohan S, Mariod AA(2010) Phenolic Content and antioxidant activities of Goniothalamusumbrosus extracts. Int J Nat Prod Pharm Sci 1: 1-6.
- Chattopadhyan L, Biswas K, Bandyo-Padhyay U,Banerjee RL (2004) Turmeric and Curcumin: Biological Action and Medicinal Applications. Current Science 87: 44-53.
- Hanif R, Qiao L,Shiff SJ (1997)Curcumin, a natural plant phenolic food additive, inhibits cell proliferation and induces cell cycle changes in colon adenocarcinoma cell lines by a prostaglandin-independent pathway. J Lab Clin Med 130: 576-584.
- Pundir RK, Jain P (2010) Comparative studieson the antimicrobial activity of black pepper (pipernigrum) and turmeric (Curcuma longa) extracts. IntJ Applied Bio Pharm Technol 2: 492-501.
- Ahmad W, Hassan A, Ansari A,Tarannum T(2010) Cucurma longa L-A Review. Hippocratic J Unani Med 5: 179-190.
- Joe BM, Vijaykumar M,Lokesh BR (2004) Biological properties of curcumin-cellular and molecular mechanisms of action. Critical Reviews in Food Science and Nutrition 44: 97-111
- Peter KV (2000) Informatics on Turmeric and Ginger. India Spices 36: 12-14.
- Asem SD, Laitonjam WS (2012) Investigation of the structure - nonlinearity relationship of Zederone from the rhizomes of curcuma caesiaRoxb. Indian Journal of Chemistry 51B: 1738-1742.
- Sahu R,Saxena J (2013) A brief review on medicinal value of Curcuma caecia. International journal of pharmacy & life sciences.4: 2664-2666.
- Nandave M, OjhaSK (2005) Review Article Protective role of flavonoids in cardiovascular diseases. Natural Product Radiance4: 166-176.
- Himesh S, Sharan PS (2011) Qualitative and quantitative profile of Curcuma from ethanolic extract of Curcuma longa. International research journal of pharmacy: 180-184.
- Bagchi A (2012) Extraction of Curcumin. IOSR journal of environmental science, toxicology and food technology.
- Lowry OH (1951) Rosebrough NJ, Farr AL, Randall RJ (1951) J Biol Chem.
- Kruger NJ (2002) The Bradford Method for Protein Quantitation. In: Walker JM (eds.) The Protein Protocols Handbook. Humana Press
- Hedge JE, Hofreiter BT (1962) In: Whistler RL, Be Miller JN (eds.)Carbohydrate Chemistry, 17, Academic press, New York.
- Dubois M, Gilles KA, Hamilton JK, Rebers PA, Smith F (1956) Anal Chem 26:350.
- Krishnaveni S,BalasubramanianT, Sadasivam S (1984) Food Chem.
- Moore S, Stein WH (1948)Colowick SP,Kaplan ND(eds.) Methods in Enzymol, Academic press, New York.
- Handel EV (1985)Rapid determination of total lipids in mosquitoes.
- Omaye ST, Turnbull JD, Sauberlich HE(1962) Selected Methods for the Determination of Ascorbic Acid in Animal Cells, Tissues and Fluids. Academic Press, New York.
- Kim SJ, Min SC, Shin HJ, Lee YJ, Cho AR, et al. (2013)Evaluation of the antioxidant activities and nutritional properties of ten edible plant extracts and their application to fresh ground beef. Meat Science 93: 715-722
- AOAC (1984) Official method of analysis. (14thedn), Association of Official analytical chemists, Arlington, Virginia, USA.
- AOAC(1990) Official methods of analysis of the Association of official agricultural chemists, 15th edition. Association of official analytical chemists. Arlington, VA,USA.
- AOAC (1975) Official methods of analysis. Association of official agricultural chemists, (2nd edition), Washington DC.
- Antia BS, Akpan EJ, Okon PA, Umoren I(2006) Nutritive and anti-nutritive evaluation of sweet potatoes (Lpomoeabatatas) leaves. Pakistan J Nutr5: 166-168.
- Singleton VL, Orthofer R, Lamuela-Raventos RM (1999) Analysis of total phenols and other oxidation substrates and antioxidants by means of Folin-Ciocalteau reagent. Method Enzymol 299:152-178.
- Dewanto V, Wu X, Adom KK, Liu RH (2002) Thermal processing enhances the nutritional value of tomatoes by increasing total antioxidant activity. Food Chemistry 50: 3010-3014.
- Priya R, Prathapan A, Raghu KG,Menon AN (2012) Chemical composition and in vitro antioxidative potential of essential oil isolated from Curcuma longa L. leaves Asian Pacific Journal of Tropical Biomedicine S695-S699
- Benzie IFF, Strain JT (1996)The ferric reducing ability of plasma (FRAP) as a measure of antioxidant power, the FRAP assay.
- Garrat DC (1964) The Quantitative analysis of Drugs. Chapman and Hall Ltd, Japan 3: 456-458.
- Hazra B, Biswas S,Mandal N (2008) Antioxidant and free radical scavenging activity of Spondiaspinnata BMC Complementary and Alternative Medicine.
- Prieto P, Pineda M, Aguilar M (1999) Anal Biochem 269: 337-341.
- Halliwell B, Guttridge JMC, Aruoma OI(1987) Analytical biochemistry 165: 215-219.
- Aruoma OI, Halliwell B (1987) Action of hypochlorous acid on the antioxidant protective enzymes superoxide dismutase, catalase and glutathione peroxidase. Biochem J248:973-976.
- Vogel A, Pelletier J.Examenchimique de la racine de Curcuma. J Pharm 1:289-300.
- Gupta SC, Patchva S, Koh W, Aggarwal BB (2012) Discovery of curcumin, a component of golden spice, and its miraculous biological activities. Clin ExpPharmacolPhysiol39: 283-299.
- Pari L, Tewas D, Eckel J (2008) Role of curcumin in health and disease. Arch PhysiolBiochem114: 127-49.
- Mattoo RL(1970) Influence of sodium chloride on the colorimetric determination of protein in plant tissues rich in phenols-phenolases. Indian J Biochem7: 82-83.
- Thayumanavan B, Sadasivam S (1984) Qual. Plant Foods Hum Nutr.
- Misra PS, Mertz ET, Glover DV (1975) Cereal chem.
- Balsubramanian T, sadasivam S (1987) Plant Foods Hum Nutr 37.
- Gülçin I (2007) Comparison of in vitro antioxidant and antiradical activities of L-tyrosine and L-Dopa. Amino Acids 32: 431-438.
- Gülçin ME, BüyükokurogluM, KüfreviogluO (2003) Antioxidant and analgesic activities of turpentine of PinusnigraArn. Subsp. pallsiana (Lamb.) Holmboe. J Ethnopharmacol 86: 51-58.
- Halliwell B, Gutteridge JMC(1985) Free radicals in biology and medicine. Oxford University Press. UK.
- Al-Reza SM, Rahman A, Sattar MA, Rahman MO, Fida HM (2010) Essential oil composition and antioxidant activities of Curcuma aromaticaSalisb. Food and Chemical Toxicology 48: 1757-1760.
Open Access Journals
- Aquaculture & Veterinary Science
- Chemistry & Chemical Sciences
- Clinical Sciences
- Engineering
- General Science
- Genetics & Molecular Biology
- Health Care & Nursing
- Immunology & Microbiology
- Materials Science
- Mathematics & Physics
- Medical Sciences
- Neurology & Psychiatry
- Oncology & Cancer Science
- Pharmaceutical Sciences