Evaluating the effect of milling speed and screen size on power consumed during milling operation
*A.A. Adenigba and S.D. Oluwagbayide
Department of Agricultural and Bio-Environmental Engineering, Federal Polytechnic Ilaro, Ogun State, Nigeria. P.M.B 50.
*Corresponding author: A.A. Adenigba, Department of Agricultural and Bio-Environmental Engineering, Federal Polytechnic Ilaro, Ogun State, Nigeria. P.M.B 50, Tel: 08067338770; E-mail: demydeabillions@gmail.com
Received date: October 06, 2020; Accepted date: August 23, 2021; Published date: September 3, 2021
Citation: A.A. Adenigba (2021) Evaluating the effect of milling speed and screen size on power consumed during milling operation. Insights Aquac Cult Biotechnol Vol.5 No.2.
Abstract
This study was conducted to evaluate the effect of rotor speed and screen size on power consumed during milling operation. The milling system was tested using three fish feed ingredients; bone meal, groundnut cake and maize, the moisture content of the ingredients bought from the market are 13.1%, 14.7% and 17.5% dry basis respectively. The milling machine was evaluated with 3 kg of each feed ingredient and was replicated three times for each of the experimental parameters. The machine parameters varied during the experiment includes four screen size (1.5 mm, 2.0 mm, 2.5 mm and 3.0 mm) and five rotor speeds (1500 rpm, 1800 rpm, 2100 rpm, 2400 rpm and 2700 rpm). Regression analysis was carried out on the data collated. The analysis was used to develop model which is capable of predicting the electrical energy (kJ) consumed. There was no significant effect of screen size on the average power consumed during milling since there is no linear relationship between power consumed and screen size. However, there is a significant effect of speed on average power consumed, the power consumed increases as speed decreases therefore making milling operation at higher speed to be cost effective since it doesn’t require much power to achieve the required output. The P-Value depicts that screen size has no significant effect on the electrical energy consumed during the milling operation while speed has significant effect on the electrical energy used at 95% confidence level.
Keyword: Electrical energy, Milling, Power, Screen size, fish feed and Rotor speed
Introduction
In ancient times, cereal grains were crushed between two stones and made into crude cake. The advent of modern automated systems employing steel material such as hammer mills has revolutionized the processing of cereals and their availability as human foods and for other purposes (Donnel 1983). Most of the existing hammermill machines are designed for very large-scale production by the multinational companies such as breweries, feed mills and flour mills. But due to the recent sensitization of the public on the need for self-employment, there is an increase in small-scale companies. Thus, there is a very high demand for small-scale hammermill machines (Adekomaya and Samuel 2014). Nowadays there are increasing attempts to develop standard practical diets for farmed fish in Nigeria. A wide range of feed stuffs are produced as by-products from animal processing industries. Some of this feed stuffs are currently used in rations for both terrestrial animals and fish (Udo and Umoren, 2011). Since fish feeds are generally the largest single cost item of most fish farm operations, it follows that the selection of meal ingredients for use within diets will play a major role in dictating its ultimate nutritional and economic success (Ovie and Eze, 2013).
This project aims to alleviate the problems of peasant farmers in rural settlements and animal feed production companies, whose wish is to process their grain/cereal into animal feed at the minimum energy cost. Due to the exorbitant fee being levied as energy (power) tariff, some millers don’t do adequate milling in order to cut down the energy consumed during the milling process, this recurrent behavior has led to production of feed with inappropriate particle size. The primary aim of this work is to evaluate the effect of milling (rotor) speed and screen size on the energy consumed during milling operation.
Materials and method
Materials
The fish feed ingredients used for the performance evaluation were sourced from commercial feed milling centers (freedom feed mill and K2 feed mill) within Akure, Ondo state, Nigeria. The ingredients used are bone meal, groundnut cake and maize grain.
The Milling Machine
The milling system consist of the following components, the electric motor, transmission system, pneumatic system, hammering unit, screen, pressure relief unit, cyclone and the support frame.
Electric motor
The system is driven by an electric motor of 10 hp which has a revolution of 2900 rpm.
Transmission System
It consists of shafts, pulleys and belts. The electric motor is the prime mover of the machine, as the pulley which is connected to the shaft of the electric motor is being propelled into action by the rotation of the electric motor; power is being transmitted from this pulley via a belt to another pulley which is connected to the shaft of the hammering unit.
Hammering Unit
The hammering unit consists of four sets of hammers; each set is positioned on a role and each role has six hammers thereby making a total of 24 hammers. Individual hammers are of 5.1 by 7.2 cm.
Screen
The screens used for this research work are of varying aperture sizes; 1.5 mm, 2 mm, 2.5 mm and 3 mm.
Pneumatic System
The pneumatic system has a blower which positioned above the screen in the hammering unit. This blower consists of blades which are of 1.5 by 7.8 cm in dimension. The blower sucks the milled products which drops from the screen and subsequently transport the milled product pneumatically via the duct down into the cyclone.
Pressure relief unit
The air pressure in the pneumatically conveyed material is separated with the aid of the pressure relief fabric. The air pressure is able to escape through the fabric material while the milled particle dust gradually settles in the cyclone.

Figure 1: Fish feed ingredients

Figure 2: A milling system with pneumatic conveyor and cyclone
Determination of Average Power Consumed
A digital volt meter was used to measure the voltage consumed by the milling and mixing system during the period of operation of the machines, the voltmeter has accuracy specification of +/- 0.5% rdg and maximum input of 1000 VDC, 750 VAC for direct and alternating current, respectively. The ammeter used during the performance evaluation is a 3 phase, 4 wire, 10(100) amps (whole current) electronic credit meter.

Figure 3: Measuring instrument (Ammeter & Digital volt meter)
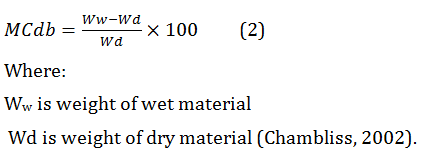
Moisture Content Determination
An oven was used to determine the ingredients moisture content.
Description of the oven
The drying chamber
This is the upper part of the mechanical dryer. It has a door, which is keyed to the top of the dryer, where the specimens are being loaded and off loaded. It allows contains four suspended sample baskets which are made of stainless steel. This is where the drying takes place. The base of the drying chamber is made up of perforated steel.
The heating chamber
This contains the heating element which is located at the lower part of the oven.
The centrifugal fan
This is attached to one side of the oven. It is operated by an electric motor. The fan sucks fresh air from the surrounding and blows it across the drying element which is located at the lower part of the dryer. The speed of the fan was regulated by electric voltage regulator.
The heating element
This serves as a source of heat for the dryer located at the lower part of the dryer. Heat is circulated into the drying chamber when the fan is blown across the heating element.
The exhaust
Also called the chimney, a square shaped hole on the top of upper part of the oven to allow moist air to leave, and regulate the airflow and temperature within the oven.
The drying layers
The drying layers are located inside the oven, they are made of stainless still, and they are suspended inside the oven to ensure uniform drying.
Control panel
This is where the dryer is switched on and off. The heating element of the oven is trigged on from the switch on the control panel to pre-heat the oven to a certain air temperature before the agricultural product is introduce into the oven on the sleeve.

Figure 4: Laboratory oven (search tech instrument DHG-9053A)
Methods
Determination of Machine Speed
The milling and mixing machine was evaluated at five different speeds, in order to achieve the required speeds, the revolution per minute of the electric motor on the milling and mixing system need to be reduced with the aid of pulleys. The pulley size required was determined with the equation below

Where:
N1is speed of the driving pulley in rpm (speed of the electric motor)
D1 is diameter of the driving pulley (mm),
N2 is speed of the driven pulley in rpm (speed of the hammering unit) (Pyarelal, et al., 2017)
The pulleys diameters were measured with a venire caliper and the speed (2900 rpm, 10 hp) of the electric motor was specified on the electric motor by the manufacturer.
Determination of the ingredients moisture content
The percentage moisture content of the ingredients was determined on dry basis.
Evaluation of the milling machine
Masses of 3kg of bone mill, ground nut cake and corn grain were measured using a mass balance and each of the samples measured was replicated three times. These measured samples in three replicates were milled respectively at five different speed (1500rpm,1800rpm,2100rpm, 2400rpm and 2700rpm) and four different screen size (1.5mm,2mm,2.5mm,3mm). The time taken to mill the ingredients was recorded using a stop watch while the average milling time and machine output for the three replicates of each ingredient at various speeds and its corresponding screen size was calculated. The electrical power consumed during each milling operation was recorded with an electric meter and the corresponding average voltage was measured with a digital volt meter.
Determination of Machine Power Consumption
- To measure power requirement an ammeter was connected between the electric motor of the grinding mill and the electrical supply.
- The current taken up by the machine when there is no input of grain i.e. the idle current before commencement of milling process was measured using an ammeter.
- The feed was emptied into the milling machine at a constant feed rate. Meter readings were taken at every 5seconds intervals until all the grains was milled. This was indicated by the meter reading when it goes back to the idle power.
- Voltage readings were taken using a voltmeter across the power supplies.
- Power was obtained by using
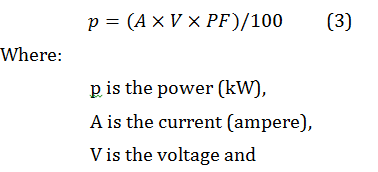
PF is the dimensionless power factor between -1 and1 generated respectively with grinding time read from the clamp meter.
The power factor of an electrical power system is defined as the ratio of the real power flowing to the load with the apparent power in the circuit (Norazatul et al., 2015).
Electrical energy consumption during milling
The electrical energy consumption during milling was calculated using Eq. (3)
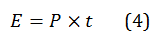
Where E is the energy (kWs with conversion of 1 kWh =3600 kJ) and t is grinding time.
The specific energy consumption during milling operation was calculated using Eq. (4)
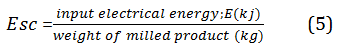
Where: Esc is the speciï¬Âc energy input (kJ/kg) (Norazatul et al., 2015).
Statistical Analysis
Milling performances parameters’ values (average power consumed and electrical energy used during milling) were subjected to statistical analysis to determine the mean, standard deviation, coefficient of variation, linear and nonlinear regressions. One-way ANOVA was used to test for significance among the treatments and post hoc comparison using Tukey test to separate significantly differing treatment means after main effects were found significant at p< 0.05. The significance tests of the milling performances parameters’ (average power consumed and electrical energy used during milling) of the main treatment effects (speed and screen size) and their interactions were performed using the Analysis of Variance (ANOVA) within the General Linear Model (GLM) procedure using Minitab 17 statistical software.
Results and Discussion
Pulley Diameter
In order to achieve the required speed for the evaluation of the milling machine, it is imperative to vary the pulley diameters on the driven shaft. Below are the calculated pulley diameters and the corresponding speeds.
| Pulley diameter (mm) | Speed (rpm) |
|---|---|
| 145 | 1500 |
| 120 | 1800 |
| 105 | 2100 |
| 90 | 2400 |
| 80 | 2700 |
Table1: Required pulley diameter and the corresponding speed on the milling machine
Ingredients moisture content
| Ingredients | Moisture content (db) |
|---|---|
| Bone mill (BM) | 13.1% |
| Groundnut cake (GNC) | 14.7% |
| Maize (M) | 17.5% |
Table 2: Ingredients moisture content

Table 3: Evaluation of the hammer mill at 1800 rpm
| Speed (rpm) | Mass of Feed 3kg (Mf) | Mass of Product (kg) (Mp) | Milling Time(minutes) | Power (KW) | Pulley Size (mm) | Screen Size (mm) | ||
|---|---|---|---|---|---|---|---|---|
| GNC | BM | Maize | ||||||
| 2100 | 3 | 2.8 | 1.16 | 0.1 | 105 | 2 | ||
| 2100 | 3 | 2.7 | 2.15 | 0.1 | 105 | 2 | ||
| 2100 | 3 | 2.9 | 2.1 | 0.07 | 105 | 2 | ||
| 2100 | 3 | 2.7 | 4.4 | 0.1 | 105 | 1.5 | ||
| 2100 | 3 | 2.85 | 7.49 | 0.2 | 105 | 1.5 | ||
| 2100 | 3 | 3 | 4.03 | 0.1 | 105 | 1.5 | ||
| 2100 | 3 | 2.6 | 11.1 | 0.3 | 105 | 3 | ||
| 2100 | 3 | 2.1 | 8 | 0.1 | 105 | 3 | ||
| 2100 | 3 | 3 | 3.55 | 0.1 | 105 | 3 | ||
| 2100 | 3 | 2.7 | 2.35 | 0.1 | 105 | 2.5 | ||
| 2100 | 3 | 2 | 4.1 | 0.1 | 105 | 2.5 | ||
| 2100 | 3 | 2.6 | 3.58 | 0.1 | 105 | 2.5 | ||
Table 4: Evaluation of the hammer mill at 2100 rpm
| Speed (rpm) | Mass of | Mass of Product | Milling Time (minutes) | Power (KW) | Pulley Size (mm) | Screen Size (mm) | ||
|---|---|---|---|---|---|---|---|---|
| Feed 3kg (Mf) | (kg) (Mp) | |||||||
| GNC | BM | Maize | ||||||
| 1500 | 3 | 1.6 | 18 | 0.3 | 145 | 2 | ||
| 1500 | 3 | 1 | 12 | 0.25 | 145 | 2 | ||
| 1500 | 3 | 1.8 | 14.1 | 0.26 | 145 | 2 | ||
| 1500 | 3 | 1.8 | 18.01 | 0.28 | 145 | 1.5 | ||
| 1500 | 3 | 1.5 | 17.13 | 0.3 | 145 | 1.5 | ||
| 1500 | 3 | 2 | 15.2 | 0.27 | 145 | 1.5 | ||
| 1500 | 3 | 2.9 | 9.5 | 0.2 | 145 | 2.5 | ||
| 1500 | 3 | 2.3 | 19 | 0.4 | 145 | 2.5 | ||
| 1500 | 3 | 2.1 | 18.31 | 0.3 | 145 | 3 | ||
| 1500 | 3 | 2.1 | 17.1 | 0.3 | 145 | 3 | ||
| 1500 | 3 | 2.6 | 10 | 0.1 | 145 | 3 | ||
| 1500 | 3 | 2.4 | 17.03 | 0.3 | 145 | 2.5 | ||
Table 5: Evaluation of the hammer mill at 1500 rpm.
| Speed (rpm) | Mass of Feed 3kg (Mf) | Mass of Product (kg) (Mp) | Milling Time (minutes) | Power (KW) | Pulley Size (mm) | Screen Size (mm) | ||
|---|---|---|---|---|---|---|---|---|
| GNC | BM | Maize | ||||||
| 2700 | 3 | 2.9 | 1.46 | 0.05 | 80 | 2.5 | ||
| 2700 | 3 | 2.95 | 2.45 | 0.1 | 80 | 2 | ||
| 2700 | 3 | 2.95 | 2.25 | 0.1 | 80 | 2 | ||
| 2700 | 3 | 2.75 | 3.18 | 0.1 | 80 | 2.5 | ||
| 2700 | 3 | 2.9 | 3.41 | 0.1 | 80 | 2 | ||
| 2700 | 3 | 2.85 | 6.02 | 0.1 | 80 | 1.5 | ||
| 2700 | 3 | 3 | 4.01 | 0.2 | 80 | 1.5 | ||
| 2700 | 3 | 2.9 | 5 | 0.1 | 80 | 1.5 | ||
| 2700 | 3 | 3 | 1.45 | 0.05 | 80 | 3 | ||
| 2700 | 3 | 3 | 2.07 | 0.06 | 80 | 3 | ||
| 2700 | 3 | 2.6 | 4.15 | 0.1 | 80 | 3 | ||
| 2700 | 3 | 2.87 | 2.03 | 0.1 | 80 | 2.5 | ||
Table 6: Evaluation of the hammer mill at 2700 rpm
| Speed (rpm) | Mass of Feed 3kg (Mf) | Mass of Product (kg) (lp) | Milling Time (minutes) | Power (KW) | Pulley Size (mm) | Screen Size (mm) | ||
|---|---|---|---|---|---|---|---|---|
| GNC | BM | Maize | ||||||
| 2400 | 3 | 3 | 3.02 | 0.1 | 90 | 2 | ||
| 2400 | 3 | 3 | 4.16 | 0.05 | 90 | 1.5 | ||
| 2400 | 3 | 2.6 | 9.01 | 0.1 | 90 | 1.5 | ||
| 2400 | 3 | 2.6 | 6.15 | 0.1 | 90 | 1.5 | ||
| 2400 | 3 | 3 | 3.3 | 0.1 | 90 | 3 | ||
| 2400 | 3 | 2.3 | 7 | 0.2 | 90 | 3 | ||
| 2400 | 3 | 3 | 3.14 | 0.1 | 90 | 3 | ||
| 2400 | 3 | 2.7 | 2.4 | 0.1 | 90 | 2.5 | ||
| 2400 | 3 | 2.7 | 3 | 0.1 | 90 | 2 | ||
| 2400 | 3 | 3 | 2 | 0.05 | 90 | 2 | ||
| 2400 | 3 | 3 | 1.56 | 0.1 | 90 | 2 | ||
| 2400 | 3 | 2.9 | 1.5 | 0.1 | 90 | 2.5 | ||
Table 7: Evaluation of the hammer mill at 2700 rpm
Power consumed during milling
The chart (fig. 5 and 6) shows that there is no significant effect of screen size on the average power consumed during milling, this can be seen in the chart as it shows no linear relationship between power consumed and screen size. From the data gathered during the research in the tables above, table (3-7) shows that screen size does not have a significant effect on the power consumed during milling. In table 3, 0.1kw of power was recorded at all the screen sizes during some of the milling operations, same thing was obtained in table 5, where 0.3kw power was also recorded to be consumed during some of the milling operations carried out with all the screen sizes. It also shown in table 5 that the highest power (0.4kw) consumed occurred at 2.5mm screen. However, there is a significant effect of speed on average power consumed as it is shown in fig. 6, the power consumed increases as speed decreases therefore making milling operation at higher speed to be cost effective since it doesn’t require much power to achieve the required output. It was observed during the process of the research that lower milling speeds takes more time to mill the same quantity of product when compared with higher speeds, this observation shows that power consumption during milling is a factor of speed and the retention time (duration of milling).

Figure5: Effect of screen size on power consumed during milling


Figure6: Effect of speed on power consumed during milling
Effect of speed and screen size on electrical energy consumption
The effect of screen size and rotor (milling) speed was evaluated on the performance of a milling system, the tables below (table 8) shows the factors considered and table 9 shows the level of significance of the factors. The P-Value depicts that screen size has no significant effect on the electrical energy consumed during the milling operation while speed has significant effect on the electrical energy used at 95% confidence level.
For more precise verification of the level of significance and the interaction differences between the various factors, the factors were subjected to Turkey and Bonferroni simultaneous test at 95% confidence level. Fig 8 shows the difference of means for electrical energy, there is a slight difference in the electrical energy consumed between (2400-1800 rpm) and (2400-1500 rpm) while there is significant difference between (2700-1500 rpm) and (2700-1800 rpm). Nonetheless, there is no significant difference when the effect of screen size was compared in fig. 9.
| Factor | Type | Levels | Values |
|---|---|---|---|
| Speed (rpm) | Fixed | 5 | 1500, 1800, 2100, 2400, 2700 |
| Screen Size (mm) | Fixed | 4 | 1.5, 2.0, 2.5, 3.0 |
Table 8: Factor Information (electrical energy)
| Source | DF | Adj SS | Adj MS | F-Value | P-Value |
|---|---|---|---|---|---|
| Speed (rpm) | 4 | 42549 | 10637 | 4.19 | 0.006 |
| Screen Size (mm) | 3 | 5416 | 1805 | 0.71 | 0.551 |
| Speed (rpm)*Screen Size (mm) | 12 | 56264 | 4689 | 1.85 | 0.073 |
| Error | 40 | 101573 | 2539 | ||
| Total | 59 | 205803 |
Table 9: Analysis of Variance (electrical energy)

Figure 7: Differences of means for electrical energy (milling speed (rpm))

Figure 8: Differences of means for electrical energy (milling screen size (mm))
The electrical energy main effect plot in fig. 7 shows there is no significant difference in the electrical energy consumed between 1500 rpm and 1800 rpm and there is a subsequent decrease in the electrical energy used as the speed increase further. Fig. 9 and 10 shows that screen size does not have a significant effect on the energy used.

Figure 9: Electrical energy versus speed and screen size

Figure 10: Effect of speed on Electrical energy consumption (milling)
In fig. 9 above, it is shown that the electrical energy consumed reduces as speed increases, at lower speed more electrical energy is consumed because the ingredient spend longer time in the milling chamber before adequate milling is achieved.
Statistical model
Regression Analysis: Electrical Energy (milling) (kJ)
| Model No | Model Equation | R2 |
|---|---|---|
| I | 16.9 - 0.0078Sp + 4.9Ss+ 5.61Mt | 0.296 |
| II | -510 + 0.467Sp + 5.5Ss+ 8.44Mt - 0.000107Sp² | 0.344 |
| III | -96 - 0.0033Sp + 100Ss+ 6.09Mt - 21.1Ss² | 0.304 |
| IV | -79.2 + 0.0045Sp + 8.8Ss+ 25.65Mt - 1.015Mt² | 0.460 |
| V | 546 + 0.18Sp + 248Ss+ 24.9Mt - 0.00006Sp²- 80.7Ss 1.22Mt²+ 0.05Sp*Ss + 0.0018Sp*Mt + 2.44Ss*Mt | 0.569 |
| VI | -590 + 0.20Sp + 278Ss+ 42.2Mt - 0.00005Sp²- 77.3Ss²- 1.19Mt²+ 0.03Sp*Ss - 0.009Sp*Mt - 5.7Ss*Mt + 0.005Sp*Ss*Mt | 0.573 |
Table 4.26: Regression Analysis: Electrical Energy (milling) (kJ)
Evaluation of the statistical models
Energy used during milling (kJ)
The model that best described data characteristic is the one that gives the highest R2, the lowest χ2 and RMSE values. Based on these criteria, Model 6 is the best fit for the data with R2, χ2 and RMSE values of 0.57, 1504.03 and 38.45 respectively.
| Models | R² | MSE | RMSE | X² |
|---|---|---|---|---|
| 1 | 0.296 | 2413.650 | 49.129 | 2454.560 |
| 2 | 0.344 | 2249.820 | 47.432 | 2287.950 |
| 3 | 0.304 | 2388.450 | 48.872 | 2428.930 |
| 4 | 0.460 | 1852.440 | 43.040 | 1883.840 |
| 5 | 0.569 | 1480.910 | 38.483 | 1506.010 |
| 6 | 0.573 | 1478.960 | 38.457 | 1504.030 |
Conclusion and Recommendations
There is no significant effect of screen size on the average power consumed during milling since there is no linear relationship between power consumed and screen size. However, there is a significant effect of speed on average power consumed, the power consumed increases as speed decreases thereby making milling operation at higher speed to be cost effective since it doesn’t require much power to achieve the required output. It was observed during the process of the research that lower milling (rotor) speeds takes more time to mill the same quantity of product when compared with higher speeds. This observation shows that power consumption during milling is a factor of speed and the retention time. The P-Value depicts that screen size has no significant effect on the electrical energy consumed during the milling operation while speed has significant effect on the electrical energy used at 95% confidence level.
REFERENCES
- Adeomaya, S.O. and Samuel, O.D. (2014). Design and development of a petrol-powered hammer mill for rural Nigerian farmers. Journal of energy technologies and policy.Vol. 4: 65-74
- Chambliss, C.G. (2002). Forage moisture content testing. AG-181. University of Florida cooperative extension service, University of Florida, Gainesville.
- Donnel, H. (1983). Farm Power and Machinery. McGraw Hill, New Delhi, India. Anon. 1980. Encyclopedia Britanica, Vol. 21: 1157-1172. William Benton, Chicago, IL, USA.
- Payarelal S.P, swapnil, C.W., Gaurav R.D, Akash G.C., Vogita D.K and Shradha H.B et al (2017). Deshelling of â??SemecarpusAnacardiumâ? (Bibba Seed): A review study. International Journal of Advance research and innovative ideas in education. Vol. 3.
- Norazatul, H.M., Nyuk, L.C., and Yusof, Y.A. (2015). Grinding characteristics of Asian originated peanuts (Arachis hypogaea L.) and specific energy consumption during ultra-high-speed grinding for natural peanut butter production. Journal of food engineering, 152: 1-7
- Ovie, S.O. and Eze, S.S. (2013). Lysine requirement and its effect on the body composition of Oreochromis Niloticus fingerlings. Journal of Fisheries and Aquatic Science, 8: 94-100
- Udo, I. U. and Umoren, U.E. (2011). Nutritional evaluation of some locally available ingredients uses for least-cost ration formulation for African Catfish (Claris Gariepinus) in Nigeria. Asian J. Agric. Res., 5: 164-175.

Open Access Journals
- Aquaculture & Veterinary Science
- Chemistry & Chemical Sciences
- Clinical Sciences
- Engineering
- General Science
- Genetics & Molecular Biology
- Health Care & Nursing
- Immunology & Microbiology
- Materials Science
- Mathematics & Physics
- Medical Sciences
- Neurology & Psychiatry
- Oncology & Cancer Science
- Pharmaceutical Sciences