ISSN : 2249 - 7412
Asian Journal of Plant Science & Research
Variability, Heritability and Genotypic advance of sorghum (Sorghum bicolor L. Moench) landraces
Gedifew Gebrie*
Department of Agricultural, Ethiopian Institute of Agricultural Research, Pawe, Ethiopia.
- *Corresponding Author:
- Gedifew Gebrie Department of Agriculture, Ethiopian Institute of Agricultural Research, Pawe, Ethiopia, Tel: 251983565966; E-mail:gebriegedifew1976@gmail.com
Received date: July 06, 2022, Manuscript No. AJPSKY-22-13991; Editor assigned date: July 11, 2022, PreQC No. AJPSKY-22-13991 (PQ); Reviewed date: July 26, 2022, QC No. AJPSKY-22-13991; Revised date: September 07, 2022, Manuscript No. AJPSKY-22-13991 (R); Published date: September 17, 2022, DOI: 10.36648/2249-7412.22.12.9.310
Citation: Gebrie G (2022) Variability, Heritability and Genotypic advance of Sorghum (Sorghum bicolor L. Moench) Landraces. Asian J Plant Sci Res Vol.12 No.9:310.
Abstract
Few studies have been undertaken on the existing Sorghum diversity in Metekel zone agricultural areas of Ethiopia. Hence, the objective of this study was to determine the extent and degree of genotypic and phenotypic variability in yield and yield related quantitative traits of Sorghum landrace collections of the area. 25 Sorghum landraces and one regionally released Sorghum variety called ‘Emohay’ as a check were tested in Randomized Complete Design (RCBD) with three replications during 20011/2012 rainfed cropping season for a year at Pawe district. A plot size of 7.5 m2 with two rows and 5 m length with spacing of 0.75 m between rows, 0.15 m between plants and 1.5 m between blocks was used. The analysis of variance revealed the existence of a significant variability among the landraces for most quantitative traits. 11 Sorghum landraces with a better grain yield performance ranging between 41.38 to 48.9 q/ha were obtained indicating the possibility of identifying superior genotypes to be selected among the landraces. A Sorghum landrace with an accession number of 021 pw-2010 was identified as the highest grain yielder (48.9 q/ha). The lowest ratio of GCV to PCV was obtained for days to 95% maturity while the highest PCV to GCV ratio was obtained for plant height. Generally, a lower ratio of genotypic variance to phenotypic variance were recorded for days to flowering, days to maturity, leaf length, leaf width, single leaf area, number of leaves per a plant, plant height, head length, head width, head weight and grain yield indicating that the traits will be highly influenced by the environment.
Keywords
Genetic advance; Heritability; Sorghum landraces; Traits; Variability
Introduction
In Ethiopia, Sorghum is an important food crop (as a forage for animals and injera (flat pancake like traditional bread) and a local drink as ‘tela’ and ‘areke’) and is widely grown in the high land, low land and semi arid areas of the country including Metekel zone where the areas of land race collections are located which are the area of Sorghum domestication with a high genetic diversity of cultivated Sorghum and its wild forms. As one of the leading traditional food cereals in Ethiopia, in terms of both total production and area, major research efforts have been directed towards the improvement and stabilization of Sorghum yields [1].
Nationally, Sorghum improvement involves the manipulation of indigenous and introduced germplasm to develop adapted varieties for various ecological zones [2]. It has been noted that systematic characterizations and evaluation of plant genetic resources are basics for the efficient use of material through conventional methods bringing genetic improvement of the crops for quantitative traits which requires reliable estimates of genetic variability and advancement in respect to the breeding material that is presently at hand in order to plan an efficient breeding program. However, the diversity of Sorghum is high in Ethiopia, the extent and distribution of the genetic variability of the crop in different areas with different agroecology has not been properly studied yet including the study area. Thus, this study was aimed at determining the extent and degree of variability in morpho agronomic quantitative characters of different Sorghum landrace collections.
Materials and Methods
Description of the experimental site
The experiment was conducted at Pawe district of north western Ethiopia, from mid-2011 to early 2012 main cropping rainfed season using a collection of Sorghum landraces collected from five districts of Metekel zone in Benishangul-gumuze regional state which is located at about 580 km north west of Addis Ababa and 230 km from Bahir Dar at 36o25`E longitude, 11o12’N latitude and at an altitude of 1150 meters above sea level. The area is characterized by hot humid conditions with mean maximum and minimum temperatures of 32oC and 16oC respectively with the annual rainfall ranging from 1500-1800 mm with five and half months rainy season [3]. The total rainfall during the growing this research season was about 1659 mm. The soil type is haplicacrisols, very deep (>150 cm) and clay in texture with a soil pH ranging from 5.5 to 6.9 where the subsurface soils have higher pH values than surface soils [4]. The organic carbon (0.2 to 2.8%) and total nitrogen (0.02 to 0.19%) contents of the soil decrease with soil depth.
Experimental materials
Twenty five landraces and one standard check in Table 1 were tested though a landrace with an accession number 032 pw-2010 did not emerge in all plots [5]. The landraces were received from Pawe agricultural research center and the local check is a released variety recommended for high and intermediate altitude zones in the country.
| Accession No | Local name | Collection area | Altitude | Seed colour | Accession No | Local name | Collection area | Altitude | Seed colour |
|---|---|---|---|---|---|---|---|---|---|
| 033pw-2010 | Bobea | V.49 | 894 | Red | 021pw-2010 | Jarsisa | Iccid | 890 | White |
| 037pw-2010 | Bobea | V.1 | 1044 | Brown | 050pw-2010 | Bobea | Dibate | - | White |
| 035pw-2010 | Bobea | V.1 | 1044 | White | 056pw-2010 | Bobea | Dibate | - | White |
| 043pw-2010 | Bobea | G/beless | 980 | Brown | 005pw-2010 | Bobea | V.23 | - | Red |
| 044pw-2010 | Bobea | V.1 | 1044 | White | 049pw-2010 | Bobea | Baruda | - | Red |
| 045pw-2010 | Bobea | V.1 | 1044 | Red | 055pw-2010 | Bobea | Zeghe | - | White |
| 026pw-2010 | Auto | Icide | 915 | Brown | 031pw-2010 | Bobea | V.1 | 1044 | White |
| 030pw-2010 | Auto | Icide | 915 | Brown | 032pw-2010 | Bobea | V.49 | 894 | White |
| 047pw-2010 | Bobea | Baruda | - | red | 027pw-2010 | Auto | Iccid | 915 | Red |
| 001pw-2010 | Mehareb | Almehal | 680 | White | 041pw-2010 | Bobea | V.1 | 1044 | White |
| 003pw-2010 | Tirequash | Almehal | 685 | White | 042pw-2010 | Bobea | V.1 | 1044 | Red |
| 012pw-2010 | Gergesa | Banguze | 808 | White | 023pw-2010 | - | Dechagree | 862 | Brown |
| 020pw-2010 | Drisisa | Icica | 890 | White | Emohay | - | - | - | Brown |
Table 1: List of the sorghum landraces and the standard check.
Experimental design and procedures
The Randomized Complete Block Design (RCBD) with 3 replications was used. Each treatment was planted in a plot area of 7.5 m2 (2 rows, each 5 m long, with a spacing of 0.75 m between rows, 0.15 m between treatments and 1.5 m between blocks). During planting the seeds were drilled in rows [6]. Inorganic fertilizers such as DAP (100 kgh-1) and Urea (50 kgha-1) were applied at planting and vegetative stages of the crop, respectively.
Measurements and observations were recorded following the IBPGR and ICRISAT descriptor list. The quantitative traits such as numbers of leaves per plant, leaf length (cm) leaf width (cm), single leaf area (cm2), plant height (cm), head length (cm), head width (cm) and head weight (g) were collected and measured by taking the mean value of five sampled plants, which were tagged randomly before the time of data collection [7]. Days to emergence, days to flowering, days to maturity were also collected and measured on plot bases.
Statistical analysis
Analysis of Variance (ANOVA) was performed in Table 2 for each measured quantitative trait in RCBD ANOVA in order to compare the relative importance of main model terms: Replication (r), Genotype (g) and Error (e) on 11 quantitative traits to explore the level of variation among twenty-five collection of Sorghum landraces using SAS statistical computer software with version 9.2 [8].
| Source of variation | df | Mean square | Expected mean |
|---|---|---|---|
| Replications | (r-1) | MSr | δ2e-gδ2r |
| Genotypes | (g-1) | MSg | δ2e-rδ2g |
| Error | (r-1) (g-1) | MSe | δ2e |
| Total | rg-1 |
Where: DF: Degrees of Freedom, r: Number of replications, g: Number of genotypes, MSr: Mean Square of replications, MSg: Mean Square of renotypes, MSe: Mean Square of Error.
Table 2: Analysis of variance for 11 traits for the 25 sorghum landraces.
The RCBD ANOVA was computed using the mathematical model:
Yij=μ+rj+gi+eij
Where
Yij=the observation of the ith treatment in the jth replication,
rj=the effect of the jth replication and
gi=the effect of the ith treatment,
eij=experimental error effect [9].
The genetic parameters (Phenotypic and genotypic variances) were estimated from the expected mean squares using the random model where the expected mean squares considered according to Falconer as:
(δ2g)=MSg-MSe/r
Where, δ2g is genotypic variance,
MSg is genotypic mean square,
MSe=Error Mean Squares,
r is the number of replications [10].
(δ2p)=δ2g+δ2e=MSg/r
Where
δ2g is phenotypic variance;
δ2e is environmental variance
where
δ2e=MSe/r
The presence of variability was also estimated using phenotypic variance, genotypic variance, Phenotypic Coefficient of Variation (PCV) and Genotypic Coefficient of Variation (GCV). The PCV and GCV were calculated according to the Burton method as:
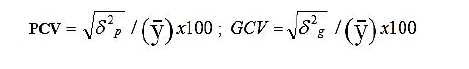
Where Y is mean value of trait Y.
Estimation of broad sense Heritability (H)
Although the genotypic coefficient of variation revealed the extent of genetic variability present in the landraces for various traits, it does not provide full scope to assess the heritable variation among the quantitative traits of the treatments which is useful for permanent genetic improvement due to its predictive role to indicate heritability of the phenotypic value as a guide to breeding value [11]. Heritability in broad sense (H) for all the traits was computed using the formula given by Falconer which is expressed as a percentage of the ratio of the genotypic variance (δ2g) to the phenotypic variance (δ2p) and was estimated on genotype mean base as described by Allard [12].
Heritability (H)=δ2g/δ2p × 100
Where
H is heritability in broad sense,
(δ2g) is genotypic variance, and
(δ2p) is phenotypic variance.
Estimation of genotypic advance
Genotypic Advance in absolute unit (GA) and as percent of the Mean (GAM), assumed selection of superior 5% of the genotypes was estimated in accordance with the methods illustrated by Johnson, et al. as:
GA=K δ2p H
Where
K is the standardized selection differential of 5% selection intensity [13].
(K=2.063), δ2p is phenotypic standard deviation on mean basis; H is heritability in broad sense. Genetic advance as percent of the mean was calculated to compare the extent of predicted advance of different traits under selection, using the formula:
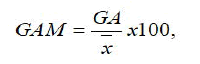
Where
xÌ? is mean of the population where selection employed.
Results and Discussion
Variability of the measured quantitative traits
Morphological variation with the tested quantitative characters was recorded among 25 landraces of Sorghum bicolour collected from different areas of Metekel zone, Ethiopia [14]. The ANOVA results of 11 quantitative traits of the Sorghum land race collections indicated that there was a significant difference among the tested landraces (P ≤ 0.05) for their days to 50% flowering, days to 85% maturity, number of leaves per a plant, plant height, head weight and grain yield. A high significant difference was also observed (p<0.01) for their traits of leaf length, single leaf area and head length. But the land races were not significantly varied for the traits of head width and leaf width [15]. The observed significant variations indicated the presence of genetic variability among the Sorghum landraces for those traits with a significant mean square value (Table 3) [16].
| Source of variation | Mean Squares | |||||||||||
|---|---|---|---|---|---|---|---|---|---|---|---|---|
| df | DTF | DTM | LFW | LFL | SLA | NOL | PH | HL | HW | HWt | GRY | |
| Replication | 2 | 0.04 | 287.5 | 0.14 | 59.69 | 2583.82 | 3.09 | 1435.88 | 9.75 | 4.85 | 3.18 | 1272149 |
| Genotype | 24 | 399.94* | 273.61* | 1.79 | 202.99* | 25411.48** | 12.62* | 9751.24* | 60.28** | 3.29 | 313.88* | 671061.10* |
| Error | 48 | 1.94 | 17.92 | 0.52 | 12.44 | 4941.29 | 0.74 | 418.65 | 4.38 | 1.34 | 172.35 | 325204.4 |
| R2 | 0.95 | 0.89 | 0.63 | 0.89 | 0.72 | 0.89 | 0.92 | 0.87 | 0.57 | 0.47 | 0.54 | |
| C.V | 2.65 | 2.68 | 10.22 | 3.54 | 10.01 | 6.19 | 5.79 | 7.13 | 14.42 | 15.97 | 19.08 | |
*: Significant at 0.05 level of significance, **: Significant at 0.01 level of significance, R2: Efficiency of the model, CV: Coefficient of Variation, DTF: Days To 50% Flowering, DTM: Days To 85% Maturity, LFW: Leaf Width, LFL: Leaf Length, SLA: Single Leaf Area, NOL: Number of Leaves per plant, PH: Plant Height, HL: Head Length, HW: Head Width, HWt: Head Weight, GRY: Grain Yield in gram per plot, DF: Degrees of Freedom
Table 3: Table of Analysis of Variance (ANOVA) for 11 quantitative traits measured from 26 sorghum land race collections.
A higher variation for a trait in the breeding materials correlates with a greater ability for its improvement through selection and a Coefficient of Variation (CV) is important for comparing the variability in experiments with variables measured in different units. A large coefficient of variation (usually a CV>30%) is often associated with increased experimental variability [17]. Therefore, a grain yield with the highest Coefficient of Variation (CV=19.08) has a greatest ability to be improved through selection and days to 50% flowering with a lowest value of Coefficient of Variation (CV=2.65) correlated with the least ability for its improvement among the measured quantitative traits. A non-significant mean square value observed for leaf width and head width showed that the Sorghum land race collections are genetically almost similar concerning these two characters indicating that selecting for these characters will not show any impact on the genetic improvement of the landraces [18]. Previous studies indicated a significant variation for many of the traits like head length and head width, days to 95% maturity. Negash also reported that days to 95% maturity, leaf width, leaf length, leaf area, plant height and grain yield have a significant difference between Sorghum landraces collection from Western region of Ethiopia.
Variability estimates of the Sorghum landraces based on 11 quantitative traits
A wide range of values in the collected quantitative traits was observed in Table 4. The Sorghum landraces showed a range of variability in their days to 50% flowering (41-128 days), days to 95% maturity (130-170 days), leaf length (71.8-112.8 cm), number of leaves (458-895), leaf width (8-17 cm) and in single leaf area (7.07-9.6 cm2) with a broad range of variability in their grain yield per plot (4538 gram to 2174 gram) or 60 quintal per hectare to 28.9 quintal per hectare). Mean grain yield of the landraces was 2988.63 g/plot that is 39.84 q/ha.
| Traits | N | R | Min. | Max. | Mean | MSg | MSE | GV | PV | GCV | PCV | H | GA | GAM |
|---|---|---|---|---|---|---|---|---|---|---|---|---|---|---|
| DTF | 75 | 41 | 87 | 128 | 113.64 | 399.94 | 1.94 | 130.27 | 133.31 | 10.1 | 10.2 | 97.8 | 5.78 | 5.1 |
| DTM | 75 | 40 | 130 | 170 | 157.83 | 273.61 | 17.92 | 85.23 | 91.2 | 5.9 | 6.1 | 93.5 | 2.06 | 12.7 |
| LFW | 75 | 4.8 | 4.8 | 9.6 | 7.07 | 1.79 | 0.52 | 0.42 | 0.6 | 9.2 | 11 | 70 | 1.39 | 19.7 |
| LFL | 75 | 41 | 71.8 | 112.8 | 99.61 | 202.99 | 12.44 | 63.52 | 67.66 | 8 | 8.3 | 93.9 | 16.83 | 16.9 |
| SLA | 75 | 437 | 458 | 895 | 702.31 | 25411.48 | 4941.29 | 8453.86 | 8470.3 | 13 | 13.1 | 99.8 | 220.96 | 31.5 |
| NOL | 75 | 9 | 8 | 17 | 13.88 | 12.62 | 0.74 | 3.96 | 4.24 | 14.4 | 14.8 | 94.3 | 4.2 | 30.3 |
| PH | 75 | 220 | 203 | 423 | 353.19 | 9751.24 | 418.65 | 3110.86 | 3250.4 | 15.8 | 16.2 | 95.7 | 116.35 | 33 |
| HL | 75 | 24.2 | 19 | 43.2 | 29.33 | 60.28 | 4.38 | 18.63 | 20.09 | 14.8 | 15.3 | 92.8 | 9.64 | 32.9 |
| HW | 75 | 7 | 5 | 12 | 8.04 | 3.29 | 1.34 | 0.65 | 1.09 | 10.1 | 13 | 59.7 | 1.77 | 22.1 |
| HWt | 75 | 73.8 | 47 | 120.8 | 82.19 | 313.88 | 172.35 | 47.18 | 104.63 | 8.4 | 12.5 | 45.1 | 13.6 | 16.6 |
| GRY | 75 | 2364 | 2174 | 4538 | 2988.6 | 671061.1 | 325204.4 | 115285.6 | 223687 | 11.4 | 15.9 | 51.6 | 724.31 | 24.33 |
DTF: Days to 50% Flowering; DTM: Days to 95% Maturity; LFW: Leaf Width (cm), LFL: Leaf Length (cm), SLA: Single Leaf Area (cm2), NOL: Number of Leaves per plant, PH: Plant Height (cm), HL: Head Length (cm), HW: Head Width (cm), HWt: Head Weight (g), GRY: Grain Yield (g), N: Number of Observations, R: Range, Min: Minimum Value, Max: Maximum Value, MSg: Mean Square of Genotype, MSE: Mean Square of Error, SD: Standard Deviation, GV: Genotypic Variance, PV: Phenotypic Variance, GCV: Genotypic Coefficient of Variation, PCV: Phenotypic Coefficient of Variation, H: Heritability, GA-Genetic Advance, GAM: Genetic Advance as Percent of the Mean
Table 4: Genetic parameters for eleven quantitative traits in sorghum genotypes.
The landrace with an accession number of 021 PW-2010 was the highest yielder landrace (48.9 q/ha) which is almost less by 11 quintals when compared to the local check variety called ‘Emohay’ having a grain yield potential of 60 quintal per hectare [19]. 11 landraces gave a grain yield ranging between 40.20–40.00 quintal per hectare showing an indication for the possibility of developing high grain yielding Sorghum varieties from the available Sorghumlandrace collections for Pawe and other agroecologically similar areas of north-western Ethiopia.
Formerly, a mature Sorghum leaves with a width of 6.5 to 13.46 cm at the widest point and the number of leaves on the main stem which vary approximately from 7 to 21 was reported. In a related study, a leaf length ranged from 45.22 to 126.37 cm was also reported. The variability in plant height among the landraces was high and ranged between 423 to 203 cm. Variability in plant height of Ethiopian Sorghum ranged from 72 to 61.5 cm has been reported by Berhane and Yilma. Variation in head length ranged from 43.20 to 19.00 cm, a head weight ranged from 120.80 to 47.00 gm and head width ranged from 12 to 5 cm were also observed in this study. Almost similar result with study was obtained by Wasihun.
So as to strengthen the presence of the evaluated Sorghum landraces based on their quantitative traits, different variability statistical parameters such as Phenotypic Coefficient of Variation (PCV), Genotypic Coefficient of Variation (GCV) of each trait were calculated to determine the patterns of genetic variation among the characterized Sorghum landraces. Generally, the GCV were lower in magnitude than the PCV. Similar results were obtained by Bello, et al. while studying the genetic variability of the cultivated Sorghums. Abdi, et al. and Addisu also reported a variability result on the quantitative characteristics of different Sorghum germplasms [20]. So as to strengthen the presence of the evaluated Sorghum landraces based on their quantitative traits, different variability statistical parameters such as Phenotypic Coefficient of Variation (PCV), Genotypic Coefficient of Variation (GCV) of each trait were calculated to determine the patterns of genetic variation among the characterizedSorghumlandraces (Table 4). Generally, the GCV were lower in magnitude than the PCV. Similar results were obtained by Bello, et al. while studying the genetic variability of the cultivated Sorghums. Abdi, et al. and Addisu also reported a variability result on the quantitative characteristics of different Sorghum germplasms.
The phenotypic and genotypic variation among the Sorghum landraces
Across the eleven characters, the Genotypic and Phenotypic Coefficient of Variation (GCV and PCV) ranged from 5.9% to 6.1% for days to 95% maturity and 15.8% to 16.2% for plant height, respectively. Negash and Wasihun obtained the lowest PCV and GCV for days to 95% maturity. Addisu also reported the lowest genotypic and phenotypic coefficients of variation for 95% days to maturity (8.22% and 8.75% respectively) but in contrast, he recorded the highest GCV and PCV for days to 50% flowering [21]. Godbharle, et al. reported high genotypic and phenotypic coefficient of variation for plant height, head width and head length, and low GCV and PCV for days to flowering (5.86% and 6.85% respectively). If the PCV was higher than the GCV for the traits, the traits will be highly influenced by environment and the reverse is true. The high ratios of the phenotypic variance to genotypic variance for days to flowering, days to maturity, leaf length, leaf width, single leaf area, number of leaves per plant, plant height, head length, head width, head weight and grain yield indicated that the traits will be highly influenced by environment.
The broad sense heritability estimates of the quantitative traits
High heritability estimates for single leaf area (99.62%), days to 50% flowering (97.8%), plant height (95.7%), number of leaves per plant (94.3%), leaf length (93.9%), and days to 95% maturity (93.5%) and leaf width (70%) were obtained, indicating a high response of these traits to the phenotypic selection of the Sorghumlandraces. Similarly, a high heritability for head length (96%), days to 50% flowering (95%), and days to 95% maturity (99%) was reported by Bello, et al., Mahajan, et al. also reported a high heritability estimate for plant height (92.12%), head width (92.97%) and days to 50% maturity (89.57%). With the same fashion, Deepalakshmi and Ganesamurthy reported a high heritability in days to 50% flowering (94.6%), 95% days to maturity (90.80%). Negash also reported a high heritability for days to 50% flowering (77%), plant height (78.50%) and head length (84.80%). Wasihun also reported high heritability for days to 50% flowering (97%), days to 95% maturity (99%), leaf length (75%), single leaf area (75%), and plant height (94%) [22].
According to Singh, if heritability of a trait is very high, say 80% or more, selection for that trait is easy, but the masking effect of the environment is high on traits with low heritability (less than 40%) [23]. Therefore, selection for single leaf area (99.62%), days to 50% flowering (97.8%), plant height (95.7%), number of leaves per plant (94.3%), leaf length (93.9%) and 95% days to maturity (93.5%) will be easy for plant breeders. A low heritability estimates for head width (59.7%), head weight (45.1%) and grain yield (51.6%) was recorded in the present study indicating that the masking effect of the environment is high on these traits and selection for the traits will not be easy for the Sorghum breeder. Far with the result of the present study, Deepalakshmi and Ganesamurthy and Wasihun reported a high heritability for head weight (96.90%) and grain yield (94%) respectively. A lowest heritability in head weight (45.10%) and a highest heritability in single leaf area (99.62%) were observed. Bellow, et al. reported a lowest heritability in grain yield (10%) but Deepalakshmi and Ganesamurthy reported the highest heritability in grain yield (98.7%). In general, from the observed high heritability estimates for most quantitative traits of the studied Sorghum landraces, it is possible to recommend that selection for those quantitative traits would be effective [24].
Estimates of the Genotypic Advance (GA) of the Sorghum landrace collections
The genotypic coefficient of variation along with heritability estimate provides reliable estimates of the amount of genetic advance expected through phenotypic selection. In this study estimate of Genetic Advance (GA) ranged from 1.39 cm for leaf width to 724.31 gram per plot or 9.65 quintal per hectare for grain yield [25]. That is the resultant population obtained after crossing the best 5% of the Sorghum landraces will produce a new population whose leaf width is increased by 1.39 cm and whose yield is better than the older population by 9.65 quintal per hectare. Low predicted response to selection was observed for leaf length (16.83 cm), head weight (13.6 cm), head length (9.64 cm), days to 50% flowering (5.78 days), number of leaves per plant (4.20) and days to 95% maturity (2.06), head width (1.77 cm) and for leaf width (1.39 cm). A higher value of genotypic advance was observed for single leaf area (220.96 cm2), plant height (116.35 cm) and grain yield (724.31 g/plot or 9.65 q/ha). Wasihun reported high values of Genetic Advance (GA) for grain yield (880.33 g/plot) and single leaf area (152.25 cm2). Negash also reported high values of genetic advance for plant height (82.2 cm) and single leaf area (91.3 cm2) with a genetic advance less than 10 for number of leaves per plant, head length, head width and head weight. Godbharle, et al. reported a high value of genetic advance in kharif Sorghum [26]. Deepalakshmi and Ganesamurthy also reported high values of genetic advance for plant height (31.45 cm) and head length (29.12 cm).
Negash also reported high values of genetic advance for plant height (82.2 cm) and single leaf area (91.3 cm2) with a genetic advance less than 10 for number of leaves per plant, head length, head width and head weight. Godbharle, et al. reported a high value of genetic advance in kharif Sorghum. Deepalakshmi and Ganesamurthy also reported high values of genetic advance for plant height (31.45 c m) and head length (29.12 cm).
The estimate of Genetic Advance as percent of the Mean (GAM) as percent of the mean helps in understanding the type of gene action involved in expressing various polygenic characters when considered jointly with heritability. High value of GAM is an indicative of additive gene action whereas low values are indicative of non-additive gene action. Thus, days to 50% flowering estimated high heritability (97.8%) and low genetic advance as percent of the mean (5.78%) indicating that this character is affected by environment and is controlled by non-additive gene action and it will have poor response for selection. Days to 95% maturity (H=93.5%; GAM=12.7%), leaf width (H=70%; GAM=19.7%), leaf length (H=93.9%; GAM =16.9%), head length (H=92.8; GAM=32.9%), head width (H=45.1%; GAM=16.6%), and grain yield (H=51.6%; GAM=24.33%), which expressed high heritability with moderate GAM, appeared less affected by environmental fluctuations and governed by both additive and non-additive gene action, suggesting the possibility of improving these traits through simple selection which has been also confirmed by Deepalakshmi and Ganesamurthy and Godbharle, et al.
Conclusion
The observed significant mean square value from the statistical analysis of variance for the quantitative traits suggests that there is variability between the Sorghum landraces. The obtained range of variability for days to 50% flowering, days to 95% maturity, grain yield, plant height, head length, head weight, head width, and in their leaf width and leaf length confirms the presence of variability among the Sorghum landraces directing the possibility of improving the landraces. The recorded high ratios of the Phenotypic Variance (PV) to Genotypic Variance (GV) for days to 95% maturity, leaf length, leaf width, single leaf area, number of leaves per plant, plant height, head length, head width, head weight and grain yield indicates that these traits will be highly influenced by the environment.
A high heritability (more than 80%) of single leaf area (99.62%), days to 50% flowering (97.8%), plant height (95.7%), number of leaves per plant (94.3%), leaf length (93.9%) and 95% days to maturity (93.5%) confirms that selection based on these traits will be easy for plant breeders. A lower heritability for head width (59.7%), head weight (45.1%) and grain yield (51.6%) indicate that the masking effect of the environment is relatively high on these traits and selection of the Sorghum landraces based on these traits will not be easy.
An estimate of a high heritability (97.8%) and a low genetic advance as percent of the mean (5.78%) for days to 50% flowering indicates that the observed variability on the trait is affected by environment and is co ntrolled by non-additive gene action saying that it will have a poor response for selection. Days to 95% maturity (H=93.5%; GAM=12.7%), leaf width (H=70%; GAM=19.7%), leaf length (H=93.9%; GAM=16.9%), head length (H=92.8; GAM=32.9%), head width (H=45.1%; GAM=16.6%), and grain yield (H=51.6%; GAM=24.33%), which expressed high heritability with moderate GAM, seem less affected by environment and administered by both additive and non-additive gene action, suggesting the possibility of improving these traits through simple selection of the landrace collections.
Conservation and utilization of available Sorghum landraces in the collection areas must be given a great attention and the high performing accessions of Sorghum landraces screened in this study should further be evaluated under a wide range of environments to find widely adapting landraces.
Acknowledgement
Pawe agricultural research centre should be acknowledged for its seed source and providing a research site to conduct the experiment. I wish to thank my gratitude will also goes to a technical staff of Pawe agricultural research centre for their help in collecting the phenotypic data.
References
- Abdi A, Endashaw B, Zemede A, Awgechew T (2002) Patterns of morphological variation of sorghum (Sorghum bicolor (L.) Moench) landraces in qualitative characters in North Shewa and South Welo. Hereditas 137:161-172
[Crossref] [Googlescholar] [Indexed]
- Addisu GA (2011) Heritability and genetic advance in recombinant inbred lines for drought tolerance and other related traits in sorghum (Sorghum bicolor). J Agric Sci 5:1-9
- Adugna (2007) The role of introduced sorghum and millets in Ethiopian agriculture. J SAT Agric Res 3:1-4
- Allard RW (1960) Principles of plant breeding. John Wiley and Sons, New York, USA, 485.
- Bello D, Kadams AM, Simon SY, Mashi DS (2007) Studies on genetic variability in cultivated sorghum (sorghum bicolour (L.) Moench) cultivars of Adamawa state, Nigeria. American-Eurasian J Agric Environ Sci 2:297-302
[Indexed]
- Berhane G, Yilma K (1978) Improvement of Ethiopian sorghum diseases. Ethiopian sorghum improvement Project progress, Addis Ababa University, Nazreth, Ethiopia.
- Burton GA (1952) Estimating Heritability in tall fescu (Festuca arundincea) from replicated clonal material. J Agro 45:481-487
[Crossref] [Googlescholar] [Indexed]
- Deepalakshmi AJ, Ganesamurthy K (2007) Studies on Genetic variability and character association in kharif sorghum (sorghum bicolour (L) Moench). Indian J Agric Res 41:177–182
- Falconer DS (1981) Introduction to quantitative Genetics. 2nd Edition. Longman Group Ltd., London, 1-133.
- Falconer and Mackay (1961) How and when selection experiments might actually be useful. Integ Comp Biol 45:391-104
[Crossref] [Googlescholar] [Indexed]
- Geremew (1993) Morpho agronomic characterization of sorghum land races from Gambella. MSc Thesis. Alemaya University, Ethiopia.
- Godbharle AR, More AW, Ambekar SS (2010) Genetic Variability and Correlation Studies in elite ‘B’ and ‘R’ lines in Kharif Sorghum. Electron J Plant Breed 1:989-993
[Googlescholar] [Indexed]
- Gomez AK, Gomez AA (1984) Statistical procedures for agricultural research. 2nd Edition. John Willey and Sons Inc., Neyork USA, 680.
[Googlescholar] [Indexed]
- Govindaraj M, Shanmugasundaram P, Muthiah AR (2010) Estimates of genetic parameters for yield and yield attributes in elite lines and popular cultivars of India’s pearl millet. Afr J Agric Res 5:3060-3064
[Googlescholar] [Indexed]
- Habindavyi (2009) Morphological characterization of sorghum (Sorghum bicolor) diversity in Burundi. MSc Thesis. University of Uppsala, Uppsala. 48
- Jalal A, Al-Tabal, Ahmad H, AL-Fraihat (2011) Genetic variation, Heritability, phenotypic and Genotypic Correlation studies for yield and yield components in promising Barley Genotypes. J Agric Sci 4:193-210
[Googlescholar] [Indexed]
- Mahajan RC, Wadikar PB, Pole SP, Dhuppe MV (2011) Variability, Correlation and Path analysis studies in sorghum. J Agric Sci 2:101-103
- Mahdieh D, Abbas H, Reza D (2012) Determination of the genetic variation in Ajowan (Carum Copticum L.) populations using multivariate statistical techniques. J Agro 43:698-705
[Crossref] [Googlescholar] [Indexed]
- Mehmoods, Bashira A, Ahmad A, Akram Z (2008) Molecular characterization of regional sorghum bicolor varieties from Pakistan. Pak J Bot 40:2015-2021
[Googlescholar] [Indexed]
- Melakhail (1975) Crop germplasm diversity and resource in Ethiopia. In: Crop genetic resources for today and tomorrow. Cambridge University press, Cambridge 433-465
- Negash (2003) Genetic Variability and Associations among yield and yield relate d traits in sorghum (Sorghum bicolor (L.) Moench) Landraces of western Ethiopia. MSc Thesis, Alemaya University, Ethiopia.
- Rangswamy R (1995) A text book of Agricultural statics. New Age International (P) Limited. New Delhi, India 496.
- Singh BD (1999) Plant Breeding, principles and merhods. 4th Edition. New Delhi, Kalyani publishers, India 639.
- Singh P, Narayanan SS (1993) Biometrical techniques in plant breeding. Kalyani Publishers, New Delhi, India.
- Taylor SL, Payton ME, Raun WR (1999) Relationship between mean yield coefficient of variation, mean square error, and plot size in wheat field experiments. Commun Soil Sci Plant Anal 30:1439-47
[Crossref] [ Googlescholar] [Indexed]
- Wasihun (2007) Agro morphological characterization of Sorghum (Sorghum bicolor (L) Moench Landraces from Metekel area. MSc Thesis, Hawasa University, Ethiopia 104.

Open Access Journals
- Aquaculture & Veterinary Science
- Chemistry & Chemical Sciences
- Clinical Sciences
- Engineering
- General Science
- Genetics & Molecular Biology
- Health Care & Nursing
- Immunology & Microbiology
- Materials Science
- Mathematics & Physics
- Medical Sciences
- Neurology & Psychiatry
- Oncology & Cancer Science
- Pharmaceutical Sciences