Excellent Methanol Sensing Performance of Gas Sensor Based on Ag-LaFeO3 Modified with Graphene
Rong Q, Zi BY, Hu JC, Zhang YM, Zhu ZQ, Zhang J and Liu QJ*
School of Materials Science and Engineering, Yunnan Key Laboratory for Micro/nano Materials & Technology, Yunnan University, China
- *Corresponding Author:
- Liu QJ
School of Materials Science and Engineering
Yunnan Key Laboratory for Micro/nano Materials & Technology
Yunnan University
650091 Kunming, China
Tel: +86-871-65033814
E-mail: qjliu@ynu.edu.cn
Received Date: November 09, 2017; Accepted Date: January 05, 2018; Published Date: January 12, 2018
Citation: Rong Q, Zi BY, Hu JC, Zhang YM, Zhu ZQ, et al. (2018) Excellent Methanol Sensing Performance of Gas Sensor Based on Ag-LaFeO3 Modified with Graphene. J Mol Sci. 2:2.
Abstract
Ag-LaFeO3 (ALFO) was prepared using a sol-gel method combined with the microwave chemical synthesis. The ALFO were further modified by graphene (G-ALFO) with different weight ratio (0.50%, 0.75% and 1.00%). The composite material of G-ALFO was characterized using X-ray powder diffraction (XRD), transmission electron microscopy (TEM), Brunauer-Emmett-Teller (BET), Fourier transform infrared spectroscopy (FT-IR) and Raman spectrum to examine the morphology, microstructure and surface area. The 0.75% G-ALFO (0.75% are the weight ratio of G to ALFO) shows excellent selectivity and good response to methanol. The responses to 5 ppm methanol and the optimal operating temperature of 0.75% G-ALFO are 51 and 102°C, and a lower response (≤ 15) to other test gases including formaldehyde, acetone, ethanol, ammonia, gasoline and benzene was measured, respectively. The results showed that the 0.75% G-ALFO composite possesses high response, low operating temperature and good selectivity to methanol.
Keywords
Ag-LaFeO3; Methanol; Gas sensor; Sol-gel method
Introduction
Methanol is a common feed stock for several important chemicals and a potential alternative energy carrier, e.g. hydrogen. It is also a very useful organic solvent with widespread applications in the manufacturing industries of colors, dyes, drugs, perfumes, formaldehyde, etc., [1-3]. Methanol is toxic and fatal to human beings even in modest concentrations [4]. The wide range of applications of methanol, its toxicity, and the desirability to be able to fine tune its synthesis under demanding conditions strongly suggest the need of development of reliable and selective methanol detection device. Compared with the various traditional analytical systems, gas sensors have been acknowledged as simple and inexpensive tools for detection and quantification of toxic, harmful, flammable, and explosive gases. It is well known that gas sensors are the devices composed of active sensing materials coupled with a signal transducer. Therefore, the selection and development of a potential sensing material play an important role in designing high performance of gas sensors. In the past few decades, metal oxide semiconductor based gas sensors have been extensively investigated for various daily and industrial applications due to their outstanding sensing performance, even in harsh environments [5-7]. Therefore, p-type semiconductor (Ag-LaFeO3) has been proved to be promising for gas sensing by virtue of its large surface area, rich active oxygen lattice, good thermostability, controllable structure and strong reducibility with an abundance of functionalities [8-10]. But the current Ag-LaFeO3 (ALFO) gas sensors have the problems of high working temperature, lower response to the low concentration of methanol gas. The operating temperature and response are related to the conductivity and the electron mobility of the gas sensitive materials.
Graphene, a single two-dimensional (2D) carbon sheet with a hexagonal lattice structure, has larger specific surface area, excellent electron mobility and electric conductivity. The larger specific surface area, better conductivity and electron mobility is beneficial to improving the gas sensing properties [11,12]. However, to our knowledge, there is rarely literature that reports the gas sensing properties of the composites of graphene (G) and metal semiconductor oxides. In this work, ALFO was prepared using a sol-gel method combined with the microwave chemical synthesis. The ALFO further modified by G (G-ALFO) with different weight ratio (0.50%, 0.75% and 1.00%). The effect of the amount of G in the composites on the gas sensing responses of the sensors was investigated.
Experimental
Reagents and materials
G was purchased from Shanghai carbon Valley. Other chemicals are analytically pure and used as received without further purification. Water was purified by employing a Milli-Q water (resistivity of 18 MΩ cm at 25°C) and used throughout the work.
Preparation of G-ALFO
ALFO was prepared using sol-gel method combining with microwave chemical synthesis. In a typical procedure, 20 mmol of citric acid, 9.9 mmol of La(NO3)3•6H2O and 10 mmol of Fe(NO3)3•9H2O were dissolved in 90 mL of deionized water as solution A. 0.1 mmol AgNO3 were dissolved in 10 mL distilled water added to solution A, and then polyethylene glycol was added. The final mixed solution was kept under stirring at 80°C for 8 h, the mixture turned into a transparent and homogeneous yellow sol. And then the sol was put in a microwave chemical device (CEM, USA) at 75°C for 2 h as sol B. 1.0 mmol methanol mixed with 4 mmol MAA was treated by ultrasonic concussion for 30 min and stand for 8 h, called solution C. Then, 1.0 mmol AIBN was dissolved in 20 mL methanol and mixed with solution C and sol B. The final mixture was treated by ultrasonic concussion for 30 min. Finally, stirred at 50°C for 12 h with the protection of nitrogen and circulating water and then dried, Finally, the xerogel was heated at 800°C for 2 h, the ALFO was prepared. After ALFO was mixed with G according different weight ratio (0.50%, 0.75% and 1.00%), the mixtures were added into 50 mL deionized water, respectively, and decentralized under ultrasonic concussion for 15 h and then dried. The G-ALFO composite were prepared.
Preparation of sensors
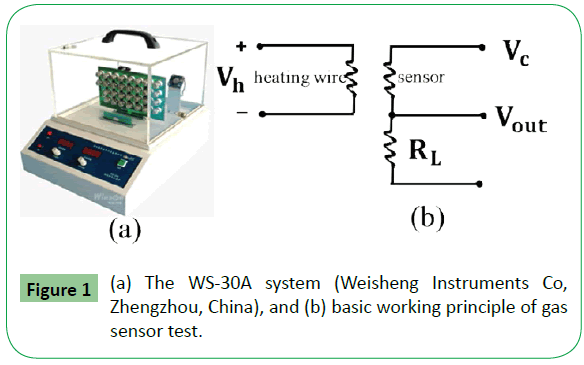
The gas sensing performances of the samples were measured in an intelligent gas sensor analysis system (WS-30A system, Weisheng Instruments Co, Zhengzhou, China) as shown in Figure 1a, which was commonly used to test the gas sensing behaviors [8]. The as-synthesized samples (G-ALFO) were mixed with methanol at a suitable ratio to form a paste. Then the paste was coated onto the outside of an alumina tube (4 mm in length, 1.2 mm in external diameter, and 0.8 mm in internal diameter) with a pair of Au electrodes at each end and corresponding platinum wires. The tube with a thickness of about 0.6-0.8 mm samples was dried, the tube with samples layer was connected to a Bakelite base through platinum wires to conduct electrical measurement. A Ni-Cr alloy wire was inserted into the tube to control the operating temperature by adjusting the heating voltage (Vh). Before measuring the gas sensing properties, the gas sensors were aged at 150°C to improve their stability and repeatability by the Ni-Cr wire heating for 170 h in air. For the purpose of clarity, a completed sensor as well as the basic working principle of the gas sensor test is depicted in Figure 1b. The exported signal of the sensor was measured by a conventional circuit in which the element was connected with an external constant load resistor (RL) in series at a circuit voltage of 5 V. It is well known that the sensor response (β) was defined as the ratio (Rg/Ra) of the sensor resistance in target gases (Rg) to that of in dry air (Ra) for a typical p-type gas sensor. The operating temperature of the sensors was varied in the range of 50-220°C. Meanwhile, the response and recovery times are defined as the time taken by the sensor to achieve 90% of the initial equilibrium resistance change in the adsorption and desorption processes, respectively.
Characterization
The morphological features and crystallinity of the sample were analyzed by using transmission electron microscopy (TEM; JEM- 2100, Hitachi, Japan). X-ray diffraction (XRD) data were collected from 10 to 90°(2θ) on a Japan AXS D/MAX-3BX advance device using Cu-Ka radiation (λ = 1.5406 Å) at a scanning rate of 2θ = 0.02°per step. The Brunauer-Emmett-Teller (BET) of the powders was analyzed by nitrogen adsorption isotherm (Quadrasorb-evo instrument). The pore size distributions were determined using the Barrett-Joyner-Halenda (BJH) method. Fourier transform infrared spectra (FT-IR; FTS-40) were recorded in KBr pellets with scanned from 4000 cm-1 to 400 cm-1.
Results and Discussion
Characterization of G-ALFO composite
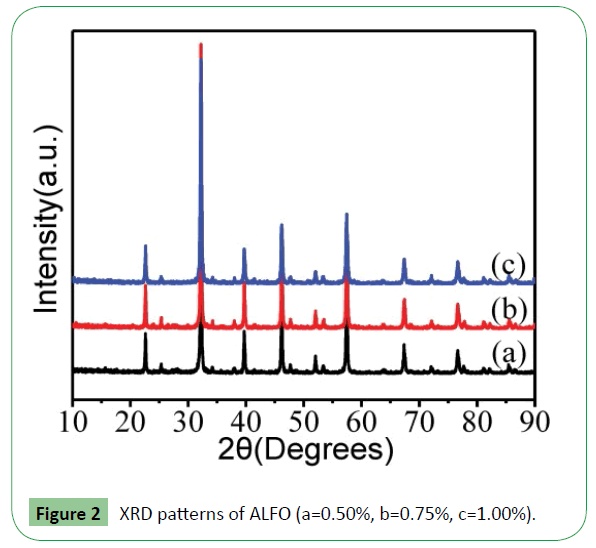
Figure 2 shows the XRD pattern analysis of the G-ALFO composite. It is clear that the composite is pure perovskite oxide LaFeO3 with an orthorhombic structure (JCPDS no: 37-1493) [13]. The amount of graphene added in the sample is very small and not detected, AIBN are removed from ALFO by sintering and only parts of the groups of functional monomer are maintained. No impure peaks were observed in the XRD patterns, indicating high purity of the samples.
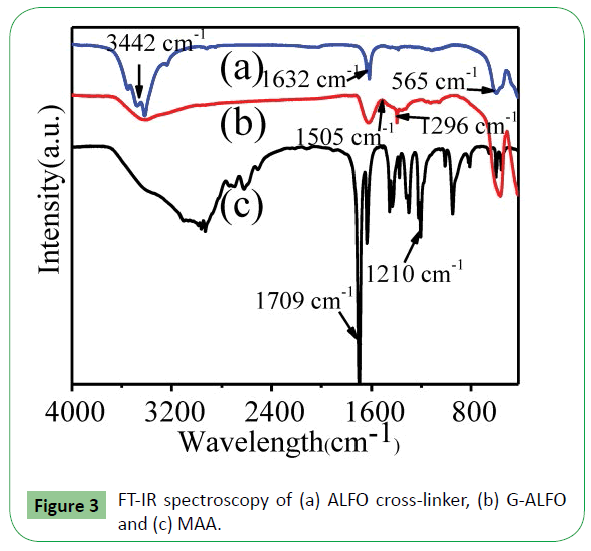
To further confirm the composition of the nanostructures formed from the corresponding G-ALFO compound, FT-IR spectroscopy was adopted. Figure 3 shows the FT-IR spectroscopy of ALFO cross-linker, G-ALFO, MAA in the broad absorption band 400-4000 cm−1. In the ALFO cross-linker curve, the broad peak occurring at 3442 cm−1 is assigned to the vibrational absorption band of O-H in H2O in air [14,15], and the other peaks at 565 cm−1 are corresponding to Fe-O vibrations. The peaks at 1632 cm−1 represent the La-O vibrations. In the curve of MAA, peaks at 1210 cm−1 and 1709 cm−1 are from the bending vibrations of C-O and C=O in carboxylic acid. In the G-ALFO curve, the bands at 1505 cm−1 attributes to the stretching C=O in COOH, the disappearance of the peaks at 1709 cm−1 compared with MAA curve suggested the successful interaction between ALFO and MAA. The interaction should be ascribed to the coordination between carbonyl groups in MAA and La in ALFO cross-linker, which results in the formation of metal carbonyl complexes [16,17].
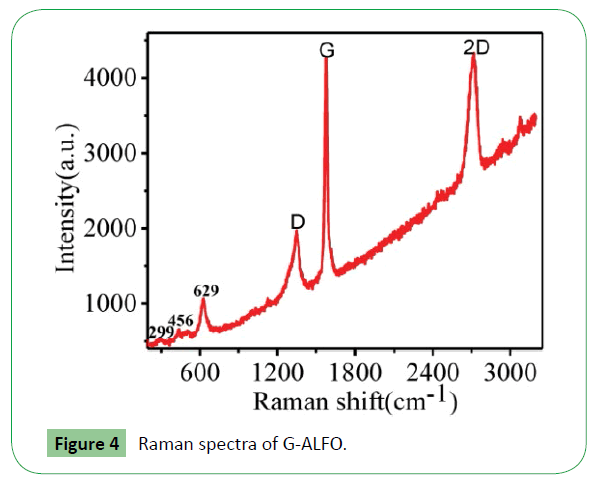
Figure 4 represents Raman spectra measured from the G-ALFO. The G-ALFO has three typical bands D, G, and 2D that correspond to ~1346 cm-1, ~1583 cm-1, and ~2688 cm-1, respectively. The D band indicates the breathing mode of the rings of sp2- hybridized carbon [18]. Its intensity reflects graphene quality because it is activated by the presence of plane defects and disorders [19]. The G band is related to the in plane vibration of sp2 C atoms in single layer grapheme [20] and the 2D band is very sensitive to the stacking order along graphene’s c-axis [21]. As shown in Figure 4, the relatively low intensity of the D band in graphene indicates the low density of defects. The peaks at 299 and 456 cm-1 corresponds to Ag and B3g assigned modes. Two photons scattering and impurity related scattering are observed at 629 cm-1. The peak positions are in good agreement with the values reported for LaFeO3 [22]. No other peaks corresponding to lanthanum oxide and iron oxide were found in accordance with XRD.
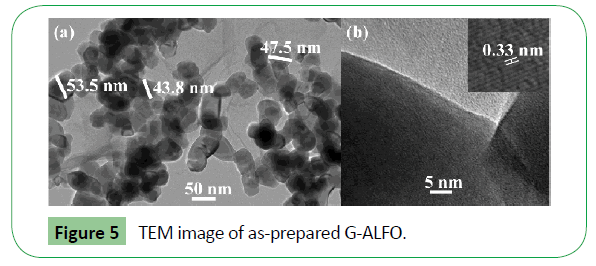
Further insights into the morphology and crystal structure of the prepared nanostructures were provided by TEM and HRTEM images as shown in Figure 5. The distribution of ALFO particles on the surface of graphene, the particles are generally irregular and agglomerated, with average size ~50 nm, as in Figure 5a. HRTEM image Figure 5b clearly shows that ALFO nanoparticles are in crystalline state with lattice space of 0.33 nm corresponding to (101) plane. ALFO has better crystalline properties.
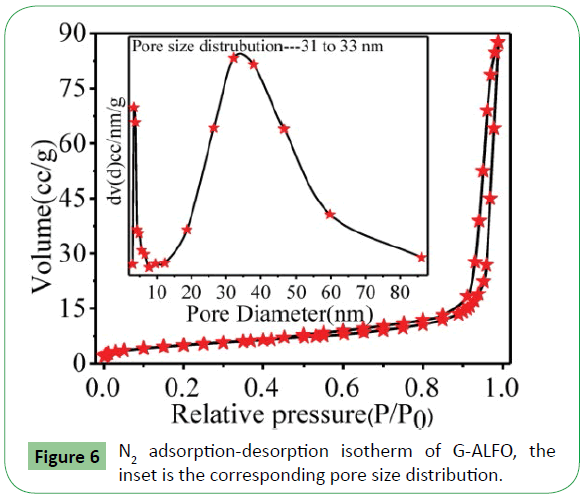
The specific surface area and pore size distribution of the G-ALFO hierarchical composite were further characterized by N2 adsorption-desorption measurements. The isotherm illustrated in Figure 6 reveals a typical IV adsorption branches with a H3 hysteresis loop according to IUPAC classification [23], implying that there are abundant mesopores resulted from the G-ALFO. The BET surface area of G-ALFO is calculated to be 17.7 m2 g-1, with diameter of hole is 32 nm. The results indicate that the hierarchical G-ALFO have a higher sensing area than the pure ALFO [22]. The high surface area may be attributed to the pure ALFO aggregation on the surface of graphene as shown in the TEM image.
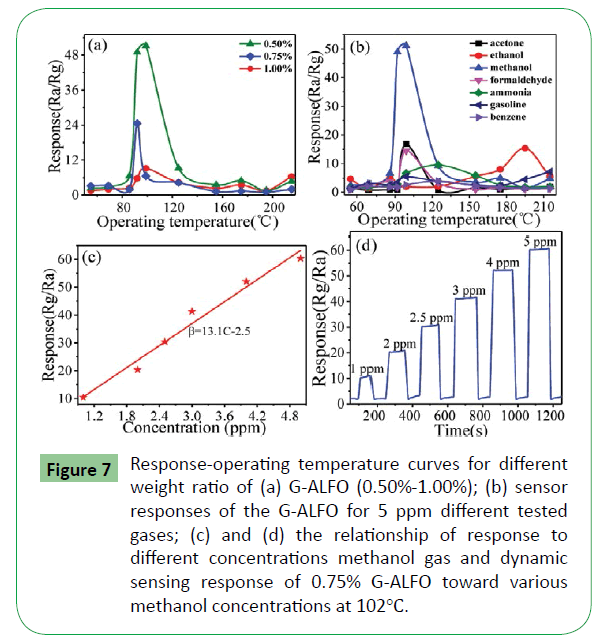
Figure 7a depicts the relationship between response and operating temperature of G-ALFO (0.50%-1.00%) sensors to 5 ppm methanol gas. Sensors with 0.75% G-ALFO exhibit higher response to methanol gas at the operating temperature between 50°C and 220°C. To investigate the selectivity of 0.75% G-ALFO sensor, the response of formaldehyde, methanol, toluene, acetone and gasoline were respectively tested for 5 ppm at different operating temperature as shown Figure 7b. It can be found that the sensors behave well in selectivity to methanol. It can be seen that 0.75% G-ALFO exhibit higher response (51) to methanol than the other test gases (≤ 15) at 102°C, respectively. The time taken by the resistance to change from Ra to Ra-90% (Ra-Rg) was defined as the response time (τres), when the sensor was exposed to the test gas.
Figure 7: Response-operating temperature curves for different weight ratio of (a) G-ALFO (0.50%-1.00%); (b) sensor responses of the G-ALFO for 5 ppm different tested gases; (c) and (d) the relationship of response to different concentrations methanol gas and dynamic sensing response of 0.75% G-ALFO toward various methanol concentrations at 102°C.
On the contrary, when the sensor was retrieved from the test gas, the time taken by the resistance to range from Rg to Rg+90% (Ra- Rg) was defined as the recovery time (τrecov) [24]. It can be found in Figure 7c that the responses increased linearly with the methanol concentration from 1 to 5 ppm, the linear relationship between the response and the concentration of methanol is β=13.1 C-2.5, in which β is a response of methanol, C is a concentration, and 13.1 and 2.5 are the regression coefficients. It can be proved that this device can be used for real time detection. To confirm the practical application, air samples from a liquor store and a hospital were collected as sample-1 and sample-2, respectively. Sample-1 and sample-2 were tested through the device in this paper. Then two response value were achieved. According to the linear relationship from Figure 7c, corresponding concentration of methanol can be calculated. During the test, the responses to sample-1 and sample-2 were found to be different, the response to sample-1 was about 500, and the corresponding concentration was calculated to be 40 ppm. The response to sample-2 was about 55, and the corresponding concentration was calculated to be 3.8 ppm. According to this test method, we can also collect gas samples form factories or laboratories to test the corresponding concentration to evaluate if it exceeds the national regulations (50.05 mg/m3). Figure 7d shows the dynamic response of the 0.75% G-ALFO composite at 102°C working temperatures and different concentrations of methanol from 1 ppm to 5 ppm. The G-ALFO exhibit a repeatable, fast response and recovery towards methanol at 102°C. The response times (30 s) and recovery times (28 s) for 5 ppm concentration of methanol at 102°C working temperatures.
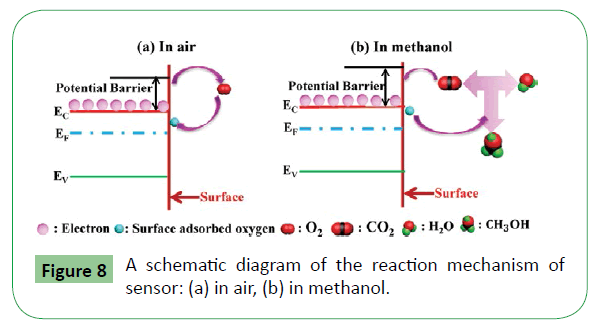
A proposed sensing mechanism is illustrated in Figure 8. Firstly, when the sensor was exposed to air, the adsorbed O2 molecules will be transformed into oxygen ions (O2-, O-, O2-) by combining with electrons in the ALFO conduction band [25]. Thus, a thin space-charge layer and a relative low potential barrier are formed leading to a lower resistance (Ra). In the target methanol gas, the target gases can react with oxygen species on the G-ALFO from the discretional direction. The space-charge layer on the surface of ALFO becomes thick and the electrical resistance (Rg) of sensor increases. In addition, the sensor based on G-ALFO composite exhibit higher response to methanol than that of ALFO, the reason maybe contributed to the following, the high specific surface area distributed can facilitate the diffusion of methanol vapor and improve the reaction of methanol vapor with oxygen adsorbed on the surface of material. G possess outstanding electrical conductivity, which can improve conductivity of composites and result in electrons quickly spreading to surface of the materials, leading to quick response and recovery time [26]. Therefore, the gas sensing properties have been greatly improved by loading G with ALFO.
Conclusions
In summary, ALFO is prepared via sol-gel method combined with the microwave chemical synthesis. The experimental results indicate that the amount of G in the composites have a significant influence on the gas sensing responses of G-ALFO composites. The responses of the sensor based on 0.75% G-ALFO composite to 5 ppm methanol attain 51 at 102°C. The response and recovery times for 5 ppm methanol vapor are only 30 s, 28 s when operate at 102°C. Loading G with ALFO enhanced the gas sensing response and selectivity to methanol. Therefore, the sensor based on G-ALFO composite possessed high response, good selectivity and low operating temperature to methanol.
Acknowledgements
This work was supported by National Natural Science Foundation of China (no. 51562038 and 51402257) and Yunnan basic applied research project (no. 2017FB086).
References
- Chauhan I, Aggrawal S, Mohanty P (2015) Metal oxide nanostructures incorporated immobilized paper matrices and their applications: a review. RSC Adv 5: 83036-83055.
- Patel NG, Patel PD, Vaishnav VS (2003) Indium tin oxide (ITO) thin film gas sensor for detection of methanol at room temperature. Sens Actuators B 96: 180-189.
- Smith RD, Loo JA, Loo RRO, Busman M, Udseth HR (2010) Principles and practice of electrospray ionization-mass spectrometry for large polypeptides and proteins (p 359-452). Mass Spectrom Rev 10: 359-452.
- Patel NG, Patel PD, Vaishnav VS (2003) Indium tin oxide (ITO) thin film gas sensor for detection of methanol at room temperature. Sens Actuators B 96: 180-189.
- Kaushik A, Kumar R, Arya SK, Nair M, Malhotra BD, et al. (2015) Organic-inorganic hybrid nanocomposite-based gas sensors for environmental monitoring. Chem Rev 115: 4571-4606.
- Majhi SM, Rai P, Yu YT (2015) Facile approach to synthesize Au@ZnO core-shell nanoparticles and their application for highly sensitive and selective gas sensors. ACS Appl Mater Interfaces 7: 9462-9468.
- Singkammo S, Wisitsoraat A, Sriprachuabwong C, Tuantranont A, Phanichphant S, et al. (2015) Electrolytically exfoliated graphene-loaded flame-made Ni-doped SnO2 composite film for acetone sensing. ACS Appl Mater Interfaces 7: 3077-3092.
- Thirumalairajan S, Girija K, Mastelaro VR, Ponpandian N (2014) Surface morphology-dependent room-temperature LaFeO3 nanostructure thin films as selective NO2 gas sensor prepared by radio frequency magnetron sputtering. ACS Appl Mater Interfaces 6: 13917-13927.
- Zhang Y, Liu Q, Zhang J, Zhu Q, Zhu Z (2014) A highly sensitive and selective formaldehyde gas sensor using a molecular imprinting technique based on Ag-LaFeO3. J Mater Chem 2: 10067-10072.
- Sun P, Zhou X, Wang C, Shimanoe K, Lu GY, et al. (2014) Hollow SnO2/α-Fe2O3 spheres with a double-shell structure for gas sensors. J Mater Chem A 2: 1302-1308.
- Zhu Q, Zhang YM, Zhang J, Zhu ZQ, Liu QJ (2015) A new and high response gas sensor for methanol using molecularly imprinted technique. Sens Actuators B 207: 398-403.
- Dai ZF, Lee CS, Kim BY, Kwak CH, Yoon JW, et al. (2014) Honeycomb-like periodic porous LaFeO3 thin film chemi-resistors with enhanced gas-sensing performances, Acs Appl Mater Interfaces 6: 16217-16226.
- Shin TH, Ida S, Ishihara T (2011) Doped CeO2-LaFeO3 composite oxide as an active anode for direct hydrocarbon-type solid oxide fuel cells. J Am Chem Soc 133: 19399-19407.
- Cheng X, Liang K, Liu G, Song N (2007) Synthesis and crystal structure of carboxyl oxygen-bridged La(III) four-nuclear complex [C48H60La4O35]. Chem Bull 70: 861-864.
- Yang J, Weng SF, Fang YE, Gao HC (2002) Synthesis and spectroscopic characterization of complexes of trivalent lanthanide ions Eu(III) and Tb(III). Spectrosc Spect Anal 22: 741-744.
- Hajiashrafi T, Kharat AN, Love JA, Patrick BO (2013) Synthesis, characterization and crystal structure of three new lanthanide (III) complexes with the [(6-methyl-2-pyridyl) methyl] bis (2-pyridylmethyl) amine. Polyhedron 60: 30-38.
- Dong C, Xing X, Chen N, Liu X, Wang Y (2016) Biomorphic synthesis of hollow CuO fibers for low-ppm-level n-propanol detection via a facile solution combustion method. Sensors Actuators B 230: 1-8.
- Graf D, Molitor F, Ensslin K, Stampfer C, Jungen A (2007) Spatially resolved raman spectroscopy of single- and few-Layer graphene. Nano Lett 7: 238-242.
- Kayhan E, Prasad RM, Gurlo A, Yilmazoglu O, Engstler J, et al. (2012) Synthesis, characterization, electronic and gas-sensing properties towards H2 and CO of transparent, large-area, low-layer grapheme. Chem 18: 14996-15003.
- Pimenta MA, Dresselhaus G, Dresselhaus MS, Cançado LG, Jorio A, et al. (2007) Studying disorder in graphite-based systems by Raman spectroscopy. Phys Chem Chem Phys 9: 1276-1291.
- Cançado L, Reina A, Kong J, Dresselhaus M (2008) Geometrical approach for the study of G' band in the Raman spectrum of monolayer graphene, bilayer graphene, and bulk graphite. Phys Rev B 77: 1-9.
- Li FT, Liu Y, Liu RH, Sun ZM, Zhao DS (2010) Preparation of Ca-doped LaFeO3 nanopowders in a reverse microemulsion and their visible light photocatalytic activity. Mater Lett 64: 223-225.
- Liu Z, Xing Y, Xue Y, Wu D, Fang S (2015) Synthesis, characterization, and fischer-tropsch performance of cobalt/zinc aluminate nanocomposites via a facile and corrosion-free coprecipitation route. J Nanopart Res 17: 1-11.
- Zhao JH, Tang LB, Xiang JZ, Ji RB, Hu YB, et al. (2015) Fabrication and properties of a high-performance chlorine doped graphene quantum dot based photovoltaic detector. RSC Advances 5: 29222-29229.
- Chen H, Wang Q, Kou C, Sui Y, Zeng Y (2014) One-pot synthesis and improved sensing properties of hierarchical flowerlike SnO2 assembled from sheet and ultra-thin rod subunits. Sens Actuators B 194: 447-453.
- Yan J, Fan Z, Wei T, Qian W, Zhang M (2010) Fast and reversible surface redox reaction of grapheme-MnO2 composites as super-capacitor electrodes. Carbon 48: 3825-3833.
Open Access Journals
- Aquaculture & Veterinary Science
- Chemistry & Chemical Sciences
- Clinical Sciences
- Engineering
- General Science
- Genetics & Molecular Biology
- Health Care & Nursing
- Immunology & Microbiology
- Materials Science
- Mathematics & Physics
- Medical Sciences
- Neurology & Psychiatry
- Oncology & Cancer Science
- Pharmaceutical Sciences
