Evaluation of Iranian Plastic Industries
Department of Environmental science, UCS, Osmania University, Hyderabad, India
- *Corresponding Author:
- Malek Hassanpour
Department of Environmental science, UCS
Osmania University, Hyderabad, India
E-mail: Malek.hassanpour@yahoo.com
Received date: July 23, 2018; Accepted date: September 10, 2018; Published date: September 17, 2018
Citation: Hassanpour M (2018)Evaluation of Iranian Plastic Industries. J Waste Recycl Vol.3 No.2:11
Abstract
Keywords
Evaluation; Iranian plastic industries; Environmental assessment
Introduction
The first industrial scale generation of plastics commenced in the 1940. The basic raw material for plastic generation is naphtha, come out from crude oil refining operations. The finished plastic consists of repetitive units of monomer incorporated with several other chemicals to procure its desired scheme, color, flexibility and other properties. These chemicals are collectively known as additives, which pertaining on their functions has been classified into different major groups. Different amounts of additives utilized for plastics generation. The main components of a plastic product is made up from about 58% plasticizers, 3% heat stabilizers, 8% flame retardants, 9% blowing agents, 12% colorants and 7% others. Global plastic generation reported around 230 and 299 million ton in 2009 and 2013 respectively, 3.9% rise from 2012 [1]. Mattsson et al., [2] declared that around 280 million ton of plastics released by 2012, 90% was devoted to Low Density Polyethylene (LDPE), High Density Polyethylene (HDPE), Polypropylene (PP), Polyvinylchloride (PVC), Polystyrene (PS) and Poly Ethylene Terephthalate (PET) products. More than 1/3 of this rate is applied for packing applications like plastic bags and another third for housing appliances like plastic pipes and vinyl cladding [3]. The main applications for plastics in particular have been house ware, packaging, toys and construction usages. There are around 7 kinds of plastics which are low-density, durable, formable and low-cost materials which do not decay, corrode, or dissolve, owning to their properties, are extensively employed in variety of fields, sectors and industries such as PET, HDPE, PVC, LDPE, PP, PS and etc. [4]. According to recent reports published by Iranian industries organization around 414 various types of industrial groups are currently active so that generate and produce human demands in Iran. IPI include around 21 types of plastic industries which data associated to them has been gathered by studies of Iranian Industries Organization (IIO) in parallel with Iranian Environment Protection Agency (IEPA). Many practices and methods have been developed to assess and evaluate industries and other projects to make it easy for the decision making purposes.
Decision making in a project context is a complex concept regarding to available options, criteria and factors. The term complexity is a dramatically important aspect of an evaluation when we are trying to know the executive demands of projects in general, and of the various situations emerged in projects. On the one hand, a project is a temporary and transient organization included by inherent uncertainty. When complexity becomes too prominent, the possibilities, interrelations and interactions are become so fuzzy that the system has to be scrutinized by proper tools, equations and skills. Consequently, analysts supposed to complex project need to underpin a decision-making model based on relevant evaluation circumstances. Therefore, the project performance evaluation is inevitable and necessary step before construction [5,6]. So far, several decision approaches have been used to help project evaluation such as economic models, mathematical programming, artificial intelligence optimization practices, integrated models, data envelopment analysis (DEA) method, integrated the balanced scorecard approach and Multi Criteria Decision Making (MCDM) models. MCDM models can assist to figure out a sufficiently appropriate solutions with an extensive interval of alternatives also comprise complex problems that involve high uncertainty, conflicting objectives, possessing different forms of information, multiple interests and different perspectives [7]. To assess the overall achievements of projects, MCDM models have been employed to collect multiple performance measures under different application contexts. AHP, analytic network process, Technique for Order of Preference by Similarity to Ideal Solution (TOPSIS), Decision Making Trial and Evaluation Laboratory (DEMATEL), ELimination Et Choix Traduisant la REalite (ELECTRE) and some hybrid practices are number of MCDM methods applied to projects evaluation [8]. Hassanpour [9,10], Ahmadi and Ahmadi [11], Vahidi et al., [12] used fuzzy logic, statistical analysis and DEA models to evaluate projects such as Iranian recycling industries, wastewater treatment plant sludge of Hyderabad to make brick, manufacturing industries and challenges and opportunities of industrial ecology development in Iran respectively. Therefore, to cover the objective of present research as evaluation of IPI, we used the raw data of evaluator team to classify aforementioned industries based on Delphi fuzzy set and possibility of employing DEA for input and output materials streams to figure out efficiency of industries as well as offering lots of useful information to utilize globally.
Materials and Methods
Kendall's W and Friedman tests
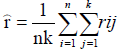
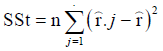
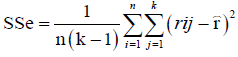
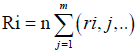
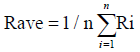
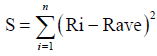
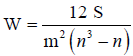
Current cluster study empirically carried out based on raw data released by both of IIO and IEPA that includes an evaluation before establishment of IPI. Aforementioned raw data were processed using IBM SPSS Statistic 20 software and AHP to analysis the data of IPI. Friedman test analysis has been set as data [Xij] n × k in a matrix with n columns, estimates the ranks within each block with a single value via eqns. (1)-(6). The test statistic was calculated by eqn. (5). With regard to this fact, to the object i is assigned the rank rij by judge number j, where there are in total n objects and m value. Therefore, the total rank given to object i was computed using eqns. (6)-(9). The mean value of these total ranks was calculated via eqn. (7). The sum of squared deviations, S, is calculated via eqn. (8). Kendall's W is defined as eqn. (9). W=1 means complete agreement among findings and W=0 represents no agreement situation [13,14].
 (1)
(1)
 (2)
(2)
 (3)
(3)
 (4)
(4)
 (5)
(5)
 (6)
(6)
 (7)
(7)
 (8)
(8)
Fuzzy set theory
The weighing system denotes,  and Table 1 includes
the fuzzy set, in which symbols, verbal words, real words and
fuzzy numbers were defined by some values and words.It is very
easy to change fuzzy values (M, a, b) as m2+b to m1-a. The model
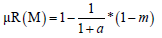
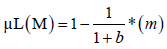
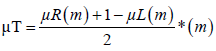
assigned (Figure 1) represents a fuzzy number for each symbol
that can be shifted to a real number via eqns. (10)-(12), N=(m, a,
b) and eqn. (13) can be applied to prioritize factors and criteria.
and Table 1 includes
the fuzzy set, in which symbols, verbal words, real words and
fuzzy numbers were defined by some values and words.It is very
easy to change fuzzy values (M, a, b) as m2+b to m1-a. The model
assigned (Figure 1) represents a fuzzy number for each symbol
that can be shifted to a real number via eqns. (10)-(12), N=(m, a,
b) and eqn. (13) can be applied to prioritize factors and criteria.
Table 1: Delphi fuzzy set.
| Symbol | VL | L | SL | M | SH | H | VH |
|---|---|---|---|---|---|---|---|
| Verbal words | Very low | Low | Slightly low | Medium | Slightly high | High | Very high |
| Real value | (0.09, 0, 0.1) | (0.2, 0.1, 0.1) | (0.3, 0.1, 0.2) | (0.5, 0.1, 0.1) | (0.6, 0.1, 0.2) | (0.8, 0.1, 0.1) | (0.85, 0.1, 0) |
| Fuzzy number | 0.1362 | 0.2272 | 0.3695 | 0.5 | 0.6304 | 0.7727 | 0.8636 |

Figure 1: A triangular fuzzy numbers [14].
 (10)
(10)
 (11)
(11)
 ( 12)
( 12)
 (13)
(13)
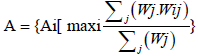
The weighing system was implemented based on  , (j=0-1) and indicators priority complies following trend. A vector
is extracted base on distinguished criteria and their rank values.
The natural attribution of the
, (j=0-1) and indicators priority complies following trend. A vector
is extracted base on distinguished criteria and their rank values.
The natural attribution of the
Incompatibility among available data was investigated via eqn. (14) in the matrix.
 (14)
(14)
ƛmax (The biggest eigenvalue of the pairwise comparison) for an existing matrix is always ≥ m (criteria number), and this value will be identical to m in a matrix. So, ƛmax-m is a reasonable measure of the incompatibility degree within the matrix. In the study by Saaty [15] investigated the Consistency Index (CI) with a Random Index (RI) and then manifested that RI for various amounts of m; released based on random matrices of A and estimating the average of CI within the matrices. RI is the random index extracted from a table set by Saaty [15] for matrix with rows going from 1 to 10. By the definition if CR ≤ 0.1 (eqn. (15)); the matrix compatibility is accepted. In current research our data are findings of financial and economical assessments conducted by Iranian industries organization once before establishment of each industry. Therefore, it is impossible to change the obtained and calculated data for the CR ratio set by Saaty [15]. Table 2 shows the incidence of random inconsistencies.
Table 2: Incidence of random inconsistencies [15].
| m | 1 | 2 | 3 | 4 | 5 | 6 | 7 | 8 | 9 | 10 |
|---|---|---|---|---|---|---|---|---|---|---|
| RI | 0.0 | 0.0 | 0.58 | 0.9 | 1.12 | 1.24 | 1.32 | 1.41 | 1.45 | 1.49 |
 (15)
(15)
Eqn. (16) was employed to calculate the priority vectors using the following equation; Z, x and max are the matrix of pairwise comparison values, priority vector or Principal Eigen vector and maximum or principal Eigen value of matrix Z [14,15].
 (16)
(16)
Results and Discussion
Industries flow-diagram and AHP
IPI include well developed technologies to generate variety of plastic products. Figure 2 displays IPI and generation processes. Tables 3 and 4 portray input materials introduced into IPI, their energy consumptions, initial feed based on nominal capacity.

Figure 2: IPI and generation processes.
Table 3: Input materials introduced into IPI.
| Industry | Input materials |
|---|---|
| 1 | PP and PS plastics with additives (20225 t) |
| 2 | PP (840 t); PS (17.2 t); Polystyrene (360 t); Granule of PS (7.4 t); Plastic straps (600 kg) |
| 3 | LDPE or PE (1000 t) |
| 4 | Resin (84240 kg); Methyl Ethyl Ketone peroxide (880 kg); Cobalt Naphthenate (440 kg); CaCO3 (21780 kg); Various dyes (506 kg) |
| 5 | PVC Granule (497.5 t); Pigment (7650 kg); Nylon cords (240 kg); Packaging tape (125000 m) |
| 6 | PP granule (1000 t); Pigment (50 t); Stabilizer (10 t) |
| 7 | PVC (680.9 t); Softener oil DOP (340.5 t); CaCO3 (680.9 t); Barite-Cadmium (13.7 t); Epoxy oil (20.4 t); Stearic acid 95% (3.4 t); Organic dye (12.7 t); Ink (15 t); PE bags (1.5 t); Three layers carton 50 × 50 × 20 cm (10000 No) |
| 8 | Tape-shaped air extruder (1 No); Small weaving and sewing machines (16 and 2 No); Print machine (1 No); Baling press (1 No); Cutting machine (1 No); Resistance measurement machine for fibers and yarns (1 No) |
| 9 | HDPA (755159 kg); LDPA (157070 kg); PP (124659 kg); Dye (930 kg); Ink (1000 kg); PE (800 kg); Cardboard packages (1292760 No); Packaging carton (18198 No) |
| 10 | HDPE (1485 t); PE strip for packaging (70000 m); Three layers carton (5000 m) |
| 11 | PVC powder (1287 t); CaCO3 as filler (72 t); Stabilizer (34 t); Paraffin lubricant (7 t); PE bag (4 t) |
| 12 | PVC (409710 m2); PVC buttons (3969000 pairs); Plastic tapes (476280 m); Cardboard carton (686800 No); Packaging carton (14452 No); Packaging gum as roll (15024 No) |
| 13 | Plastic granules (550 t); Pigment (10 t); Dye (1 t) |
| 14 | PVC granule (505 t); Cardboard and carton (1080000 t) |
| 15 | HDPE (654 t); Pigment (5.67 t) |
| 16 | PP, density of 0.9 g/cm3 (27000 kg); Acrylic (1273 kg); PS (4242 kg); Tungsten wire, 4.75 micron, d=0.5-1.25 mm (40 kg); Al (105 kg); Copper head screw (630000 No); Lamp (630000 No); Coil, 3.1 g (1900 kg); Steel sheets of 0.3 mm (1890 kg); Steel sheets of 0.4 mm (3795 kg); Cartons in dimensions of 20 × 7 cm (10100 No) |
| 17 | Cyclohexanone, 50% (418 No); Tetrahydrofuran, 30% (250 No); PVC granules, 20% (168 No); Tube, 125 g (3337200 No); Cans of about 275 g (1516909 No); Cardboard tube boxes (3337200 No); Paper labels (1516909 No); Three layers boxes (63204 No); Tape (650 No); Cardboard tube boxes (92700 No) |
| 18 | Blades (105 t); PS (528 t); Titanium dioxide (5 t); Pigment (500 kg); Oil (20 t); Nylon (120 t); Carton of about 25 × 50 × 50 cm (100000 No); Tape (24000 rolls) |
| 19 | LDPE (800 t); Dye (160 kg) |
| 20 | PVC (3672 t); Shaping materials (55 t); Stabilizer (73 t); Additives (37 t); Paper in sizes of 0.5 × 2 m for packaging purposes (220000 No) |
| 21 | PP (121500 kg); HDPE (72900 kg); PS (121500 kg); Plastic (1277 kg); Packaging carton (22186 kg); Cellophane for packaging (1312200 No) |
No: Number.
Table 4: IPI, their energy consumptions, initial feed based on nominal capacity.
| Land (m2) | Fuel (GJ) | Water (m3) | Power (kW) | Employees | Initial feed* | Nominal capacity | Industry |
|---|---|---|---|---|---|---|---|
| 10300 | 8 | 26 | 432 | 51 | 20225 t | 2000 t | 1 |
| 8300 | 8 | 26 | 445 | 62 | 1225.2 t | 1200 t | 2 |
| 7600 | 9 | 6 | 339 | 9 | 1000 t | 630 t | 3 |
| 2700 | 4 | 6 | 201 | 24 | 107.846 t | 100 t | 4 |
| 2900 | 4 | 6 | 85 | 25 | 505.4 t+125000 m | 500 t | 5 |
| 3900 | 5 | 15 | 230 | 50 | 1060 t | 1000 t | 6 |
| 10000 | 31 | 29 | 222 | 72 | 1769 t+10000 No | 1700 t | 7 |
| 7000 | 61 | 17 | 449 | 48 | 937 t | 900 t | 8 |
| 3200 | 4 | 13 | 254 | 63 | 2.73 t+1310958 No | 1052.67 t | 9 |
| 5800 | 6 | 13 | 334 | 56 | 1485 t+75000 m | 1500 t | 10 |
| 3200 | 5 | 7 | 289 | 29 | 1404 t+409710 m2+3969000 pairs+476280 m | 1400 t | 11 |
| 1800 | 82 | 4 | 3 | 17 | 716276 No | 1000000 No | 12 |
| 3500 | 6 | 9 | 672 | 46 | 561 t | 18000 No | 13 |
| 5900 | 12 | 12 | 106 | 29 | 1080505 t | 2160000 No | 14 |
| 3100 | 3 | 7 | 292 | 17 | 659.67 t | 246140 No | 15 |
| 2600 | 4 | 6 | 245 | 30 | 40.245 t | 600000 No | 16 |
| 2500 | 3 | 4 | 129 | 12 | 9865608 No | 4854109 No | 17 |
| 6600 | 5 | 15 | 169 | 70 | 124000 No+778.5 t | 75000000 No | 18 |
| 3200 | 5 | 4 | 324 | 12 | 800.16 t | 385000 m2 | 19 |
| 4900 | 101 | 10 | 206 | 46 | 220000 No+3837 t | 21600 m2 | 20 |
| 2100 | 3 | 8 | 86 | 29 | 339.36 t+1312200 No | 175.26 t+13580 rolls | 21 |
*Sum of input materials introduced into IPI (Extracted from Table 3); No=number.
It was used SPSS Software along with AHP to classify around 21 IPI. The obtained findings were revealed the ranks values around 2.88, 3.86, 1.74, 1.52 and 5 for number of employees, power, water and fuel consumed and land area occupied using Friedman test analysis. Tables 5 and 6 display criteria/symbols versus factors based on Likert spectrum, fuzzy decision-making approach to prioritize the factors and decision matrix set in fuzzy system respectively.
Table 5: Criteria/symbols versus factors based on Likert scale.
| Criteria/symbols | Employees | Power (kW) | Water (m3) | Fuel (GJ) | Land (m2) | Symbol |
|---|---|---|---|---|---|---|
| Very high | 121-140 | 1001-1800 | 96-145 | +250 | 16501-24000 | VH |
| High | 101-120 | 601-1000 | 56-95 | 201-250 | 12501-16500 | H |
| Slightly high | 81-100 | 401-600 | 41-55 | 101-200 | 10001-12500 | SH |
| Medium | 61-80 | 301-400 | 31-40 | 76-100 | 7501-10000 | M |
| Slightly low | 41-60 | 201-300 | 21-30 | 51-75 | 5001-7500 | SL |
| Low | 21-40 | 101-200 | 11-20 | 26-50 | 2501-5000 | L |
| Very low | 0-20 | 0-100 | 0-10 | 0-25 | 0-2500 | VL |
Table 6: Fuzzy decision-making approach to prioritize the factors.
| Weights | Land | Fuel | Water | Power | Employees | Nominal capacity | Industry |
|---|---|---|---|---|---|---|---|
| 7.449 | 0.6304 | 0.1362 | 0.3695 | 0.6304 | 0.3695 | 2000 t | 1 |
| 7.22 | 0.5 | 0.1362 | 0.3695 | 0.6304 | 0.5 | 1200 t | 2 |
| 5.26 | 0.5 | 0.1362 | 0.1362 | 0.5 | 0.1362 | 630 t | 3 |
| 3.66 | 0.2272 | 0.1362 | 0.1362 | 0.3695 | 0.2272 | 100 t | 4 |
| 2.76 | 0.2272 | 0.1362 | 0.1362 | 0.1362 | 0.2272 | 500 t | 5 |
| 4.22 | 0.2272 | 0.1362 | 0.2272 | 0.3695 | 0.3695 | 1000 t | 6 |
| 6.35 | 0.5 | 0.2272 | 0.3695 | 0.3695 | 0.5 | 1700 t | 7 |
| 6.3 | 0.3695 | 0.3695 | 0.2272 | 0.6304 | 0.3695 | 900 t | 8 |
| 4.6 | 0.2272 | 0.1362 | 0.2272 | 0.3695 | 0.5 | 1052.67 t | 9 |
| 5.44 | 0.3695 | 0.1362 | 0.2272 | 0.5 | 0.3695 | 1500 t | 10 |
| 3.66 | 0.2272 | 0.1362 | 0.1362 | 0.3695 | 0.2272 | 1400 t | 11 |
| 2.6 | 0.1362 | 0.5 | 0.1362 | 0.1362 | 0.1362 | 1000000 No | 12 |
| 5.62 | 0.2272 | 0.1362 | 0.1362 | 0.7727 | 0.3695 | 18000 No | 13 |
| 3.982 | 0.3695 | 0.1362 | 0.2272 | 0.2272 | 0.2272 | 2160000 No | 14 |
| 3.4 | 0.2272 | 0.1362 | 0.1362 | 0.3695 | 0.1362 | 246140 No | 15 |
| 3.66 | 0.2272 | 0.1362 | 0.1362 | 0.3695 | 0.2272 | 600000 No | 16 |
| 2.39 | 0.1362 | 0.1362 | 0.1362 | 0.2272 | 0.1362 | 4854109 No | 17 |
| 4.77 | 0.3695 | 0.1362 | 0.2272 | 0.2272 | 0.5 | 75000000 No | 18 |
| 3.902 | 0.2272 | 0.1362 | 0.1362 | 0.5 | 0.1362 | 385000 m2 | 19 |
| 4.82 | 0.2272 | 0.6304 | 0.1362 | 0.3695 | 0.3695 | 21600 m2 | 20 |
| 2.3 | 0.1362 | 0.1362 | 0.1362 | 0.1362 | 0.2272 | 175.26 t+13580 rolls | 21 |
No: number.
According to Table 6, the weights values for each industry were calculated individually. For this purpose, the special vector developed, via the ranking values obtained from the Friedman test was inducted to the main criterion of Table 6 to compose the weights in the table's final column. Figure 3 shows the weightings values calculated for IPI individually.

Figure 3: Weights values for IPI individually.
According to the weights values obtained and displayed by the Table 6 and Figure 3 for IPI, a hierarchical cluster classification was developed as:
1>2>7>8>13>10>3>20>18>9>6>14>19>11>16=4>15>5>12>17> 21
The classification carried out on the basis of the present methodology was cleared that the obtained weight for industry of 11 is equal to industry of 4 and 16. However, with reference to actual data and a deeper assessment, it was found that the weight obtained for industry of 11 should be greater than this value and smaller than the weight obtained for industry of 19. In the next step, further assessment was conducted to identify the available facilities and equipment exploited in IPI. Table 7 encompasses all available facilities employed for IPI individually.
Table 7: All available facilities of IPI.
| Industry | Facilities |
|---|---|
| 1 | Extrusion machine, l/d=30 (1 No); Shaping unit, 1000 L (1 No); Compressor, 7 kg/cm2, 6.2 m3/min; Roller, 10 m/min (2 No); Thermal operation unit, 19 kW (1 No); Cooling unit (1 No); Automatic cutting unit, 5-7 kg/cm2 (1 No); Conveyor, W=2000 mm (1 No); Mixer 500 kg (1 No); Vacuum pump, 200 kg/h (2 No); Packaging machine (1 No); Lab (1 unit) |
| 2 | Extruder, d=120 mm (1 No); T frames unit, L=1700 mm (1 No); Rollers of d and L=350 and 1700 mm (1 No); Cooler roller (1 No); Heating and cooling unit with oil circulation (1 No); Circular knife to cut the edges (1 No); Rollers tensile machine (1 No); Collector machine equipped to engine and spool (1 No); Compressor, 100l/min (1 No); Packaging machine (1 No); Mixer, 500 kg (1 No); Pneumatic cutting machine (1 No); Melt flow meter (1 No) |
| 3 | Grinder machine equipped to washing machine (500 kg/h-automatic 40 Hp) (1 No); Conveyor system 2.5 m (1 No); Stainless steel washing chamber (2 m3) (1 No); Automatic dewatering machine (2 m3 stainless steel) (1 No); Drying machine equipped to flame and fan, 1 m3 stainless steel (1 No); Device to produce pellets (Twine, 100 kg/h); Storage cone (L=2 m) (1 No); Packaging machine, 5o kg packs (1 No) |
| 4 | Balance, 100 kg (2 No); Mixing tank of polyester resin, 100 kg (1 No); Resin additives mixer, 20 kg (1 No); Dye and material mixer tank, 8 kg, possesses a barrier and pneumatic mixer (1 No); Resin baking centrifuge machine, 16 kg (2 No); Glass cells for 6 different sizes (470 No); Automatic cutting machine (2 No); Shaping machine (8 No); Perforating machine (8 No); Button separator machine equipped to shaking motor (1 No); Final polishing machine possessing water jet (2 No); Counting and packing machine of buttons equipped to an electronic system (1 No) |
| 5 | Extruder, 50 kg, 15 kW (2 No); Temperature control cabin (2 No); Cooling tank, stainless steel (2 No); Tension machine, 1.5 kW, L=3 m (2 No); Twisting machine, 2.2 kW (1 No); Winding machine (1 No); Cutting machines (8 No); Mixing machine, 200 kg/h (1 No); Miller (100 kg/h); Weighing machine, 100 kg (1 No); Fitted lab (1 unit); Compressor, 300 L/h, 4 bar (2 No) |
| 6 | Extruder, 160 kg/h (1 No); Medo twister 10/12 (1 No); Multilayers making machine, model of Meromal 16.4 (1 No); Packaging machine of UM 20 (1 No); Mixer, 1 ton (1 No); Derrick, 6 sides and 1 ton (1 No); Balance, 500 kg (1 No); Lab facilities (1 unit); Air compressor, 1500 L/min, 10 Atm (1 No) |
| 7 | Silo for PVC powder, steel, 1000 kg (1 No); Silo for CaCO3, steel, 1000 kg (1 No); Steel tank of DOP, 500 kg (1 No); Liquid mixer, 1000 L (1 No); Oven, 160 , (1 No); Roller miller, w=2 m (1 No); Extruder, L/d=8-10 (1 No); Cylinders, w and d=2 m and 75 cm (1 No); Cooling rollers (12 No); Collector, Engine with constant torque (1 No); Printing machine, rotogravure (1 No); Padding (1 No); Compressor, 1250 L/min, 11 kW (1 No); Press machine (1 No); Balance (4 No); Separate rollers (16 No); Roller molds for tension removal using hot steam (15 No) |
| 8 | Tape-shaped air extruder (1 No); Small weaving and sewing machines (16 and 2 No); Print machine (1 No); Baling press (1 No); Cutting machine (1 No); Resistance measurement machine for fibers and yarns (1 No) |
| 9 | Plastic bags extruder, 22 kg/h (4 No); Packaging bag extruder, 45 kg/h (1 No); PP box extruder, 25 kg/h (1 No); Shopping bags extruder, 35 kg/h (2 No); Dyeing machine, 60 m/min (1 No); Sewing machine of various bags (6 No); Sewing machine of PP bags 500 kg/d (1 No); Sewing machine of packaging materials (3 No); Packaging table in size of 3 × 1.2 m (4 No) |
| 10 | Extruder, d=60-65 mm, 180 kg/h (2 No); Tension strips containing power of 10 hp (2 No); Cutting machine, 2.2 kW (2 No); Twisting machine, 10 Hp, 10 m/s (2 No); Injection machine, 240.7, d of cylinder=68 mm, 20 kg/h, 30 kW (2 No); Frames for various fittings (1 series); Mixer, 200 kg/h (2 No); Miller, power of 10 kg, 200 kg/h (1 No); Fitted lab and repair workshop (1 and 1 unit); Labelling machine (1 No) |
| 11 | Weighbridge, 2000 kg (1 No); Miller, 1000 kg/h, 22 kW (1 No); Mixer, 300 kg/h, 32.5 kW, 14-28 m/s (1 No); Granule maker machine, 300 kg/h, 73 kW (1 No); Pipe production line, 200-250 kg/h, d=40-250 mm (1 No); Injection machine, d=48 mm, injection pressure 1147 bar, maximum injected weight 242 g (1 No); Injection machine, d=50 mm, injection pressure, 1510 bar, maximum injected weight, 374 g (1 No); Molds (10 No); Fitted lab and repair workshop (1 and 1 unit) |
| 12 | Automatic and ordinary welding machine (1 and 2 No); Cutting machine (2 No); Assembling machine (1 No); Packaging table (1 No) |
| 13 | Molding machine (1 No); Plastic injection machine (1 No); Printing machine on plastic materials, capacity of 1 m/min (1 No); Materials supply equipment (1 No); Compressor 300 m3/h (1 No); Lab (1 Unit); Repairing place with devices and tools (1 unit) |
| 14 | Injection machine, 2 molds (2 No); Complete mill, 20 kW (1 No) |
| 15 | Mill, 300 kg (1 No); Frames (3 No); Mixer, 1.5 tons (1 No); Storage tank, 2.5 tons (1 No); Transmission pump, 2 inch (1 No); Injection machine (1 No) |
| 16 | Plastic injection machine, 100 g, 20 kW (2 No); Plastic injection machine, 250 g, 35 kW (2 No); Impact press, 15 tons (2 No); Springs producer machine, 20 No/min (1 No); Thread Machine, 6 No/min (1 No); Vacuum coating 40 No/min (1 No); Mill, 30 kg (1 No); Mixer, 50 kg (1 No); Higher dropper machines of L and LL, 50 and 75 kg (1 and 1 No); Molds of various cap, reflector, body, key and etc. (1 series); Jack and fixer (1 No) |
| 17 | Mixer, 5 m3, 38 kW (1 No); Cooler equipped to shell and pipes, A=49 m2 (1 No); Tube filling and capping machine, 1.1 kW (1 No); Cans and bottles filling machine, 1.1 kW (1 No); Capping machine, 1.1 kW (1 No); Labelling machine, 0.8 kW (1 No); Centrifuge pump, 1 kW (1 No); Pump reciprocating, 1 kW (1 No); Conveyor, L=8 m (1 No); Fitted lab and repair workshop (individually 1 unit) |
| 18 | Plastic injection machines of 5, 20 and 80 g (9 No); Grease addition machine (1 No); Packaging and assembling machine (1 No); Protective mold containing 12 holes (3 No); Cap molds, 24 holes (2 No); Surface mold containing 24 holes (2 No); Air compressors, 50 m3/min, 16 Atm (1 No); Fitted lab (1 unit); Handler mold, containing around 24 holes (2 No) |
| 19 | Extruder, 90 kg/h (1 No); Control panel, 0-200(1 No); Shaping unit, 40 m/min (1 No); Cutting and splitting unit, Cutting blade length of 120 cm (1 No); Screwing machine, 120 cm (1 No); Steel control panel (1 No); Air compressor, 300 l/min (1 No); Treatment machine, 1 ton (1 No) |
| 20 | Mixer, 2 tons (1 No); Strong mixer equipped to induction motor, stainless steel (1 No); Two rollers mill, d and L=610 and 1830 mm, 3 tons (2 No); Tension-extrude machine DC, 180 m/min (1 No); Conveyor, L=3 m (5 No); Cylinders, d and L=815 and 2290 mm (1 No); Cooler, L=2100 mm (1 No); Thickness measurement machine based on beta ray (1 No); Cutter (1 No); Motivation motor, DC (4 No); Control equipment (1 No); Repair workshop (1 No) |
| 21 | Beverage production line including blower extruder and cooling cutter (1 No); Tray production line including blower extruder and cooling miller (1 No); Complete production line of packaging tape includes: Extruded water bath, forming, stretching and winding (1 No); Frame (1 No); Plastic welding machine (1 No) |
D: diameter; L: length; w: width; DC: Direct current; No: Number.
DEA
DEA has been posed empirically for evaluation relative efficiency and inefficiency of various companies and industries etc., with regard to exist a dominant technology pertaining on efficiency level in exploiting inputs for generating outputs outlined. DEA gets back to a set of concepts and methodologies that are defined as (1) The Charnes-Cooper-Rhodes (CCR) ratio model: contains total efficiency and identifies sources and values of inefficiency by using two procedures such as (a) Estimating net technical efficiency by a determined measure of operations, (b) Identification of rising, falling, or fixed return on scale. (2) Coefficient models (3) Additive model and additive developed model. By the definition, efficiency of source (EKS) is calculated using eqn. (17). Eks is equal with weighted sum of outputs/weighted sum of inputs. By the way, Osy is the value of output y for source s; Vky is the weight assigned to source k for output y; Isx is the value for input x of source s; and Ukx is the weight assigned to source k for input x.
 (17)
(17)
Using DEA model to determine the efficiency values from a reference set of sources s, choosing the optimal weights associated with the input and output outcomes can be mentioned as the following. Optimal technical efficiency value is approximately equal to 1 and below the 1 represents the inefficiency of source. It has a worth to mention that our data are findings of financial and economical assessments conducted by IIO and IEPA once before establishment of each industry. Therefore, it is a bit difficult to run a DEA model to evaluate efficiency because of bereavement in data of a time interval. By the way, eqn. (18) is including a practice to calculate DEA model for existing data at Table 4 to manifest the limitations. Using eqn. (18) the symbols of I1, I2, I3, I4, I5 and I6 are initial feed, number of employees, power, water, fuel consumed and nominal capacity of industries respectively. It is very easy to figure out the efficiency of sources based on outlays and costs paid for inputs and outputs introduced and released from IPI. The most difficulty here is estimation of the outlays for input materials introduced into industries cycle according to variety in materials types and fluctuation in costs.
 (18)
(18)
Some studies offered that the number of Decision Making Units (DMUs) must be at least three times more than number of inputs and outputs integrated to employ DEA model, however many other studies discuss that this kind of rule cannot be assigned on DEA model statistically, because DEA is applied as a benchmarking model pertaining on the performance of DMU individually [16]. Using TOPSIS method, it is feasible to calculate the weights for I6 (Columns having same dimensions for amounts), and (I1, I2, I3, I4, I5) to figure out the DEA value by eqn. (18).
Ahmadi and Ahmadi [11] used DEA model to evaluate efficiency and inefficiency among 23 main Iranian industries during 2005-2007. Obtained results revealed that there are 3 major manufacturing industries and two provinces which are identified as the best performance in namely tobacco, transport equipment and coal coke products. Among 30 provinces, Bushehr and North Khorasan provinces were contained the utmost performance. Vahidi et al., [12] evaluated 140 different types of Iranian industries using DEA model to find the efficient units so it resulted to assign ranking among industries and determining efficient industries. Jahangoshai and Ghanbarpour [17] applied DEA model for about 59 Iranian manufacturing industries under 23 classes to determine the energy resources such as the amount of fossil fuel, water, electricity consumptions and number of employees. Findings manifested that efficiency scores and energy consumption performance are mostly variable in comparison with individual industry in its own group. Abri and Mahmoudzadeh [18] assigned DEA model among 23 Iranian manufacturing industries during 2002–2006 to assess the impact of information technology on productivity and efficiency. It was found that IT has a positive and statistically significant effect on the productivity of manufacturing industries. Mehdiabadi et al. [19] used DEA-TOPSIS among 15 various sectors of industries in order to rank efficient units. Therefore, findings recommended that around 8 efficient units, chemical industry could be considered as the most attracting industry for investment. Asayesh and Raad [20] employed DEA model to gas stations in order to evaluate the relative efficiency so results offered raking of gas station along with hierarchical classification. Azbari et al. [21] found that the latent variable had the highest correlation with supply chain performance. At around 12 of the 28 supply chains obtained 1 as the highest performance rate and the lowest observed performance was 0.81 via DEA procedure among Iranian Pharmaceutical Industry in a supply chain performance evaluation. Rahmani [22] used DEA model among Iranian industries to conduct a productivity analysis. It resulted to identify the means of about 38% as efficient and the remaining 68% were inefficient.
Statistical analysis results
The t-test analysis revealed a significant differences among parameters such as feed (No: number), initial feed (t), number of employees, power, water, fuel consumptions and land area used (pvalue ≤ 0.000 and 0.009) for 21 IPI. Keeping same parameters Pearson correlation analysis had manifested the highest correlation between both factors of land and water about 0.835. The ranks values were estimated approximately 2.98, 5.10, 3.69, 4.81, 2.55, 2.33 and 6.55 for feed, initial feed, number of employees, power, water, fuel consumptions and land area used from both Kendall's W and Friedman tests respectively. Also, it was obtained amounts about 64.859 along with difference value of 6 for Chi-square in the Friedman test analysis. The chi-squared test is used to estimate whether there is a significant difference between the expected frequencies and the observed frequencies in one or more categories as the data are independent. The Kolmogorov-Smirnov statistic quantifies a distance between the empirical distribution function of the sample and the cumulative distribution function of the reference distribution, or between the empirical distribution functions of two samples. Tables 8 and 9 denote Chi-Square test for criterion and one-Sample Kolmogorov-Smirnov test respectively (Appendix).
Table 8: Chi-Square test for criteria.
| Feed | Initial feed | Employee | Power | Water | Land | Fuel | |
|---|---|---|---|---|---|---|---|
| Chi-Square | 56.333a | 0.905b | 4.143c | 0.000d | 5.857e | 0.905b | 7.810f |
| df | 7 | 19 | 15 | 20 | 11 | 19 | 10 |
| Asymp. Sig. | 0.000 | 1 | 0.997 | 1.000 | 0.883 | 1 | 0.647 |
a8 cells (100%) have expected frequencies less than 5. The minimum expected cell frequency is 2.6; b20 cells (100%) have expected frequencies less than 5. The minimum expected cell frequency is 1.1; c16 cells (100%) have expected frequencies less than 5. The minimum expected cell frequency is 1.3; d21 cells (100%) have expected frequency less than 5. The minimum expected cell frequency is 1.0; e12 cells (100%) have expected frequencies less than 5. The minimum expected cell frequency is 1.8; f11 cells (100%) have expected frequencies less than 5. The minimum expected cell frequency is 1.9.
Table 9: One- Sample Kolmogorov -Smirnov test.
| Feed | Initial feed | Employee | Water | Fuel | Land | Power | ||
|---|---|---|---|---|---|---|---|---|
| N | 21 | 21 | 21 | 21 | 21 | 21 | 21 | |
| Normal parameters a, b | Mean | 645668.6667 | 532020053 | 37.9524 | 11.5714 | 17.5714 | 4677.1429 | 262.4762 |
| Std. deviation | 2151661.912 | 235424. 0319 | 19.99119 | 7.54037 | 28.05276 | 2760.28466 | 153.61205 | |
| Most extreme differences | Absolute | 0.388 | 0.508 | 0.178 | 0.158 | 0.388 | 0.189 | 0.119 |
| Positive | 0.388 | 0.508 | 0.178 | 0.158 | 0.388 | 0.189 | 0.119 | |
| Negative | -0.382 | -0.411 | -0.133 | -0.158 | -0.302 | -0.101 | -0.076 | |
| Kolmogorov-Smirnov Z | 1.778 | 2.328 | 0.818 | 0.725 | 1.779 | 0.866 | 0.544 | |
| Asymp. Sig. (2-tailed) | 0.004 | 0.000 | 0.516 | 0.669 | 0.004 | 0.442 | 0.929 |
aTest distribution is normal; bCalculated from data.
Null hypothesis test was represented that distribution of feed (No), initial feed (t) and land are same so related samples Friedman's two-way analysis of variance by ranks resulted the significance ratio around 0.007. Therefore, Null hypothesis was rejected. Using Null hypothesis the categories of employee, power, water and fuel occurred with equal probabilities (one sample Chi-Square test) with values around 0.997, 1, 0.883 and 0.647. Therefore Null hypothesis was retained. The distribution of feed, initial feed and land were obtained normal 0.004, 0.000 (Null hypothesis was rejected because both of obtained values were significant) and 0.442 (Null hypothesis was retained) via one-sample Kolmogorov-Smirnov test. Hassanpour [9] evaluated 6 different kinds of Iranian recycling industries depend on technical, financial and statistical analysis encompassing blown bitumen, plastic wastes, used motor oil and grease, oil filter, agricultural wastes recycling to cardboard and recycling silver of radiology films and its solution. Results offered a significant differences between power-water and fuel-land area used (pvalue ≤ 0.016 and 0.023) respectively. Hassanpour [10] found that both of the paired test and t-test analyzes presented a significant difference among factors of four main industrial and engineering brick manufacturing industries such as initial feed, employees, power, water, fuel and land area used (pvalue ≤ 0.001).
Conclusion
Many processing practices have been developed in order to produce and retrieve plastics based on available feedstock, energy resources and plastics applications. Applied technologies and total inventory of IPI can be compared with other plastic generation technologies in other countries with Iran. Statistical analysis tests represented correlation and significant differences among IPI. DEA can be used as a dominant practice to determine efficiency of industries individually.
Acknowledgement
This research was conducted as corresponding author Ph. D research work. I would like to extend my thanks to the managers and colleagues in Osmania University because of their help in offering and collecting the data and resources in running the program.
References
- Comaniţa ED, Ghinea C, Hlihor RM, Simion IM, Smaranda C, et al. (2015) Challenges and opportunities in green plastics: An assessment using the ELECTRE decision-aid method. Environ Eng Manag J 14: 689-702.
- Mattsson K, Hansson LA, Cedervall T (2015) Nano-plastics in the aquatic environment. Environ Sci: Processes Impacts 17: 1712-1721.
- Li HX, Getzinger GJ, Ferguson PL, Orihuela B, Zhu M, et al. (2016) Effects of toxic leachate from commercial plastics on larval survival and settlement of the barnacle Amphibalanus amphitrite. Environ Sci Technol 50: 924-931.
- Kofteci S, Ahmedzade P, Kultayev B (2014) Performance evaluation of bitumen modified by various types of waste Plastics. Constr Build Mater 73: 592-602.
- Zamani-Sabzi H, King JP, Gard CC, Abudu S (2016) Statistical and analytical comparison of multi- criteria decision-making techniques under fuzzy environment. Operations Research Perspectives 3: 92-117.
- Ghorabaee MK, Amiri M, Zavadskas EK, Antucheviciene J (2018) A new hybrid fuzzy MCDM approach for evaluation of construction equipment with sustainability considerations. Archives of Civil and Mechanical Engineering 18: 32-49.
- Jahangoshai RM, Ghanbarpour T (2016) Energy resources consumption performance in Iranian manufacturing industries using cost/revenue efficiency model. IJE Transactions C: Aspects 29: 1282-1291.
- Li X, Liu Y, Wang Y, Gao Z (2016) Evaluating transit operator efficiency: An enhanced DEA model with constrained fuzzy-AHP cones. Journal of Traffic and Transportation Engineering (English edition) 3: 215-225.
- Hassanpour M (2017) Evaluation of Iranian recycling industries. J Waste Recycling 2: 1-7.
- Hassanpour M (2018) Performance assessment of sewage treatment plant and sludge (Hyderabad, India) to make brick from released sludge. A Ph. D. project submitted to Osmania University.
- Ahmadi V, Ahmadi A (2012) Application of data envelopment analysis in manufacturing industries of Iran. Interdisciplinary Journal of Contemporary Research in Business 4: 534-544.
- Vahidi H, Hoveidi H, Kazemzadeh Khoie J (2016) Challenges and opportunities of industrial ecology development in Iran. Int J Environ Res 10: 217-226.
- Wittkowski KM (1998) Friedman-type statistics and consistent multiple comparisons for unbalanced designs with missing data. J Am Stat Assoc 83: 1163-1170.
- Shirazia F, Kazemipoor H, Tavakkoli-Moghaddam R (2017) Fuzzy decision analysis for project scope change management. Decision Science Letters 6: 395-406.
- Saaty TL (1980) The analytic hierarchy process. McGraw-Hill, New York.
- Sen P, Roy M, Pal P (2017) Evaluation of environmentally conscious manufacturing programs using a three-hybrid multi-criteria decision analysis method. Ecological Indicators 73: 264-273.
- Jahangoshai RM, Ghanbarpour T (2016) Energy resources consumption performance in Iranian manufacturing industries using cost/revenue efficiency model. IJE Transactions C: Aspects 29: 1282-1291.
- Abri AG, Mahmoudzadeh M (2015) Impact of information technology on productivity and efficiency in Iranian manufacturing industries. J Ind Eng Int 11: 143-157.
- Mehdiabadi A, Rohani A, Abdollahiyan SA (2013) Ranking industries using a hybrid of DEA-TOPSIS. Decision Science Letters 2: 251-256.
- Asayesh R, Raad ZF (2014) Evaluation of the relative efficiency of gas stations by data envelopment analysis. International Journal of Data Envelopment Analysis and *Operations Research 1: 12-15.
- Azbari ME, Olfat L, Amiri M, Soofi JB (2014) A network data envelopment analysis model for supply chain performance evaluation: Real case of Iranian pharmaceutical industry. International Journal of Industrial Engineering and Production Research 25: 125-137.
- Rahmani M (2017) A productivity analysis of Iranian industries using an additive data envelopment analysis. Management Science Letters 7: 197-204.


Open Access Journals
- Aquaculture & Veterinary Science
- Chemistry & Chemical Sciences
- Clinical Sciences
- Engineering
- General Science
- Genetics & Molecular Biology
- Health Care & Nursing
- Immunology & Microbiology
- Materials Science
- Mathematics & Physics
- Medical Sciences
- Neurology & Psychiatry
- Oncology & Cancer Science
- Pharmaceutical Sciences