Effect of Air Pollution on Hospital Admissions of Respiratory, Dermatological, Ophthalmic Diseases in a Coastal City, China
1Zhoushan Municipal Center for Disease Control and Prevention, 316021, PR China
2Center for Excellence in Regional Atmospheric Environment, Institute of Urban Environment, Chinese Academy of Sciences, Xiamen 361021, China
3Key Lab of Urban Environment and Health, Institute of Urban Environment, Chinese Academy of Sciences, Xiamen 361021, China
4University of Chinese Academy of Sciences, Beijing 100049, China
- *Corresponding Author:
- Hang Xiao
Institute of Urban Environment
Chinese Academy of Sciences
1799 Jimei Avenue, Xiamen
China 361021
Tel: +0574-86784813
E-mail: hxiao@iue.ac.cn
Received date: December 05, 2017; Accepted date: December 25, 2017; Published date: January 10, 2018
Citation: Zhang YL, Zhang H, Yi JP, Zhang JJ, Dai XR, et al. (2018) Effect of Air Pollution on Hospital Admissions of Respiratory, Dermatological, Ophthalmic Diseases in a Coastal City, China. Glob Environ Health Saf Vol.2 No.1: 2.
Abstract
Recent studies have shown associations between particulate matter and respiratory diseases for children in some heavy air pollution areas in China. However, few investigations have focused on the potential effects of chronic exposure to low-moderate levels on health symptoms among children. In this study, the effect of air quality on pediatric hospital admissions for respiratory disease, dermatological illness and ophthalmic diseases in Zhoushan were characterized by data from different lag structures, single-pollutant models and multi-pollutant models (Generalized additive model, GAM). Under lag0, a 36 μ g/m3 increased in PM10 and a 5 μ g/m3 increased in SO2 with associated with a 1.050% risk increased (95% confidence interval [CI] 1.037 to 1.064) and with a 1.030% increased (95% CI 1.016 to 1.044) in respiratory hospitalization, respectively. A positive association between SO2 with the increased risk of dermatological hospitalization was found: 1.139% (95% CI 0.977 to 1.328) at lag2. A detrimental effect was found at lag0 of ophthalmic illness with ambient air pollution. Seasonal differences were found for air pollution for pediatric respiratory and dermatology. This study indicates that air pollution has an impact on pediatric health, even in a high air quality area, we should control the concentrations strictly to prevent environmental health problem.
Keywords
Children's health; Hospital admission; Particulate matter; Zhoushan; Generalized additive model
Introduction
During the last two decades, numerous studies have documented that ambient air pollutants is related to asthma hospitalizations [1], chronic obstructive pulmonary disease (COPD) [2,3], lower respiratory infections [4,5] and some other respiratory illness [6-8] and cardiovascular diseases [9-11]. Many researchers pay their attention to the relationship between air pollutant and children's health [12-17]. Lin et al. [18] suggested a detrimental effect of relatively low levels of coarse particulate matter and NO2 on hospitalization for respiratory infections in children. Silverman et al. [15] investigated the associations between severe asthma morbidity and PM2.5 and ozone in the warm season, and revealed warm weather patterns of ozone and PM2.5 disproportionately affected children with asthma in New York. Ostro et al. [19] observed associations between several components (like EC, OC) of PM2.5 and respiratory admissions for children under 19 years of age. Hua et al. [20] found PM2.5 and the BC were significantly associated with childhood asthma visits in single-pollution model in Shanghai. Mehta et al. [12] assessed the effects of exposure to air pollution on hospitalization for acute lower respiratory infection among children in Ho Chi Minh City and found the increased of NO2 and SO2 were associated with increased admissions in the dry season. Chinese experts has investigated the health effect in Beijing [21], Shanghai [20], Lanzhou [22], but only few studies focused on children's health.
The main adverse effects of atmospheric pollutants are: ophthalmic illness, skin injuries, cardiovascular diseases and respiratory illness and lung cancer [23]. Children are vulnerable to outdoor air pollutants on health because their respiratory tract may be sensitive to the stimulation of pollutants. More time to stay outside lead to a long time of exposure that may cause their uncomfortable on eyes [24-26]. In this report, we not only examined the relationship between air pollutants and respiratory, but also tried to find some association between air pollutants and dermatological illness and ophthalmological disease using the statistical methods.
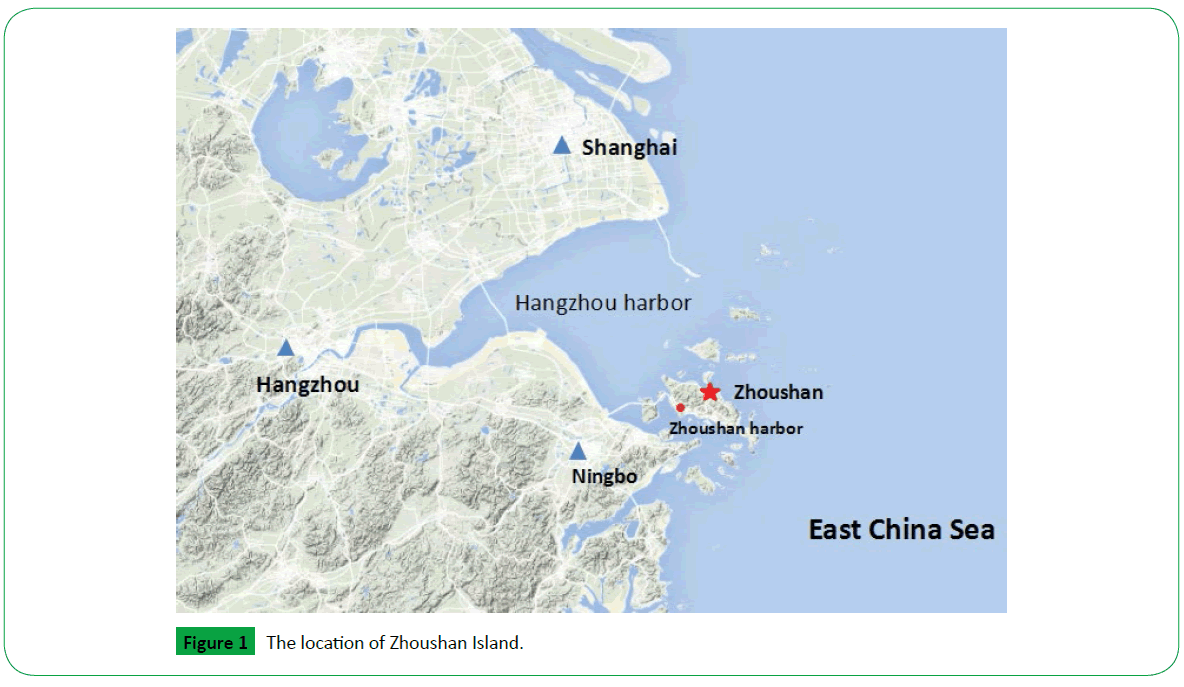
Many researchers have studied the effect of air quality in heavy polluted area or megacities on Children’s health [3,20,27,28]. However, the health effect on Children who exposed to lowmoderate levels of particulate matter and gaseous pollutants is still lack of consideration. We chose Zhoushan as our study area. It is located in East China Sea, about 140 kilometers away from Shanghai and 58 kilometers away from Ningbo (Figure 1). The mean of PM10, PM2.5, SO2, NO2 and O3 in Zhoushan was 54 μ g/m3, 31 μ g/m3, 6 μ g/m3, 23 μ g/m3, 91 μ g/m3, respectively. Some researches showed that the respiratory health damage threshold of the PM2.5 concentration was mainly within the range of 20-60 μ g/m3, and the adverse effect of excessively high PM2.5 concentration maintained a stable level [29]. So taking Zhoushan as a study area is meaningful and it also can be a contrast case to other Chinese cities.
Materials and Methods
Study area
Zhoushan, has a population of 1.13 million by the end of 2010, which composed of 1400 islands, with a total area of 220 km2. Annual average temperature of Zhoushan is about 16°C, and rainfall is ranged from 927 ml to 1,620 ml every year. It has a subtropical oceanic monsoon climate, with a mildly winter and moderate summer. The harbor is the main anthropogenic source of pollution. Influenced by the strong wind and superior surroundings, the Zhoushan air quality ranked top in China.
Health and environmental data observation: The primary emergency diagnoses were recorded according to the International Classification of Disease 10th Revision (ICD-10) (World Health Organization) by Zhoushan Center for Diseases Control and Prevention from January 1, 2014, to December 31, 2015 (Table 1). Diseases include respiratory illness, dermatology illness and ophthalmic illness.
| Air pollutants levels | N | Mean | SD | Min | Max | IQR | |
|---|---|---|---|---|---|---|---|
| PM10 (μ g/m3) | All year | 730 | 53.4 | 34.1 | 7 | 256 | 36 |
| Dry | 181 | 70.5 | 40.4 | 13 | 256 | 49 | |
| Wet | 368 | 42.3 | 23.7 | 10 | 93 | 24 | |
| PM2.5 (μ g/m3) | All year | 730 | 31.3 | 21.8 | 3 | 163 | 22 |
| Dry | 181 | 40.4 | 26.2 | 6 | 163 | 29 | |
| Wet | 368 | 24.9 | 14 | 3 | 93 | 16 | |
| SO2 (μ g/m3) | All year | 730 | 6.1 | 4.2 | 2 | 42 | 5 |
| Dry | 181 | 6.3 | 4.1 | 3 | 23 | 5 | |
| Wet | 368 | 5.8 | 3 | 3 | 19 | 5 | |
| NO2 (μ g/m3) | All year | 730 | 23 | 13 | 2 | 42 | 15 |
| Dry | 181 | 28.7 | 15.3 | 2 | 100 | 20 | |
| Wet | 368 | 18.9 | 9.7 | 3 | 63 | 12 | |
| O3 (μ g/m3) | All year | 728 | 92.2 | 31.9 | 2 | 231 | 38.8 |
| Dry | 181 | 84.8 | 25.6 | 22 | 171 | 34 | |
| Wet | 367 | 100.9 | 35 | 18 | 231 | 37 | |
| Meteorological data | |||||||
| Temperature (°C) | All year | 730 | 17.1 | 7.5 | 0.1 | 30.4 | |
| Dry | 181 | 10.6 | 4.8 | 0.1 | 22.5 | ||
| Wet | 368 | 23.3 | 3.4 | 14.5 | 30.4 | ||
| Relative humidity (%) | All year | 730 | 80.2 | 12.2 | 35.9 | 194 | |
| Dry | 181 | 73.8 | 12.8 | 35.9 | 98 | ||
| Wet | 368 | 83.4 | 8.7 | 50.9 | 99.3 | ||
| Sea level Pressure (Pa) | All year | 730 | 1016.6 | 8.7 | 983.2 | 1035.7 | |
| Dry | 181 | 1023.1 | 6.3 | 1002.8 | 1034.7 | ||
| Wet | 368 | 1010.2 | 5.8 | 983.2 | 1028.3 | ||
| Daily admissions | Total | 730 | 2863 | 879 | 355 | 4438 | |
| Pediatric Clinic | 730 | 238.7 | 260.7 | 57 | 1505 | ||
| Respiratory | 730 | 52.9 | 51 | 7 | 140 | ||
| Dermatology | 730 | 1 | 1.5 | 0 | 11 | ||
| Ophthalmology | 730 | 0.2 | 0.6 | 0 | 7 | ||
Table 1: Descriptive statistics on air pollutants, daily hospital admissions, meteorological factors in Zhoushan, 2014 to 2015.
Air pollution data, including hourly concentrations of sulfur dioxide (SO2), nitrogen dioxide (NO2), particulate matter with aerodynamic diameter less than 10 μ m (PM10), particulate matter with aerodynamic diameter less than 2.5 μ m (PM2.5), and ozone (O3) were acquired by a real-time air quality monitoring station located in Linchen district (122.20E, 29.98N). The Linchen district monitoring station was fully automated and provided hourly readings of SO2, NO2, PM10, PM2.5 and O3. Particulate matters were measured in μ g/m3 while gas pollutants were measured in μ g/m3.
Meteorological data were obtained from NOAA climate government. The daily weather data were measured at Linchen district during the inspection period, including temperature, relative humidity and sea level pressure.
Statistical analysis: The quality of data was checked. First, we set a domain between 0 and 500 to exclude outliers. Then interpolate to fill the null in the air pollution data and meteorological data. Final daily average concentrations (DAC) of SO2, NO2, PM10, PM2.5 and O3 were calculated from hourly observations. The following statistical analysis was all based on DAC. A correlation analysis was performed to identify the relationship among each variable (Table 2), including PM10, PM2.5, SO2, NO2, O3, temperature (temp°, relative humidity (RH) and sea level pressure (slp). A singlepollutant model was built, the effect of metrological factor such as temp, RH, slp and time; and day of week including weekday and workday were entered to the model as a confounding factor using smooth function to calculate the effect of one pollutant on number of hospitalizations. We used lag structures (from a lag of 0 day corresponding to the current day (L0) to a lag of 6 day corresponding to the previous day concentration (L6)) to estimate the lag effect of disease. The multi-pollutant models were built as the same way, only one different was bringing all pollutants into the model at the same time.
| PM10 | PM2.5 | SO2 | NO2 | O3 | |
|---|---|---|---|---|---|
| PM2.5 | 0.906** | ||||
| SO2 | 0.640** | 0.615** | |||
| NO2 | 0.639** | 0.609** | 0.485** | ||
| O3 | 0.119** | 0.126** | 0.101** | -0.109** | |
| Temp | -0.393** | -0.326** | -0.166** | -0.238** | 0.218** |
| RH | -0.492** | -0.327** | -0.405** | -0.206** | -0.116** |
| Slp | 0.400** | 0.304** | 0.225** | 0.196** | -0.168** |
Table 2: Pearson correlation coefficients between environmental variables in Zhoushan. **Correlation is significant at the 0.01 level.
The distribution of respiratory disease was followed by Poisson distribution, while dermatological illness and ophthalmic disease were followed by negative binomial distribution. Generalized additive model (GAM) was used with log link to compute the effects of air pollution on daily hospital admission.
Log[E(Yi)]=β0+β1 × Xi+S(time, df)+S(Zk, df)+DOW (1)
Where Y refers to the number of children daily hospital admission; E(Y) represents the expected number of children hospital admissions at day i; Xi represents the air pollutant concentration at day i; Zk indicates meteorological factors, which can be temperature, relative humidity, etc; S means smooth functions and df means the degree of freedom, df was not limited and the function gave an optimal value; DOW is a dummy variable for day of the week.
General calculations were performed in SPSS. GAM models were developed using R statistical software with ”mgcv” package and the results were expressed as the percent change in daily hospital admissions for IQR change in pollutant concentration.
Results
A total of 2,089,722 hospital visits were recorded for the analysis in Zhoushan hospital from January 1, 2014 to December 31, 2015. There were 174,248 pediatric cases, of which 22.17% was respiratory causes, 0.43% was dermatological causes and 0.06% was ophthalmic causes. The calculation of air pollutants, meteorological factors, and hospital visits were summarized in Table 1. The correlation matrix among five pollutants and meteorological factors were showed in Table 2. PM10 was highly correlated with PM2.5 (correlation coefficient r=0.906) and moderately correlated with SO2 (r=0.64) and NO2 (r=0.639). O3 was lowly correlated with PM10 (r=0.119), PM2.5 (r=0.126), SO2 (r=0.101) and NO2(r=–0.109).
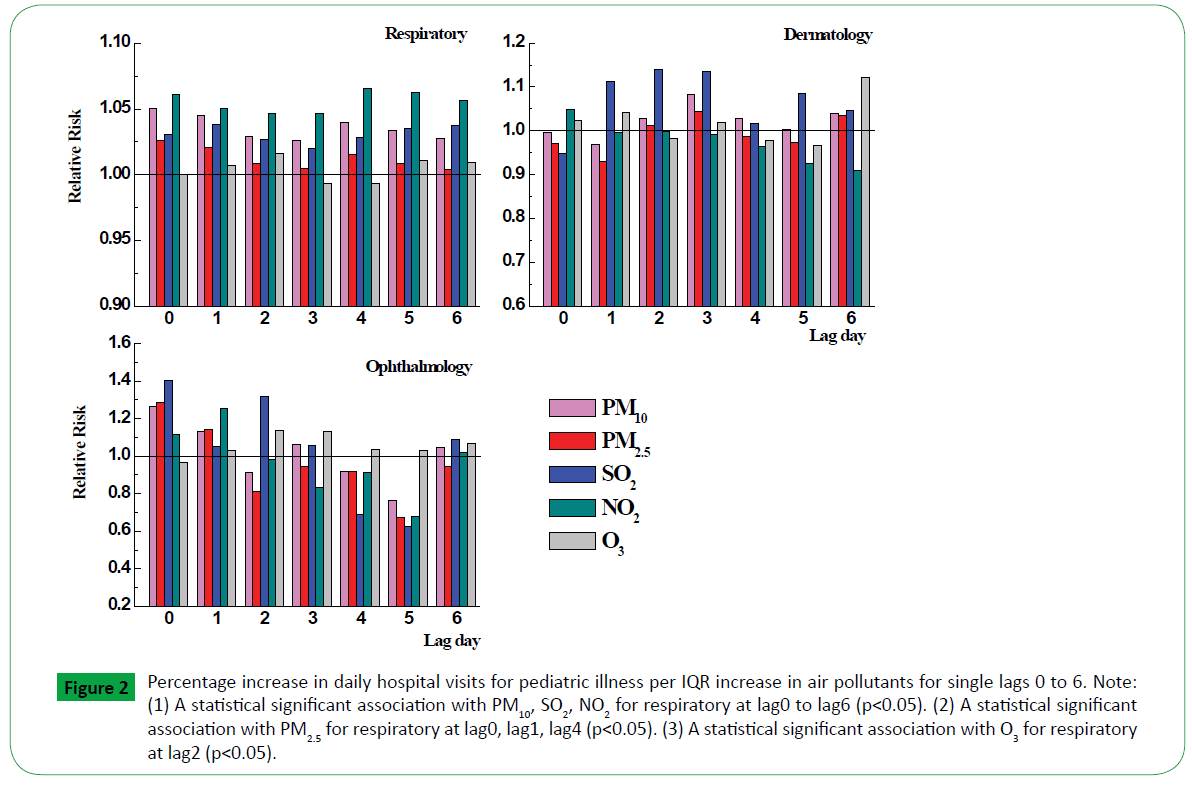
Figure 2 showed the results from single-pollutant for respiratory, dermatology and ophthalmology at different time lags. The concentrations of PM10, NO2 affected the hospitalization risk consistently for respiratory diseases strongly for the single lags from 0 to 6 with the peak value 1.050 (95% CI, 1.037, 1.064) at lag0 and 1.065 (95% CI, 1.052, 1.079) at lag4, respectively. The RR of SO2, PM2.5 and O3 were reached high at lag1 (RR=1.038, 95% CI, 1.025, 1.052), lag0 (RR=1.026, 95% CI, 1.014, 1.037) and lag2 (RR=1.0159, 95% CI, 1.001, 1.030), respectively. NO2 as the biggest factor which influenced the children respiratory visits was decreased from lag0 to lag3, then climbing a peak value at lag4. It showed that NO2 has a lag effect. There was obvious relationship between SO2 and dermatological illness with relative risk 1.112 (95% CI, 0.949, 1.302) at lag1, 1.139 (95% CI, 0.977, 1.328) at lag2 and 1.134 (95% CI, 0.974, 1.321) at lag3. For ophthalmic disease, the RR of PM10, PM2.5, SO2, NO2 remain a high value at lag0 with 1.261 (95% CI, 0.828, 1.922), 1.283 (95% CI, 0.899, 1.829), 1.401 (95% CI, 0.885, 2.220), 1.117 (95% CI, 0.718, 1.738), respectively.
Figure 2: Percentage increase in daily hospital visits for pediatric illness per IQR increase in air pollutants for single lags 0 to 6. Note: (1) A statistical significant association with PM10, SO2, NO2 for respiratory at lag0 to lag6 (p< 0.05). (2) A statistical significant association with PM2.5 for respiratory at lag0, lag1, lag4 (p< 0.05). (3) A statistical significant association with O3 for respiratory at lag2 (p< 0.05).
To test whether any pollutant effects were dependent on season, an analysis of different pediatric illness at lag0 were separated into a wet season of May to October, and a dry season of November to April in Figure 3. Because the number of ophthalmic hospitalization visits was zero at most, the seasonal difference of relative risk was not estimated. As it is presented, the RR of PM10 and PM2.5 for respiratory in dry season were higher than in wet season, while SO2 and O3 were opposite. For pediatric dermatology, PM2.5, SO2 and NO2 have greater effect in wet season than in dry season.
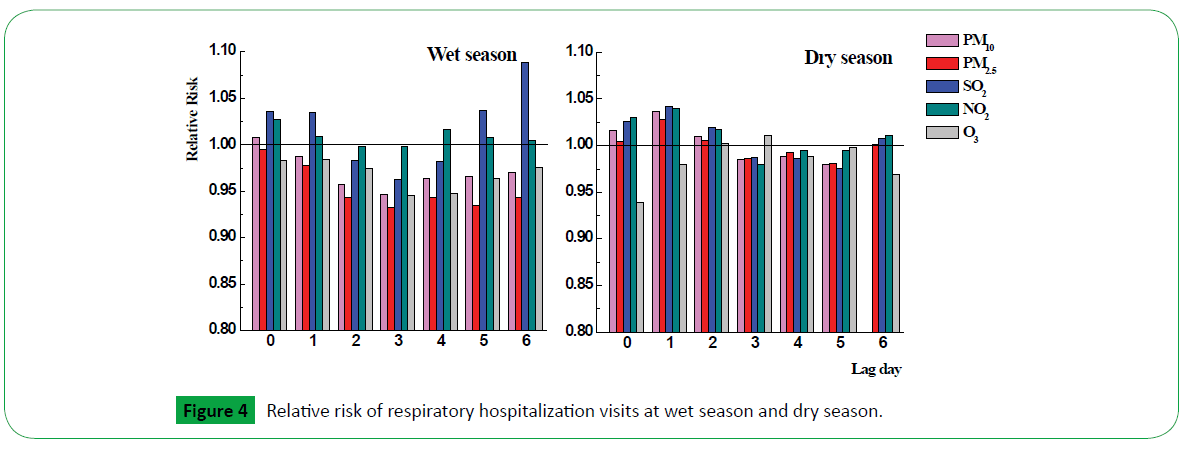
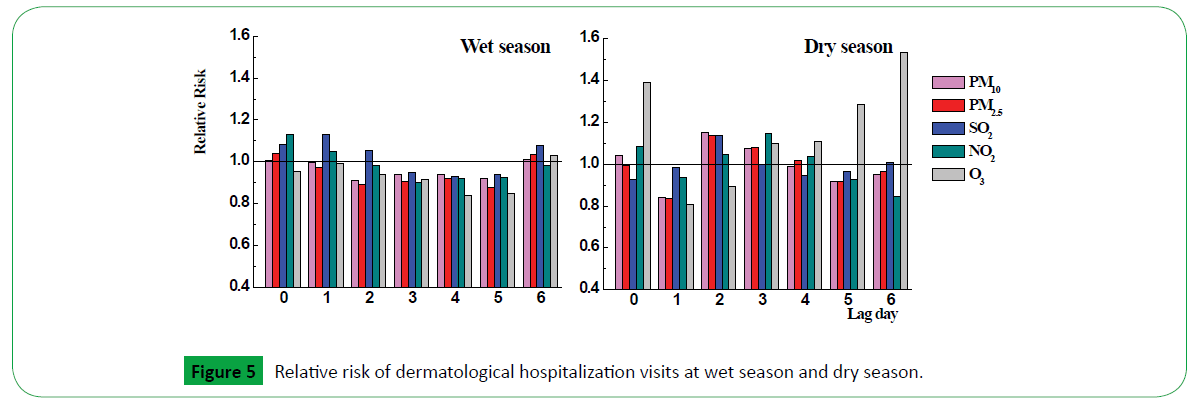
Considering the seasonal differences, we estimated the RR in different season using lag structure in Figures 4 and 5. Relative risk with pediatric respiratory illness in wet season and dry season were showed in Figure 5. SO2 showed mainly effect on hospital admission at lag6 (1.089, 95% CI, 1.052 to 1.027) in wet season, while PM10, PM2.5, SO2, NO2 showed weak effects at lag0, lag1 and lag2. In dry season, both pollutants have effect on respiratory illness for children at lag0, lag1 and lag2, especially at lag1, the relative risk of PM10, PM2.5, SO2, NO2 was 1.036 (95% CI, 1.005, 1.068), 1.028 (95% CI, 1.001, 1.056), 1.041 (95% CI, 1.010, 1.073) and 1.039 (95% CI, 1.002, 1.078), respectively.
O3 presented strongly effect for dermatological disease at lag0, lag5 and lag6 in dry season with relative risk increased was 1.39 (95%CI, 0.701 to 2.758), 1.285 (95% CI, 0.663 to 2.484), 1.53 (95% CI, 0.774 to 3.039), respectively. NO2 and SO2 have some associations with pediatric dermatological disease at lag0 (1.128, 95% CI, 0.892 to 1.426) and lag1 (1.129, 95%CI, 0.732 to 1.739), respectively.
Results from GAM model with all pollutants to estimate the association for different illness at different lags (0 to 2) were presented in Table 3. The RR of PM10 was increased in multipollutant model for respiratory which means the adverse effect of PM10 was a slightly enhanced among air pollutants. SO2 were increased among air pollutants while PM2.5 was decreased for dermatological illness. PM10, NO2, SO2, O3 were raised at lag2 among air pollutants for ophthalmic disease.
| lag=0 | lag=1 | lag=2 | ||
|---|---|---|---|---|
| Respiratory | PM10 | ↑ 1.12*** | ↑ 1.11*** | ↑ 1.08*** |
| (1.07–1.15) | (1.07–1.14) | (1.047–1.114) | ||
| PM2.5 | ↓ 0.92*** | ↓ 0.91*** | ↓ 0.91*** | |
| (0.89–0.95) | (0.88–0.94) | (0.88–0.93) | ||
| SO2 | ↓ 0.99 | ↓ 1.008 | ↓ 1.01 | |
| (0.97–1.01) | (0.988–1.028) | (0.99–1.03) | ||
| NO2 | ↓ 1.05*** | ↓ 1.04*** | ↑ 1.05*** | |
| (1.03–1.06) | (1.02–1.057) | (1.03–1.07) | ||
| O3 | ↓ 0.997 | ↓ 1.003 | ↑ 1.02*** | |
| (0.99–1.01) | (0.987–1.019) | (1.006–1.038) | ||
| Dermatology | PM10 | ↑ 1.07 | ↑ 1.06 | ↑ 1.04 |
| (0.75–1.54) | (0.75–1.49) | (0.74–1.45) | ||
| PM2.5 | ↓ 0.9 | ↓ 0.75* | ↓ 0.92 | |
| (0.66–1.22) | (0.56–1.02) | (0.68–1.22) | ||
| SO2 | ↓ 0.905 | ↑ 1.28** | ↑ 1.24** | |
| (0.71–1.14) | (1.02–1.59) | (1.0–1.53) | ||
| NO2 | ↑ 1.12 | ↑ 1.01 | ↓ 0.93 | |
| (0.92–1.36) | (0.83–1.21) | (0.78–1.12) | ||
| O3 | ↑ 1.07 | ↑ 1.06 | ↓ 0.95 | |
| (0.906–1.26) | (0.9–1.25) | (0.81–1.12) | ||
| Ophthalmology | PM10 | ↓ 1.12 | ↓ 0.94 | ↑ 1.002 |
| (0.55–2.29) | (0.46–1.93) | (0.47–2.12) | ||
| PM2.5 | ↓ 1.18 | →1.14 | ↓ 0.54* | |
| (0.66–2.13) | (0.63–2.04) | (0.27–1.05) | ||
| SO2 | ↓ 1.15 | ↓ 0.84 | ↑ 1.84 | |
| (0.68–1.93) | (0.48–1.49) | (1.07–3.19) | ||
| NO2 | ↓ 0.94 | ↑ 1.29 | ↑ 1.02 | |
| (0.57–1.56) | (0.78–2.12) | (0.61–1.7) | ||
| O3 | ↓ 0.84 | ↑ 1.05 | ↑ 1.23 | |
| (0.56–1.24) | (0.71–1.56) | (0.82–1.86) | ||
Table 3: Percentage increase in daily hospital admissions and 95% CIs associated with IQR increase in air pollutants in multi-pollutant models (***p< 0.01, **p< 0.05, *p< 0.01).
Discussion
In this study, we analyzed the effects of air pollutants on hospital admissions for respiratory disease, dermatological disease and ophthalmic disease for children from January 1, 2014 to December 31, 2015 in Zhoushan.
PM10 and PM2.5 showed robust associations with respiratory illness for children in this study. For PM10, there were consistent averse effect from lag0 to lag6 and the highest relative risk was 1.050% with the increment of 36 μ g/m3 at lag0, which was in line with Lin et al. [18], who showed that the corresponding OR for PM10 with an increment of 12.5 μ g/m3 for respiratory infection was 1.25% in boys in children. However, Zhang et al. [7] carried out an analysis on ambient air pollutants and daily number of outpatient visits for otolaryngology during 2011 to 2013 and showed there was no obvious relationship between PM10 concentration changes and the number of outpatient visits. The incompatible results might be explained by: 1) different groups. Children were not able to avoid the particulate matters to get into their respiratory tract; 2) different components [19]. A higher proportion of sea salt might exist in the particulate matters in the studied area since it is a coastal city composed by many islands, and chronic exposure to sea salt PM may affect the vulnerable respiratory tract of children. For PM2.5, the statistically significant was found at lag0, lag1 and lag4, and the effect reached the highest at lag0 with relative risk 1.026% for per 22 μ g/m3. Furthermore, many researches showed the detrimental association between PM2.5 and respiratory diseases at different ages [2,29], which are in line with our research.
For gaseous pollutants, both NO2 and SO2 have consistently positive association with respiratory from lag0 to lag6, with the highest relative risk 1.065% for 15 μ g/m3 at lag4 and 1.016% for 5 μ g/m3 at lag1, respectively. López-Villarrubia et al. [2] presented NO2 showed mainly its effect on hospital admission for all respiratory diseases in S/C de Tenerife. Tao et al. [22] showed that total respiratory disease hospitalization was increased by the increases of SO2, NO2 in Lanzhou, China. Several previous studies have linked respiratory infection to NO2, SO2, which had similar results with our study. The statistical significant effect of O3 concentration was only found at lag2 with the relative risk 1.016%, which was in line with Middleton et al. [9]. The RR value for O3 effect on respiratory from our study were not able to compare with other studies due to the different measuring technologies of risk.
In multi-pollutant models, we estimated the association between all air pollutants and daily hospital respiratory admission for children from lag0 to lag2. Contrasting with the single-pollutant model, the adverse effect of PM10 was increased while NO2 was decreased. We also estimated the association between dermatological diseases and air pollutants, and between ophthalmic diseases and air pollutants. We observed statistical significant association on dermatological disease with SO2 at lag1 and lag2 in multi-pollutant model. It demonstrated that other pollutants may stimulate the adverse effect of SO2 on dermatological disease at lag days. This result was contributed to that it took some time for SO2 to act on surface skin under the other air pollutants. We found no statistical significant on ophthalmic disease in multi-pollutant model.
Conclusion
Our study revealed a detrimental effect of low to moderate levels of air particulate matter and gaseous pollutants on hospital admissions for respiratory infection, dermatological disease and ophthalmic illness of children in Zhoushan area. We observed the consistent adverse effect with PM10 on respiratory disease from lag0 to lag6 and the higher RR were at lag0 and lag4. PM2.5 had statistical significant association on respiratory at lag0, lag1 and lag4. Both SO2 and NO2 had statistical significant relationship with respiratory disease, while O3 showed significant relationship only at lag2. We identified the season effect of association between air pollutant and children respiratory disease and dermatological illness and found the RR of PM10 and PM2.5 for respiratory in dry season were higher than in wet season, while for pediatric dermatology, PM2.5, SO2 and NO2 have greater effect in wet season than in dry season. We examined the relationship between particulate matter, gaseous pollutants and dermatological diseases, ophthalmic diseases, but in this article, we only found the robust relationship between them but no statistical significant. In multi-pollutant models, particulate matter and NO2 had a great influence on respiratory. SO2 is a factor that influenced the increased hospital admissions of dermatological disease when all pollutants were taken into account. Our study provides evidences to policy maker the importance of inducing the air pollution level.
Acknowledgements
We thank the Zhoushan Bureau of Sciences and Technology for funding (No. 2014C31074).
References
- Fan J, Li S, Fan C, Bai Z, Yang K (2016) The impact of PM2.5 on asthma emergency department visits: a systematic review and meta-analysis. Environmental Science and Pollution Research 23: 843-850.
- López VE, Iñiguez C, Costa O, Ballester F (2015) Acute effects of urban air pollution on respiratory emergency hospital admissions in the Canary Islands. Air Quality, Atmosphere and Health 1-10.
- Fusco D, Forastiere F, Michelozzi P, Spadea T, Ostro B, et al. (2001) Air pollution and hospital admissions for respiratory conditions in Rome, Italy. European Respiratory Journal 17: 1143-1150.
- Giovannini M, Sala M, Riva E, Radaelli G (2010) Hospital admissions for respiratory conditions in children and outdoor air pollution in Southwest Milan, Italy. Acta Paediatrica 99: 1180-1185.
- Smith KR, Samet JM, Romieu I, Bruce N (2000) Indoor air pollution in developing countries and acute lower respiratory infections in children. Thorax 55: 518-532.
- Tramuto F, Cusimano R, Cerame G, Vultaggio M, Calamusa G, et al. (2011) Urban air pollution and emergency room admissions for respiratory symptoms: a case-crossover study in Palermo, Italy. Environmental Health 10: 1.
- Zhang F, Xu J, Zhang Z, Meng H, Wang L, et al. (2015) Ambient air quality and the effects of air pollutants on otolaryngology in Beijing. Environmental Monitoring and Assessment 187: 1-9.
- Peel JL, Tolbert PE, Klein M, Metzger KB, Flanders WD, et al. (2005) Ambient air pollution and respiratory emergency department visits. Epidemiology 16: 164-174.
- Middleton N, Yiallouros P, Kleanthous S, Kolokotroni O, Schwartz J, et al. (2008) A 10-year time-series analysis of respiratory and cardiovascular morbidity in Nicosia, Cyprus: the effect of short-term changes in air pollution and dust storms. Environmental Health 7: 1.
- Carlsen HK, Forsberg B, Meister K, Gíslason T, Oudin A (2013) Ozone is associated with cardiopulmonary and stroke emergency hospital visits in Reykjavík, Iceland 2003-2009. Environmental Health 12: 1.
- Dominici F, Peng RD, Bell ML, Pham L, McDermott A, et al. (2006) Fine particulate air pollution and hospital admission for cardiovascular and respiratory diseases.JAMA 295: 1127-1134.
- Mehta S, Ngo LH, Cohen A, Thach TQ, Dan VX, et al. (2013) Air pollution and admissions for acute lower respiratory infections in young children of Ho Chi Minh City.Air Quality, Atmosphere and Health 6: 167-179.
- Villeneuve PJ, Chen L, Rowe BH, Coates F (2007) Outdoor air pollution and emergency department visits for asthma among children and adults: a case-crossover study in northern Alberta, Canada. Environmental Health 6: 1.
- Lin M, Chen Y, Burnett RT, Villeneuve PJ, Krewski D (2002) The influence of ambient coarse particulate matter on asthma hospitalization in children: case-crossover and time-series analyses. Environmental Health Perspectives 110: 575.
- Silverman RA, Ito K (2010) Age-related association of fine particles and ozone with severe acute asthma in New York City.Journal of Allergy and Clinical Immunology 125: 367-373.
- Ribeiro H, Cardoso MRA (2003) Air pollution and children's health in São Paulo (1986-1998). Social Science and Medicine 57: 2013-2022.
- Schwartz J (2004) Air pollution and children’s health. Pediatrics 113: 1037-1043.
- Lin M, Stieb DM, Chen Y (2005) Coarse particulate matter and hospitalization for respiratory infections in children younger than 15 years in Toronto: a case-crossover analysis. Pediatrics 116: 235-240.
- Ostro B, Roth L, Malig B, Marty M (2009) The effects of fine particle components on respiratory hospital admissions in children. Environmental Health Perspectives 117: 475.
- Hua J, Yin Y, Peng L, Du L, Geng F, et al. (2014) Acute effects of black carbon and PM2.5 on children asthma admissions: A time-series study in a Chinese city. Science of the Total Environment 481: 433-438.
- Zhang M, Song Y, Cai X (2007) A health-based assessment of particulate air pollution in urban areas of Beijing in 2000-2004. Science of the total environment 376: 100-108.
- Tao Y, Mi S, Zhou S, Wang S, Xie X (2014) Air pollution and hospital admissions for respiratory diseases in Lanzhou, China. Environmental pollution 185: 196-201.
- Tie X, Wu D, Brasseur G (2009) Lung cancer mortality and exposure to atmospheric aerosol particles in Guangzhou, China.Atmospheric Environment 43: 2375-2377.
- Saxena R, Srivastava S, Trivedi D, Anand E, Joshi S, et al. (2003) Impact of environmental pollution on the eye. Acta Ophthalmol Scand 81: 491-494.
- Gupta SK, Gupta V, Joshi S, Tandon R (2002) Subclinically dry eyes in urban Delhi: an impact of air pollution. Ophthalmologica 216: 368-371.
- Bourcier T, Viboud C, Cohen JC, Thomas F, Bury T, et al. (2003) Effects of air pollution and climatic conditions on the frequency of ophthalmological emergency examinations. British Journal of Ophthalmology 87: 809-811.
- Zhang Z, Wang J, Chen L, Chen X, Sun G, et al. W (2014) Impact of haze and air pollution-related hazards on hospital admissions in Guangzhou, China. Environmental Science and Pollution Research 21: 4236-4244.
- Gao Y, Guo X, Li C, Ding H, Tang L, et al. (2015) Characteristics of PM2.5 in Miyun, the northeastern suburb of Beijing: chemical composition and evaluation of health risk. Environmental Science and Pollution Research 22: 16688-16699.
- Li P, Xin J, Wang Y, Wang S, Li G, et al. (2013) The acute effects of fine particles on respiratory mortality and morbidity in Beijing, 2004-2009. Environmental Science and Pollution Research 20: 6433-6444.
Open Access Journals
- Aquaculture & Veterinary Science
- Chemistry & Chemical Sciences
- Clinical Sciences
- Engineering
- General Science
- Genetics & Molecular Biology
- Health Care & Nursing
- Immunology & Microbiology
- Materials Science
- Mathematics & Physics
- Medical Sciences
- Neurology & Psychiatry
- Oncology & Cancer Science
- Pharmaceutical Sciences
