ISSN : 2348-1927
Annals of Biological Sciences
Dulaglutide Improves Aluminum Chloride Induced Cognitive Dysfunction Diabetes Associated Alzheimer's Rat Model
Vkk Mandlem1*, Vazra Sravani Ka1, GSN Koteswara Rao2, Ravi Mannec3, Ramoji Kosurud4
1Department of Pharmacology, University of CMR College of Pharmacy, Hyderabad, India
2Department of Pharmacology, University of Koneru Lakshmaiah Education Foundation, Vaddeswaram, Guntur, AP, India
3Department of QA and QC, University of Chemtex Inc, Texas, USA.
4Department of Pharmaceutical Engineering, University of IIT BHU, Varanasi, India
- *Corresponding Author:
- Vkk Mandlem,
Department of Pharmacology,
University of CMR College of Pharmacy, Hyderabad,
India,
Tel: 9247896044;
E-mail: arunakiran4u@gmail.com
Received date: February 27, 2023, Manuscript No. ABS-22-12513; Editor assigned date: March 01, 2023, PreQC No. ABS-22-12513 (PQ); Reviewed date: March 10, 2023, QC No. ABS-22-12513; Revised date: March 20, 2023, Manuscript No. ABS-22-12513 (R); Published date: March 27, 2023, DOI: 10.36648/2348-1927.11.2.7
Citation: Mandlem Vkk, Sravani Ka V, Koteswara Rao GSN, Mannec R, Kosurud R (2022) Dulaglutide Improves Aluminum Chloride Induced Cognitive Dysfunction in Diabetes Associated Alzheimer’s Rat Model. Ann Bio Sci Vol:11 No:2
Abstract
Background: Type-2 diabetes is an etiological factor for Alzheimer’s. GLP-1 analogues were prescribed in treating type-2 diabetes mellitus, where the presence of GLP-1 receptors in brain also makes it a potential target for Alzheimer’s disease.
Aim: The aim of the study is to evaluate the neuroprotective effect of dulaglutide in aluminum chloride induced cognitive dysfunction in type-2 diabetes associated Alzheimer’s experimental rats by conducting behavioral studies, estimating the biochemical parameters and histopathological changes involved in the pathogenesis of the disease.
Objective: To evaluate the effect of GLP-1 analogue on learning and memory in Aluminum chloride induced Alzheimer’s disease in type-2 diabetic rats by using physical and biochemical methods.
Methods: Study design included male wistar rats made into 6 groups (n=9) where group 1 was treated as vehicle control, group 2 as diabetic control, group 3 as Alzheimer’s control, group 4 as diabetic and Alzheimer’s control, group 5 as standard that received donepezil 3 mg/BSA p.o, group 6 as test that received dulaglutide 1.5 mg/BSA. Type-2 diabetes was induced by administrating Nicotin Amide (NA) 120 mg/kg i.p followed by Streptozotocin (STZ) 30 mg/kg i.v. Alzheimer’s was induced by administrating aluminum chloride 100 mg/kg oral after 3 days of diabetes induction. This study was conducted for a period of 42 days. Behavioral assessments were made on day 0,21 and 42 using elevated plus maze, Y-maze, Actophotometer and Novel Object Recognition test (NOR) followed by the estimation of biochemical parameters such as blood glucose, protein content, brain specific Creatine Kinase (CK-BB), Acetyl Choline (ACh), Acetyl Cholin Esterase (AChE), Lipid Per Oxidation (LPO), Super Oxide Dismutase (SOD), reduced Glutathione (GSH) and Catalase (CAT) activity.
Results: Results manifested that Dulaglutide ( 1.5 mg/BSA) improved cognitive function in rats providing a significant reduction in blood glucose levels (114.65 ± 8.87 mg/dL), protein content (8.907 ± 7.18 mg/g), CK-BB (219.57 ± 9.23 U/L), acetylcholinesterase (AChE) activity (0.593 ± 5.83 µM/mg) and lipid peroxidation (2.78 ± 7.69 µM/mg) and also presented a significant improvement in Acetyl Choline (ACh) levels (7.321 ± 7.52 µM/mg), SOD (51.14 ± 10.42 U/mg), GSH (11.09 ± 10.68 µM/mg) and catalase activity (1.12 ± 11.75 µM/mg) when compared with diseased controls which were analyzed using one-way ANOVA followed by Post-Hoc Tukey’s test with a significant variance of P<0.05. Histopathological study of hippocampus with congo red and Hematoxylin and Eosin (H&E) stain revealed a decrease in the plaque deposition and degenerated neurons respectively.
Conclusion: These findings from the study manifest the neuroprotective effect of dulaglutide against aluminum chloride induced cognitive dysfunction in Type-2 diabetic Alzheimer’s rats.
Keywords
Alzheimer’s disease; Aluminum chloride; Dulaglutide; GLP-1 analogues; Neuroprotection; Nicotinamide; Streptozotocin; Type-2 diabetes mellitus
Introduction
Alzheimer’s Disease (AD), as described by Alois Alzheimer is a progressive neurodegenerative disorder characterized by memory loss, neuronal degeneration, deposition of β-amyloid plaques and Neuro Fibrillary Tangles (NFTs) [1,2]. Risk factors for Alzheimer’s disease include genetic, physiological, environmental factors [3-7]. Pathophysiology involves hypothesis related to amyloid, cholinergic, glutamatergic and oxidative stress ultimately causing neuronal and memory loss [8-10].There is no specific diagnostic test available for the detection of AD, but physical methods for cognitive assessment and brain imaging tools for Aβ deposition were found to be useful [11-13].Treatment includes cholinesterase (acetylcholinesterase) inhibitors such as donepezil, galantamine, rivastigmine, tacrine [14,15] and NMDA antagonist memantine [16].
Type-2 diabetes and AD share common potential mechanisms by which it was found that type-2 diabetes is an etiological factor for the development AD in diabetic patients and this condition is often termed as ‘Type-3 diabetes’ [17,18]. AD progresses in type-2 diabetes as a result of impaired glucose and energy metabolism, insulin resistance, amyloidogenesis, elevated Advanced Glycation End Products (AGEPs) and oxidative stress [19-21].Incretins (INtestinal seCRETion of INsulin) namely GLP, GIP are known as gut hormones secreted from enteroendocrine cells exerting their major effect on glucose homeostasis [22,25]. GLP-1 and its analogues exerts insulinotropic effect by acting on GLP-1 receptors present on the beta cells of pancreas thereby stimulating insulin release and reducing the glucagon secretion [26-30]. GLP-1 analogues have found to have a neuroprotective role in type-2 diabetic associated AD as GLP-1 receptors occur in different parts of the brain primarily in the area that is necessary for memory and cognitive functions i.e., cortex and hippocampus [31-35]. Dulaglutide, a once weekly GLP-1 analogue was found to have the memory enhancing and neuroprotective activity in induced animal models [36-39]. They bind with the GLP-1 receptor present on the cell membrane thereby activating two signaling pathways PI3 K-PKB/Akt pathway and MAPK [40-42]. Activation of receptors stimulates P13 K with conversion of PIP2 to PIP3. PKB/Akt is activated by binding with PIP3 mediated by PDK. Activation of Akt/PKB causes inhibition of apoptosis promoting neuronal cell survival. Receptor activation also activates the cAMP pathway stimulating the protein kinase-A which is involved in gene transcription promoting neuronal and synaptic growth and potentiates regeneration of neurons [43-45].
Aluminum is a non-essential abundant non-redox metal ion existing in the environment but prolonged exposure to aluminum makes it a neurotoxin affecting major areas of brain [46,47]. Aluminum chloride was found to have a role in potentiating the formation of Aβ and NFTs in brain which makes it a source of AD inducer [48]. Aluminum can easily cross BBB and produces various toxic effects in the brain. Aluminum induced neurodegeneration is associated with conditions such as overexpression of APP, potentiating the accumulation of Aβ, aggregation of tau proteins and apoptosis [49,50]. It interferes with the microtubule filaments causing an integrational change in its structure and interferes with the phosphorylation of tau which causes it to accumulate in the form of NFTs [51]. It also increases oxidative damage and activates the enzyme caspase which promotes neuronal cell death [52].
Materials and Methods
Drugs and chemicals
Dulaglutide subcutaneous injection (TRULICITY 1.5 mg/0.5 ml by Eli Lilly) and donepezil tablets were purchased from a local pharmacy store. Streptozotocin was purchased from SRL laboratories, India. Acetylcholine iodide was purchased from SRL laboratories, India. Nicotinamide, aluminum chloride and other chemicals required for the study were obtained from a local chemical vendor. Assay kits required for the estimation of biochemical parameters were obtained from ERBA Mannheim limited.
Equipment
Digital weighing balance was used to measure the chemicals. Cold centrifugation system (REMI CM-12) was used to separate serum from collected animal blood samples. Semi auto analyzer was employed to analyze the biochemical constituents in serum samples. Tissue homogenizer was used to homogenize the isolated animal’s brain. UV-visible spectrophotometer was used to determine the biomarkers from tissue homogenate.
Experimental animals
Healthy adult male albino rats (wistar strain) of age 13-15 weeks old weighing between 200-250 grams were obtained from a licensed animal vendor. They were housed in cages (3-4 rats/cage) and acclimatized for 1 week in standard laboratory conditions with temperature maintenance of 25 ± 2oC. They were fed with standard pellet diet and had free access to food and water. The experimental protocol was approved by Institutional Animal Ethics committee (CPCSEA/1657/IAEC/CMRCP/COL-19/75) for the experimentation and care on animals.
Allotment of experimental animals
After the acclimatization period, animals were assessed for health condition and weight. Healthy and animals with an average weight of 200-250 grams were selected and grouped into six with nine animals in each group. Group 1 was considered as control. Group 2 was considered as diabetic control. Group 3 was considered as Alzheimer’s disease control. Group 4 was considered as diabetic and Alzheimer’s disease control. Group 5 received standard treatment induced with diabetes and Alzheimer’s disease. Group 6 received the test drug treatment
Induction of disease into experimental animals
Induction of type-2 diabetes: Animals were fasted overnight. Nicotinamide 120 mg/kg was given through intraperitoneal route followed by intravenous administration of streptozotocin 30 mg/kg after 30 minutes of nicotinamide administration. Elevated blood glucose levels (150-200 mg/dL) were observed after 3 days indicating the development of type-2 diabetes as a result of beta cell destruction in pancreas [53,54]. Care was taken by keeping them under controlled feeding conditions.
Induction of alzheimer’s disease: Alzheimer’s disease was induced into type-2 diabetes rats by the daily oral administration of aluminum chloride 100 mg/kg for an experimental time period of forty two days [55].
Drug treatment
Donepezil 3 mg was calculated based on the body surface area and it was administered as a suspension (0.5 ml) through oral route daily in the evening throughout the experimental period [56].
Dulaglutide was administered through subcutaneous route at a weekly once interval throughout the experimental period [57].
Assessment of memory and cognition in experimental animals
Behavioral performance was assessed on 0, 21st and 42nd day by employing different models such as elevated plus maze, Y-maze, actophotometer and Novel Object Recognition (NOR) test.
Elevated plus maze: Elevated plus maze was considered as a model for assessing long-term memory in experimental animals. This maze was elevated at a height of 50 cm with two closed arms measuring 50 cm X 10 cm X 40 cm and two open arms measuring 50 cm X 10 cm emerging from the center of the maze in four directions. During the experiment, each animal was placed individually at one of the open arm facing away from the center and the time taken for the animal to reach the closed arm was recorded as Transfer Latency (TL). Memory acquisition was recorded only when the animal was able to reach the closed arm within the assigned time (3 minutes) [58,59].
Y-maze: Spontaneous/forced alteration is a result of hippocampal damage causing memory deficits which was assessed by using Y-maze. It comprised of three equal arms (A,B,C) arranged at an angle of 120° measuring 50 cm X 10 cm X 15 cm. During the training period each animal was positioned at arm Afacing opposite to the centerand were trained to locate the food placed in one of the arms (B) by blocking the other (C) within an allotted time (5 minutes). During the testing period, the same procedure was conducted without blocking the third arm. Number of entries into the novel arm (C) was recorded as Forced alterations and the percent time spent in the novel arm was recorded [60,61].
Actophotometer: Acto photometer was used to study the ambulatory movements of experimental animals that can be ascribed to cognition dysfunction. Acto photometer consists of a closed chamber with a removable lid at the top. It is provided with an electric grid floor and photocell that detects the light beam obstruction caused by the animal, it reflects the loco motor movement which can be read on the digital display. Each animal was placed individually inside the acto photometer and the lid was closed before operating and recorded for 10 minutes. Loco motor index was calculated on different days (0, 21 and 42) that give a measure of loco motor alterations in different experimental groups [62,63].
Novel Objects Recognition (NOR) Test: Novel object recognition was used to assess the memory deficits in experimental rats. This test was performed in an open field where the animals were familiarized with the field before conducting the experiment. In the training phase, two similar objects were placed in the open field and the animals were freely allowed to explore the objects. During the experiment, one of the objects has been replaced with an unfamiliar object but has the similar size. Now the animal was allowed to explore with the objects for five minutes. The time spent by the animal with each object was recorded which gives a measure of discrimination index [64,65].
Estimation of biochemical parameters
Estimation of glucose levels in serum: Measurement of serum glucose levels was done by GOD-POD method. This method is based oxidation of glucose molecules present in the sample by the enzyme Glucose Oxidase (GOD) forming a salt of gluconic acid i.e. gluconate and hydrogen peroxide (H2O2). The latter undergoes further oxidation with phenol and 4-Amino Anti Pyrine (4-AAP) catalyzed by Peroxidase (POD) producing quinoneimine red colored dye, whose color intensity is proportional to the glucose concentration in the sample measured at 505 nm [66].
Estimation of Acetylcholine (ACh): Acetylcholine levels was measured by the method proposed by Hestrin, which involves reaction between acetyl group and hydroxylamine forming acetohydroxamic acid and a reddish brown colored complex with ferric ions in acidic medium. Intensity of the color produced is proportionate with the acetylcholine content measured at 540 nm and was given by µM of ACh/mg of tissue [67].
Estimation of Acetylcholinesterase activity (AChE): Acetylcholinesterase (AChE) is an essential enzyme responsible for the degradation of acetylcholine which is found to be increased in diseased conditions like Alzheimer’s. Ellman method was employed to measure acetylcholinesterase activity. This is given by µM of AChE/mg of tissue [68].
Estimation of total protein content: Total protein content estimation was carried out by Biuret method involving a biuret reaction between the peptide bonds of the protein present in the sample and copper II ions in alkaline medium forming a blue-violet colored ion complex measured at 546 nm. It was given by mg of protein/g of tissue [69].
Creatine Kinase isoenzyme (CK-BB): CK-BB is an isoenzyme of creatinine kinase that is localized predominantly in brain. This method is based on the coupling reaction between creatine phosphate and adenosine diphosphate (ADP) mediated by creatine kinase enzyme resulting in creatine and adenosine triphosphate (ATP). ATP further phosphorylates glucose molecules to glucose-6 phosphate catalyzed by hexokinase. Glucose-6 phosphate is oxidized with NADP in the presence of glucose-6 phosphate dehydrogenase yielding gluconate-6 phosphate and NADPH. The absorbance of latter was measured at 340 nm which is proportional to the creatine kinase activity present in the sample [70].
Estimation of Lipid Per Oxidation (LPO): Lipid peroxidation was used as a measure to estimate the free radical generation as a result oxidation of lipids in living cells. This method is based on the principle reaction between MDA and TBA producing pink color solution which was then measured spectrophotometrically at 535 nm. The result was expressed as µM of MDA/ mg of protein [71].
Estimation of Super Oxide Dismutase (SOD)
Superoxide dismutase is an antioxidant enzyme present in living cells to defend the superoxide radicals. The principle involved in this method is to estimate the activity of SOD based on the inhibition of autoxidation of pyrogallol which is measured from absorbance at 420 nm. The activity was expressed as units/minute/mg protein [72].
Estimation of Reduced Glutathione (GSH): Reduced glutathione is the active form of glutathione that acts by scavenging the free radicals generated in the body from cellular pathways. The principle involved in Ellman’s method was based on the reaction between GSH and Ellman’s reagent to form a yellow colored product whose absorbance was measured spectrophotometrically at 412 nm. The result was expressed as µM of GSH/ mg of protein [73].
Estimation of catalase: Catalase is an essential antioxidant required for the catalytic reduction of hydrogen peroxide into water and oxygen. The principle involved in this assay is based on the reduction of hydrogen peroxide by catalase followed by the termination of reaction using ammonium molybdate. This unreacted hydrogen peroxide forms a yellow colored complex with ammonium molybdate and the color intensity was determined at 374 nm by a spectrophotometer. The enzymatic activity was given as U/mg protein [74].
Histopathological examination
Isolated rats brain was fixed in 10% buffered formalin solution. This step is followed by tissue processing which includes dehydration using alcohol. Dehydrated tissues were embedded in paraffin wax (56oC to 62oC) for 24 hours and then made into thin sections (8 µm) with a microtome. The processed tissues were mounted on a microscopic slide and deparaffinised for staining with congo red and Hematoxylin and Eosin (H and E) for histopathological study using a light microscope [75,76].
Statistical analysis
Results obtained were represented as Mean ± SEM and the statistical significance was set at p<0.05. One-way ANOVA was used for the comparative analysis between the groups followed bypost-hocmultiple comparisons using Tukey’s test in Graph Pad prism software.
Results and Discussion
Body weights
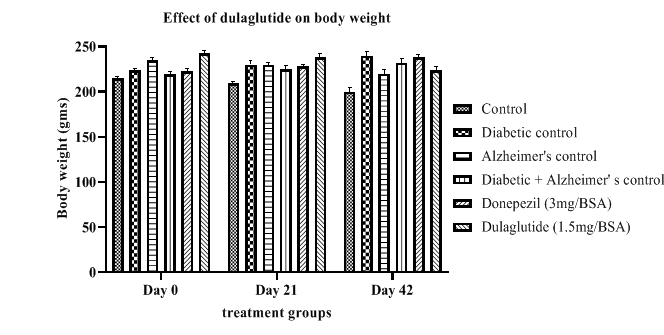
Results presented in Table 1 indicates Dulaglutide produced a reduction in body weight of the animals from day 0 to day 42 with 224 ± 3.51 when compared to diabetic controls showing an increasing in body weight indicating diseased state with 240 ± 1.53 in diabetic control and 232 ± 3.16 in D+A. Standard and normal groups did not show notable difference. This shows the anti-diabetic potential of dulaglutide in controlling diabetes and obesity. The average body weights of experimental animals on day 0,21 and 42 are depicted in Figure 1.
Table 1: Effect of dulaglutide on body weight.
| Day | Vehicle | Diabeticcontrol (D) | Alzheimer'scontrol (A) | D+A | D+A+donepezil (3 mg/BSA) | D+A+dulaglutide (1.5 mg/BSA) |
|---|---|---|---|---|---|---|
| Day 0 | 215 ± 4.08 | 224 ± 1.53 | 235 ± 4.65 | 219 ± 3.27 | 223 ± 3.57 | 243 ± 2.47 |
| Day 21 | 209 ± 3.96 | 230 ± 2.23* | 230 ± 3.74* | 225 ± 2.14# | 228 ± 3.57a | 238 ± 3.57a# |
| Day 42 | 200 ± 3.27 | 240 ± 1.53* | 220 ± 3.51* | 232 ± 3.16# | 238 ± 4.01a | 224 ± 3.51a# |
Values were represented as mean ± SEM (n=9). Statistical analysis of data was performed using One-way ANOVA followed by post-hoc Tuckey’s test. ‘*’p<0.05 when compared with normal, ‘#’p<0.05 when compared with diabetic control, ‘a’ p<0.05 when compared with D+A control.
Behavioral studies
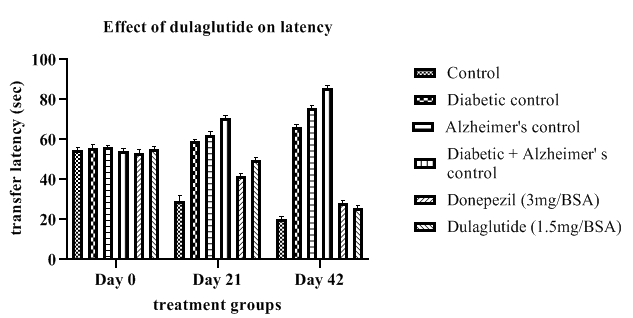
Elevated plus maze: The transfer latency of diseased animals as shown in Table 2 was found to be increased throughout the experimental period from day 0 to 42 when compared with the vehicle control (20.23 ± 1.88) with (D+A) group having an increased latency of 85.56 ± 1.88 during the last day where diabetic control and Alzheimer’s control group had 66.17 and 75.1.69 respectively. Treatment group presented a decrease in the transfer latency among all the three diseased groups with 25.73 ± 2.08 and the standard group with 28.45 ± 1.83 but standard and test group showed less variation. This indicates the ability of the dulaglutide to improve memory and cognition in diseased animals as a function of neuroprotective activity. Effect of dulaglutide on latency on day 0,21 and 42 are shown in Figure 2.
Table 2: Effect of dulaglutide on transfer latency on day 0,21 and 42.
| Day | Vehicle | Diabetic control (D) | Alzheimer's control (A) | D+A | D+A+donepezil (3 mg/BSA) | D+A+dulaglutide (1.5 mg/BSA) |
|---|---|---|---|---|---|---|
| Day 0 | 54.66 ± 1.49 | 55.75 ± 1.79 | 56.01 ± 2.08 | 54.21 ± 2.46 | 53.45 ± 2.22 | 64.27 ± 1.59 |
| Day 21 | 29.15 ± 1.76 | 59.09 ± 2.06* | 62.43 ± 2.04* | 70.93 ± 2.31$ | 41.82 ± 1.71a$ | 49.66 ± 2.32ac |
| Day 42 | 20.23 ± 1.88 | 66.17 ± 2.45* | 75.78 ± 1.69* | 85.56 ± 1.88$ | 28.45 ± 1.83a$ | 25.73 ± 2.08ac |
Values were represented as mean ± SEM (n=9). Statistical analysis of data was performed using One-way ANOVA followed by post-hoc Tuckey’s test. ‘*’p<0.05 when compared with normal, ‘$’p<0.05 when compared with Alzheimer’s control, ‘a’ p<0.05 when compared with D+A control, ‘c’ p<0.05 when compared with standard.
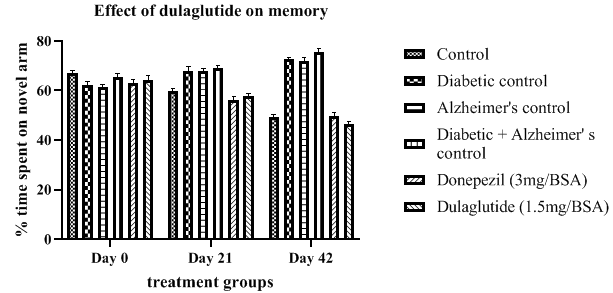
Y-maze: Alteration in memory is a part of diseased condition and the diseased groups shown an increase in the time spent in the novel arm with D+A having the greater alteration with 75.67 ± 3.11 when compared with other diseased controls having 72.55 ± 3.96 in Diabetic control and 71.9 ± 2.04 in Alzheimer’s control. Treatment group shown a progressive decrease in the alteration with 46.33 ± 2.37 when compared with diseased groups but significantly less when compared with standard group alteration with 49.66 ± 1.99. This indicates the effectiveness of the dulaglutide in improving memory deficits in experimental rats (Table 3).Improvement in memory of animals from day 0 to 42 was depicted in Figure 3.
Table 3: Effect of dulaglutide on memory on day 0, 21 and 42.
| Day | Vehicle | Diabetic control (D) | Alzheimer's control (A) | D+A | D+A +donepezil (3 mg/BSA) |
D+A+ dulaglutide (1.5 mg/BSA) |
|---|---|---|---|---|---|---|
| Day 0 | 67.01± 2.69 | 62.11 ± 2.37 | 61.34 ± 2.86 | 65.34 ± 2.06 | 63.23 ± 2.54* | 64.45 ± 2.21* |
| Day 21 | 59.82 ± 3.45 | 67.89 ± 2.58* | 68.04 ± 2.33* | 69.11 ± 2.15$ | 56.35 ± 1.68a$ | 57.66 ± 2.45ac |
| Day 42 | 49.43 ± 3.78 | 72.55 ± 3.96* | 71.9 ± 2.04* | 75.67 ± 3.11$ | 49.66 ± 1.99 a$ | 46.33 ± 2.37ac |
Values were represented as mean ± SEM (n=9). Statistical analysis of data was performed using One-way ANOVA followed by post-hoc Tuckey’s test. ‘*’p<0.05 when compared with normal, ‘$’p<0.05 when compared with Alzheimer’s control, ‘a’ p<0.05 when compared with D+A control, ‘c’ p<0.05 when compared with standard.
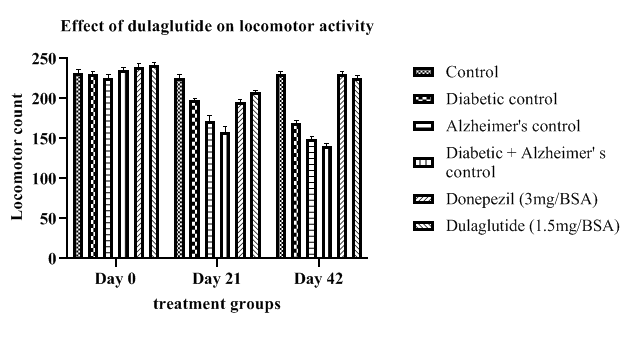
Actophotometer: Locomotor activity of diseased controls was found to be decreased with diabetic control 169 ± 1.15, Alzheimer’s control 149 ± 2.62 and (D+A) group with 140 ± 1.47 when compared to vehicle control activity 230 ± 2.01. Treatment group had shown a progressive improvement in the locomotor function from day 0 to 42 i.e., 225 ± 2.36 when compared with diseased groups but significantly less when compared with standard group (230 ± 1.66) (Table 4). Improvement in locomotor activity in experimental animals is an indication of neuroprotective activity of the test drug in treating AD shown in Figure 4.
Table 4: Effect of dulaglutide on locomotor activity on day 0,21 and 42.
| Day | Vehicle | Diabetic control (D) | Alzheimer's control (A) | D+A | D+A +donepezil (3 mg/BSA) |
D+A+ dulaglutide (1.5 mg/BSA) |
|---|---|---|---|---|---|---|
| Day 0 | 232 ± 2.15 | 230 ± 0.96 | 226 ± 0.82 | 236 ± 1.79 | 239 ± 1.69 | 242 ± 1.76 |
| Day 21 | 226 ± 1.06 | 198 ± 0.98* | 172 ± 2.34* | 158 ± 1.36$ | 195 ± 2.03a$ | 208 ± 1.85ac |
| Day 42 | 230 ± 2.01 | 169 ± 1.15* | 149 ± 2.62* | 140 ± 1.47$ | 230 ± 1.66 a$ | 225 ± 2.36 ac |
Values were represented as mean ± SEM (n=9). Statistical analysis of data was performed using One-way ANOVA followed by post-hoc Tuckey’s test. ‘*’p<0.05 when compared with normal, ‘$’p<0.05 when compared with Alzheimer’s control, ‘a’ p<0.05 when compared with D+A control, ‘c’ p<0.05 when compared with standard.
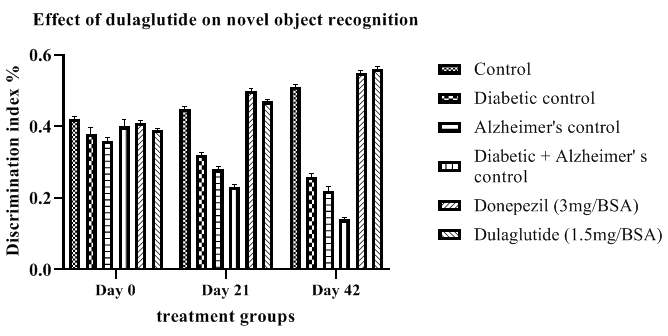
Novel object Recognition test (NOR): Discrimination Index (DI) shown in Table 5 was calculated from novel object recognition test which provided a decrease in DI in diseased groups D+A, diabetic and Alzheimer’s with 0.14 ± 5.31, 0.26 ± 5.67 and 0.22 ± 6.45 respectively when compared to vehicle control DI of 0.51 ± 5.36. This was improved in treatment group with 0.56 ± 4.83 but standard group and test groups did not show much significance. Improvement in the DI ofexperimental animals by the test drug is an indicative of its neuroprotective and memory enhancing activity which was depicted in Figure 5.
Table 5: Effect of dulaglutide on novel object recognition on day 0,21 and 42.
| Day | Vehicle | Diabetic control (D) | Alzheimer's control (A) | D+A | D+A +donepezil (3 mg/BSA) |
D+A+ dulaglutide (1.5 mg/BSA) |
|---|---|---|---|---|---|---|
| Day 0 | 0.42 ± 6.47 | 0.38 ± 4.45 | 0.36 ± 6.26 | 0.4 ± 6.03 | 0.41 ± 5.48 | 0.39 ± 5.59 |
| Day 21 | 0.45 ± 5.26 | 0.32 ± 6.12* | 0.28 ± 5.69* | 0.23 ± 6.47$ | 0.5 ± 5.61 a$ | 0.47 ± 5.48 ac |
| Day 42 | 0.51 ± 5.36 | 0.26 ± 5.67* | 0.22 ± 6.45* | 0.14 ± 5.31$ | 0.55 ± 5.26 a$ | 0.56 ± 4.83 ac |
Values were represented as mean ± SEM (n=9). Statistical analysis of data was performed using One-way ANOVA followed by post-hoc Tuckey’s test. ‘*’p<0.05 when compared with normal, ‘$’p<0.05 when compared with Alzheimer’s control, ‘a’ p<0.05 when compared with D+A control, ‘c’ p<0.05 when compared with standard.
Biochemical parameters
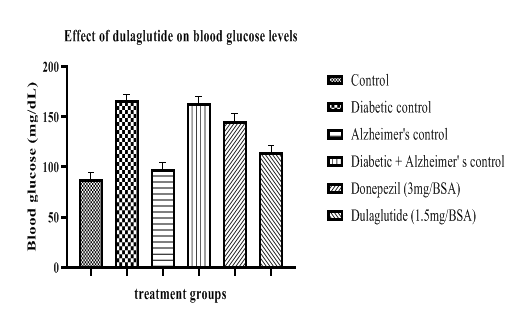
Blood glucose levels were estimated in experimental groups and it was found to have immense rise in diabetic diseased groups with 166.625 ± 7.64 in diabetic control and 163.63 ± 5.18 in D+A group. Test drug treatment shown a significant decrease in blood glucose levels after 42 treatment period with 114.65 ± 8.87 while the Alzheimer’s standard group remained with 146.25 ± 6.35 (Table 6, Figure 6). This indicates the anti-diabetic property of test drug showing efficient decrease in blood glucose levels in experimental rats.
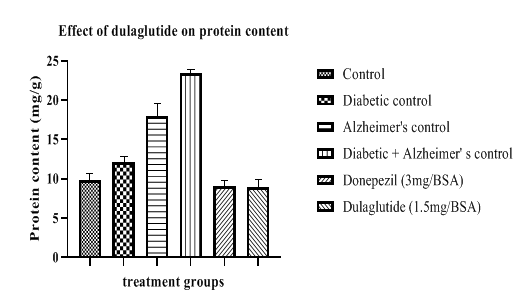
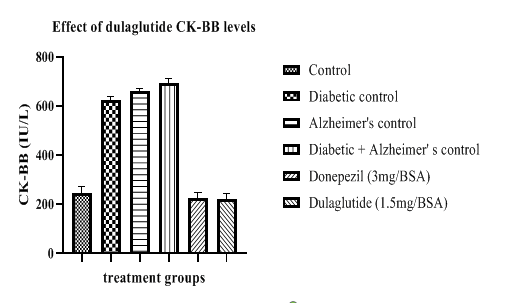
Table 6: Effect of dulaglutide on biochemical parameters.
| Treatment group | Blood glucose (mg/dL) | Ach (µ M/mg) | AChE (µ M/mg) | Protein content (mg/g) | CK-BB (U/L) |
|---|---|---|---|---|---|
| Vehicle | 87.507 ± 2.48 | 6.914 ± 4.67 | 0.589 ± 6.75 | 9.784 ± 4.11 | 243.45 ± 5.41 |
| Diabetic control (D) | 166.625 ± 7.64* | 3.709 ± 6.66* | 1.456 ± 8.09* | 12.104 ± 6.31* | 621.67 ± 5.42* |
| Alzheimer's control (A) | 98.26 ± 3.47* | 1.653 ± 6.54* | 1.598 ± 6.76* | 17.927 ± 5.29* | 660.61 ± 7.16* |
| D+A | 163.63 ± 5.18*# | 0.893 ± 7.32*$ | 1.904 ± 4.51*$ | 23.456 ± 5.55#$ | 691.32 ± 8.41#$ |
| D+A +standard (3 mg/BSA) | 146.25 ± 6.35#a | 7.922 ± 8.61$a | 0.511 ± 4.27$a | 9.112 ± 6.07$a | 223.89 ±7.66$a |
| D+A +test drug (1.5 mg/BSA) | 114.65 ± 8.87#c | 7.321 ± 7.52 ac | 0.593 ± 5.83 ac | 8.907 ± 7.18 ac | 219.57 ± 9.23 ac |
Values were represented as mean ± SEM (n=9). Statistical analysis of data was performed using One-way ANOVA followed by post-hoc Tuckey’s test. ‘*’p<0.05 when compared with normal, ‘#’p<0.05 when compared with diabetic control ‘$’p<0.05 when compared with Alzheimer’s control, ‘a’ p<0.05 when compared with D+A control, ‘c’ p<0.05 when compared with standard.
Acetylcholine and acetylcholinesterase are important biomarkers for brain damage. These levels indicated in Table 6 vary in different experimental groups showing decrease in acetylcholine levels and increase in acetylcholinesterase in diseased animals when compared to vehicle control (6.914 ± 4.67 and 0.589 ± 6.75). Acetylcholine levels were found to be 3.709 ± 6.66 in diabetic control, 1.653 ± 6.54 in Alzheimer’s control, 0.893 ± 7.32 in D+A group. Standard and test groups showed effective improvement in acetylcholine levels and profound decrease in acetylcholinesterase when compared to diseased control groups but the test group effect was significantly lower than standard drug treatment. ACh and AChE levels in standard group were 7.922 ± 8.61 and 0.511 ± 4.27 respectively, ACh and AChE levels in test group were 7.321 ± 7.52 and 0.593 ± 5.83 (Figure 7).
Protein content levels in diseased groups were found to be increased when compared to vehicle group (9.784 ± 4.11). Protein levels of diseased groups were as follows 12.104 ± 6.31 in diabetic control, 17.927 ± 5.29 in Alzheimer’s control, 23.456 ± 5.55 in D+A group. Standard and test groups lowered these levels with 9.112 ± 6.07 and 8.907 ± 7.18 respectively (Figure 8).
CK-BB levels were lowered with test drug treatment and standard group with 219.57 ± 9.23 and 223.89 ± 7.66 when compared to diabetic control with 621.67 ± 5.42, Alzheimer’s control with 660.61 ± 7.16, D+A group with 691.32 ± 8.41. These results indicate the neuroprotective property of the test drug which is helpful in treating memory and cognitive deficits in AD (Figure 9).
Tissue anti-oxidant parameters
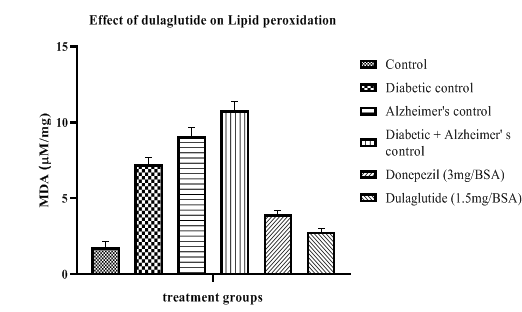
Anti-oxidant parameters were estimated in different groups (Table 7) where lipid peroxidation was found to be increased when compared with vehicle control (1.75 ± 6.87) in diseased groups with 7.25 ± 8.31 in diabetic control, 9.09 ± 11.24 in Alzheimer’s control and 10.81 ± 9.47 in D+A group. This was significantly reduced in standard and treatment groups with 3.94 ± 6.54 and 2.78 ± 7.69 respectively (Figure 10).
Table 7: Effect of dulaglutide on Anti-oxidant Parameters.
| Treatment groups | LPO (mM/mg) | SOD (U/mg) | Reduced GSH (µM/mg) | Catalase (µM/mg) |
|---|---|---|---|---|
| Vehicle | 1.75 ± 6.87 | 44.41 ± 9.86 | 9.04 ± 8.64 | 1.03 ± 8.75 |
| Diabetic control (D) | 7.25 ± 8.31* | 22.80 ± 8.06* | 3.47 ± 9.26* | 0.61 ± 10.55* |
| Alzheimer's control (A) | 9.09 ± 11.24* | 18.45 ± 9.68* | 3.90 ± 11.45* | 0.47 ± 10.89* |
| D+A | 10.81 ± 9.47#$ | 10.97 ± 12.35#$ | 2.24 ± 11.11#$ | 0.20 ± 9.37#$ |
| D+A +standard (3 mg/BSA) | 3.94 ± 6.54 a | 49.10 ± 11.21 a | 10.67 ± 10.24 a | 1.02 ± 11.52 a |
| D+A +test drug (1.5 mg/BSA) | 2.78 ± 7.69 ac | 51.14 ± 10.42 ac | 11.09 ± 10.68 ac | 1.12 ± 11.75 ac |
Values were represented as mean ± SEM (n=9). Statistical analysis of data was performed using One-way ANOVA followed by post-hoc Tuckey’s test. ‘*’p<0.05 when compared with normal, ‘#’p<0.05 when compared with diabetic control ‘$’p<0.05 when compared with Alzheimer’s control, ‘a’ p<0.05 when compared with D+A control, ‘c’ p<0.05 when compared with standard.
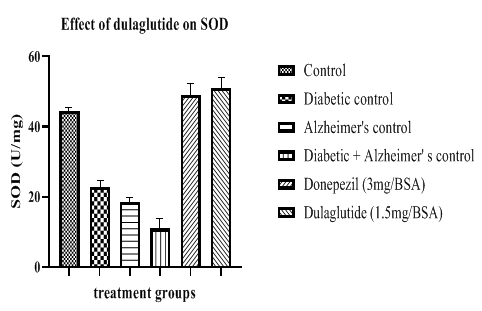
SOD levels were decreased in diseased groups when compared with vehicle control (44.41 ± 9.86) having 22.80 ± 8.06 in diabetic control, 18.45 ± 9.68 in Alzheimer’s control and 10.97 ± 12.35 in D+A group. This was found to be improved in standard and test groups with 49.10 ± 11.21 and 51.14 ± 10.42 respectively (Figure 11).
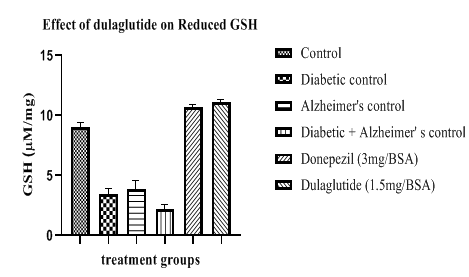
Reduced glutathione levels were decreased in diseased groups with 3.47 ± 9.26 in diabetic control, 3.90 ± 11.45 in Alzheimer’s control and 2.24 ± 11.11 in D+A group when compared to vehicle control with 9.04 ± 8.64. Test drug treatment and standard group shown increase in these levels with 11.09 ± 10.68 and 10.67 ± 10.24 respectively (Figure 12).
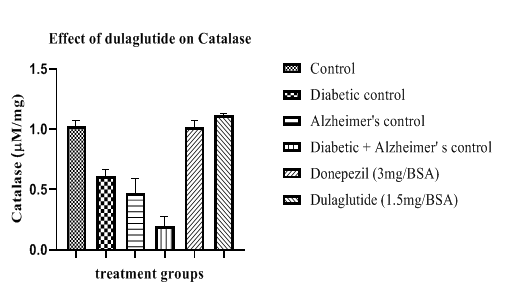
Catalase activity was found to be lowered in diseased groups with 0.61 ± 10.55 in diabetic control, 0.47 ± 10.89 in Alzheimer’s control and D+A group with 0.20 ± 9.37 when compared with vehicle control having 1.03 ± 8.75. This activity was enhanced in treatment group and standard group with 1.12 ± 11.75 and 1.02 ± 11.52 respectively (Figure 13). Improvement in anti-oxidant parameters indicates the neuroprotective effect of the test drug in experimental animals which can be used as a basis for the treatment of AD.
Histopathological examination
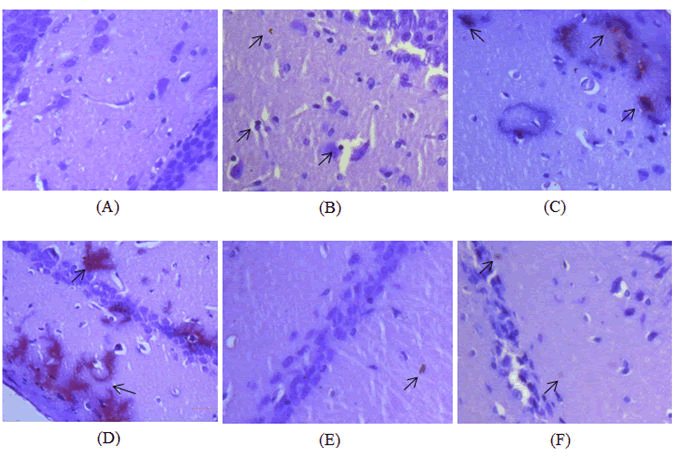
Congo red staining was used to observe the amyloid beta plaque deposition in hippocampal region of the brain. Amyloid beta plaque deposition was observed in all the diseased control groups with severe deposition in Diabetic-Alzheimer’s disease control group (Figure 14A) and moderate plaque deposition in diabetic control (Figure 14B) and Alzheimer’s disease control (Figure 14C,D). Treatment with dulaglutide (1.5 mg/BSA) did not completely eradicate the amyloid plaque but significantly presented a protective effect with mild to moderate plaques when compared with the diseased control groups (Figure 14E). Treatment group also show corresponding results with the standard donepezil hydrochloride group (Figure 14F) presenting a normal histology with the control group.
A) Group 1: Control group showing absence of plaque in the hippocampus; B) Group 2: Diabetic control group treated with 30 mg/kg STZ and 120 mg/kg NA showing mild to moderate plaque deposition in the hippocampus; C) Group 3: Alzheimer’s disease control group treated with 100 mg/kg AlCl3 for 42 days showing moderate plaque deposition in the hippocampus; D) Group 4: Diabetic and Alzheimer’s disease control group treated with 30 mg/kg STZ and 120 mg/kg NA followed by 100 mg/kg AlCl3 for 42 days showing severe plaque deposition in the hippocampus; E) Group 5: Standard group treated with 30 mg/kg STZ and 120 mg/kg NA+100 mg/kg AlCl3 along with 3 mg/BSA donepezil hydrochloride for 42 days showing decrease in the intensity of the plaque corresponding to control group; F) Group 6: Received 30 mg/kg STZ and 120 mg/kg NA+100 mg/kg AlCl3 with 1.5 mg/BSA dulaglutide weekly for 42 days as treatment showing protective effect against plaque with mild deposition and corresponding histology of control group.
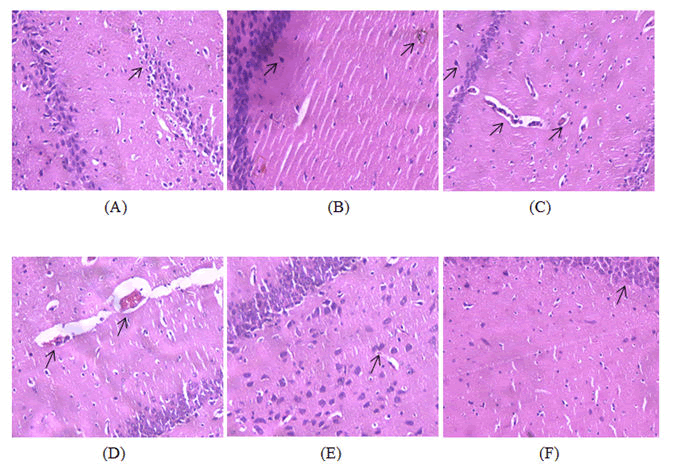
H and E staining was used for the microscopic examination of the hippocampal tissues of brain. Diabetic-Alzheimer’s disease control group showed increased number of degenerated neurons with occasional plaques (Figure 15A) whereas; the diabetic control (Figure 15B) and Alzheimer’s disease control groups (Figure 15C,D) shown occasional neuronal degeneration. Treatment with dulaglutide (1.5 mg/BSA) has significantly decreased the degeneration when compared with the diseased control groups and appeared more or less likely with the standard donepezil hydrochloride group (Figure 15E) and control group (Figure 15F) indicating its neuroprotective effect.
A) Group 1: Control group showing normal histology of the hippocampus with no signs of neuronal degeneration; B) Group 2: Diabetic control group treated with 30 mg/kg STZ and 120 mg/kg NA showing occasional degeneration of neurons when compared to control group; C) Group 3: Alzheimer’s disease control group treated with 100 mg/kg AlCl3 for 42 days showing occasional degeneration of neurons when compared with control group; D) Group 4: Diabetic and Alzheimer’s disease control group treated with 30 mg/kg STZ and 120 mg/kg NA followed by 100 mg/kg AlCl3 for 42 days showing increased number of degenerated neurons with occasional plaques; E) Group 5: Standard group treated with 30 mg/kg STZ and 120 mg/kg NA+100 mg/kg AlCl3 along with 3 mg/BSA donepezil hydrochloride for 42 days showing less number of degenerated neurons when compared to diseased groups; F) Group 6: Received 30 mg/kg STZ and 120 mg/kg NA+100 mg/kg AlCl3 with 1.5 mg/BSA dulaglutide weekly for 42 days as treatment showing protective effect in the hippocampus against neuronal degeneration with few degenerated neurons.
Conclusion
This work was performed to evaluate the neuroprotective effect of dulaglutide against cognitive dysfunction (induced with AlCl3) in Alzheimer’s associated type-2 diabetic rats.
From the results obtained from behavioral studies it was indicative that the test drug used in the treatment was found to be effective in improving cognition and memory in Alzheimer diabetic rats. Also, the test drug has lowered blood glucose levels exhibiting its anti-diabetic effect. Results obtained from biochemical parameters indicates the effectiveness of the test drug in improving acetylcholine levels and anti-oxidants and also by reducing acetylcholinesterase levels, protein content, CK-BB and lipid peroxidation. Histopathological examination also revealed that treatment with dulaglutide caused an appreciable decrease in the amyloid beta plaque deposition (observed under congo red stain) and also decreased the degeneration of neurons (observed under H&E stain) in the hippocampus of brain suggesting its neuroprotective effect.
Neuroprotective effect of GLP-1 analogues dulaglutide was produced because of the existence of GLP-1 receptors which is a potential target for GLP-1 and its analogues thereby presenting cognitive benefits. It can be a drug of choice in AD as it is an easily available drug with minimum side effects and effective at lower doses. Hence, dulaglutide can be employed in the treatment of Alzheimer’s disease alone and in Type-2 diabetic Alzheimer’s patients. Long term treatment with dulaglutide may help in ameliorating the severity of neurodegeneration and lessens the complications associated with diabetes which in turn promotes the life expectancy of patients.
References
- De-Paula VJ, Radanovic M, Diniz BS, Forlenza OV (2012) Alzheimer’s disease. Subcell Biochem 65:329-352
- Grimm A, Eckert A (2017) Brain aging and neurodegeneration: from a mitochondrial point of view. J Neurochem 143:418-431
[Crossref] [Google Scholar] [Pubmed]
- Styczynska M, Religa D, Pfeffer A, Luczywek E, Wasiak B, et al. (2003) Simultaneous analysis of five genetic risk factors in polish patients with Alzheimer’s disease. Neurosci Lett 344:99-102
[Crossref] [Google Scholar] [Pubmed]
- Borenstein AR, Wu Y, Mortimer JA, Schellenberg GD, Wayne C, et al. (2005) Developmental and vacular risk factors for Alzheimer’s disease. Neurobiol Aging 26:325-334
[Crossref] [Google Scholar] [Pubmed]
- Butterfield DA, Di Domenico F, Barone E (2014) Elevated risk of type 2 diabetes for development of Alzheimer’s disease: A key role for oxidative stress in brain. Biochim Biophys Acta 1842:1693 -1706
[Crossref] [Google Scholar] [Pubmed]
- Chen JH, Lin KP, Chen YC (2009) Risk factors for Dementia. J Formos Med Assoc 108:754-764
[Crossref] [Google Scholar] [Pubmed]
- Menendez M (2005) Down syndrome, Alzheimer’s disease and seizures. Brain Dev 27:246-252
[Crossref] [Google Scholar] [Pubmed]
- Briggs R, Kennelly SP, Neill DO (2016) Drug treatments in Alzheimer’s disease. Clin Med (Lond) 16:247-253
[Crossref] [Google Scholar] [Pubmed]
- Anil Kumar, Arti Singh, Ekavali (2015) A review on Alzheimer’s disease pathophysiology and its management: An update. Pharmacol Rep 67:195-230
[Crossref] [Google Scholar] [Pubmed]
- Luca M, Luca A, Calandra C (2015) The role of oxidative damage in the pathogenesis and progression of Alzheimer’s disease and vascular dementia. Oxid Med Cell Longev 2015:1-8
[Crossref] [Google Scholar] [Pubmed]
- Lanctot KL, Amatneik J, Ancoli-Israel S, Arnold SE, Ballard C, et al. (2017) Neuropsychiatric signs and symptoms of Alzheimer’s disease: New treatment paradigms. Alzheimers Dement (NY) 3:440-449
[Crossref] [Google Scholar] [Pubmed]
- Laske C, Sohrabi HR, Frost SM, Garrard P, Buscema M, et al. (2015) Innovative diagnostic tools for early detection of Alzheimer’s disease. Alzheimers Dement 11:561-578
[Crossref] [Google Scholar] [Pubmed]
- Skoumalova A, Hort J (2012) Blood Markers of Oxidative Stress in Alzheimer’s disease. J Cell Mol Med 16:2291-300
[Crossref] [Google Scholar] [Pubmed]
- Cutuli D, Bartolo PD, Caporali P, Tartaglione AM, Oddi D, et al. (2013) Neuroprotective effect of donepezil against cholinergic depletion. Alzheimers Res Ther 5:50
[Crossref] [Google Scholar] [Pubmed]
- Fan LY, Chiu MJ (2010) Pharmacological treatment of Alzheimer’s disease: Current approaches and future strategies. Acta Neurol Taiwan 19:228-245
[Google Scholar] [Pubmed]
- Malinow R (2012) New developments on the role of NMDA receptors in Alzheimer’s disease. Curr Opin Neurobiol 22:559-563
[Crossref] [Google Scholar] [Pubmed]
- Sridhar GR, Lakshmi G, Nagamani G (2015) Emerging Links between type 2 Diabetes and Alzheimer’s disease. World J Diabetes 6:744-751
[Crossref] [Google Scholar] [Pubmed]
- Zhao WQ, Townsend M (2009) Insulin resistance and amyloidogenesis as common molecular foundation for type-2 diabetes and Alzheimer’s disease. Biochim Biophys Acta 1792:482-496
[Crossref] [Google Scholar] [Pubmed]
- Li X, Song D, Leng SX (2015) Link between type 2 diabetes and Alzheimer’s disease: from epidemiology to mechanism and treatment. Clin Interv Aging 10:549-560
[Crossref] [Google Scholar] [Pubmed]
- Sun Ah Park (2011) A common pathogenic mechanism linking type-2 diabetes and alzheimer’s disease: evidence from animal models. J Clin Neurol 7:10-18
[Crossref] [Google Scholar] [Pubmed]
- Lee HJ, Seo HI, Cha HY, Yang YJ, Kwon SH, et al. (2018) Diabetes and Alzheimer’s disease: mechanism and nutritional aspects. Clin Nutr Res 7:229-240
[Crossref] [Google Scholar] [Pubmed]
- Gupta V (2013) Glucagon-Like peptide-1 analogues: An overview. Indian J Endocrinol Metab 17:413-421
[Crossref] [Google Scholar] [Pubmed]
- Holscher C (2014) Central effects of GLP-1: New opportunities for treatments of neurodegenerative diseases. J Endocrinol 221:T31-41
[Crossref] [Google Scholar] [Pubmed]
- Calsolaro V, Edison P (2015) Novel GLP-1 (Glucagon-like peptide-1) analogues and insulin in the treatment of alzheimer’s disease and other neurodegenerative diseases. CNS drugs 29:10 23-1039
[Crossref] [Google Scholar] [Pubmed]
- Seufert J, Gallwitz B (2014) The extra-pancreatic effects of GLP-1 receptor agonists: a focus on the cardiovascular, gastrointestinal and central nervous systems. Diabetes Obes Metab 16:673 -688
[Crossref] [Google Scholar] [Pubmed]
- Willard FS, Sloop KW (2012) Physiology and Emerging Biochemistry of the Glucagon-Like Peptide-1 Receptor. Exp Diabetes Res 2012:1-12
[Crossref] [Google Scholar] [Pubmed]
- Meloni AR, DeYoung MB, Lowe C, Parkes DG (2013) GLP-1 receptor activated insulin dependence from pancreatic β-cells: mechanism and glucose dependence. Diabetes Obes and Metab 15:15-27
[Crossref] [Google Scholar] [Pubmed]
- Sharma D, Verma S, Vaidya S, Kalia K, Tiwari V (2018) Recent updates on GLP-1 agonists: Current advancements and challenges. Biomed Pharmacother 108:952-962
[Crossref] [Google Scholar] [Pubmed]
- Nadkarni P, Chepurny OG, Holz GG (2014) Regulation of glucose homeostasis by GLP-1. Prog Mol Bio Transl Sci 121:23-65
[Crossref] [Google Scholar] [Pubmed]
- Drucker DJ (2018) Mechanisms of action and therapeutic application of Glucagon-Like peptide-1. Cell Metab 27:740-756
[Crossref] [Google Scholar] [Pubmed]
- Macdonald EP, El-Kholy W, Riedel MJ, Salapatek AM, Light PE, et al. (2002) The multiple actions of GLP-1 on the process of glucose-stimulated insulin secretion. Diabetes 51: 434-442
[Crossref] [Google Scholar] [Pubmed]
- Holscher C (2014) Drugs developed for treatment of diabetes show protective effects in Alzheimer’s and Parkinson’s diseases. Sheng Li Xue Bao 66:497-510
[Google Scholar] [Pubmed]
- Geloneze B, de Lima-Junior JC, Velloso LA (2017) Glucagon-Like Peptide-1 Receptor Agonists (GLP-1 RAs) in the Brain–Adipocyte Axis. Drugs 77:493-503
[Crossref] [Google Scholar] [Pubmed]
- Zhou M, Chen S, Peng P, Gu Z, Yu J, et al. (2019) Dulaglutide ameliorates STZ induced AD-like impairment of learning and memory ability by modulating hyperphosphorylation of tau and NFs through GSK3 β. Biochem Biophys Res Commun 511:154-160
[Crossref] [Google Scholar] [Pubmed]
- Scheen AJ (2017) Dulaglutide for the treatment of type 2 diabetes. Expert Opin Biol Ther 17:485-496
[Crossref] [Google Scholar] [Pubmed]
- Cukierman-Yaffe T, Gerstein HC, Colhoun HM, Diaz R, Garcla-Perez LE, et al. (2020) Effect of Dulaglutide on cognitive impairment in type 2 diabetes: an exploratory analysis of the REWIND trail. Lancet Neurol 19:582-590
[Crossref] [Google Scholar] [Pubmed]
- Batista AF, Bodart-Santos V, De Felice FG, Ferreira ST (2019) Neuroprotective actions of glucagon-like peptide-1 (GLP-1) analogues in Alzheimer’s and Parkinson’s diseases. CNS drugs 33:209-223
[Crossref] [Google Scholar] [Pubmed]
- Kugler AJ, Thiman ML (2018) Efficacy and safety profile of once-weekly dulaglutide in type 2 diabetes: a report on the emerging new data. Diabetes Metab Syndr Obes 11:187-197
[Crossref] [Google Scholar] [Pubmed]
- Perry T, Lahiri DK, Sambamurti K, Chen D, Mattson MP, et al. (2003) Glucagon-like peptide-1 decreases endogenous amyloid-beta peptide (Abeta) levels and protects hippocampal neurons from death induced by Abeta and iron. J Neurosci Res 72:603-612
[Crossref] [Google Scholar] [Pubmed]
- Long-Smith CM, Manning S, McClean PL, Coakley MF, O'Halloran DJ, et al. (2013) The diabetes drug liraglutide ameliorates aberrant insulin receptor localization and signaling in parallel with decreasing both amyloid-βplaque and glial pathology in a mouse model of Alzheimer’s disease. Neuromolecular Med 15:102-114
[Crossref] [Google Scholar] [Pubmed]
- Wicinski M, Socha M, Malinowski B, Wodkiewicz E, Walczak M, et al. (2019) Liraglutide and its neuroprotective properties-focus on possible biochemical mechanisms in Alzheimer’s disease and Cerebral Ischemic events. Int J Mol Sci 20:1050
[Crossref] [Google Scholar] [Pubmed]
- McClean PL, Holscher C (2014) Lixisenatide, a drug developed to treat type-2 diabetes, shows neuroprotective effects in a mouse model of Alzheimer’s disease. Neuropharmacol 86:241-258
[Crossref] [Google Scholar] [Pubmed]
- Hemmings BA, Restuccia DF (2012) PI3 K-PKB/Akt pathway. Cold Spring Harb Perspect Biol 4:1-3
[Crossref] [Google Scholar] [Pubmed]
- Perry TA, Greig NH (2004) A new Alzheimer’s disease interventive strategy: GLP-1. Curr Drug Targets 5:565–571
[Crossref] [Google Scholar] Pubmed]
- Bao Y, Jiang L, Chen H, Zou J, Liu Z, et al. (2015) The neuro protective effect of Liraglutide is mediated by Glucagon-like peptide 1 receptor-mediated activation of cAMP/PKA/CREB pathway. Cell Physiol Biochem 36:2366-2378
[Crossref] [Google Scholar] [Pubmed]
- Li X, Bao X, Wang R (2016) Experimental models of Alzheimer’s disease for deciphering the pathogenesis and therapeutic screening (Review). Int J Mol Med 37:271-283
[Google Scholar] [Pubmed]
- Krewski D, Yokel RA, Nieboer E, Borchelt D, Cohen J, et al. (2007) Human health risk assessment for aluminum, aluminum oxide and aluminum hydroxide. J Toxicol Environ Health B Crit Rev 10:1-269
[Crossref] [Google Scholar] [Pubmed]
- Song J (2018) Animal Model of Aluminum-Induced Alzheimer’s disease. Adv Exp Med Biol 1091:113-127
[Crossref] [Google Scholar] [Pubmed]
- Huat TJ, Camats-Perna J, Newcombe EA, Valmas N, Kitazawa M (2019) Metal Toxicity Links to Alzheimer’s disease and Neuroinflammation. J Mol Biol 431:1843-1868
[Crossref] [Google Scholar] [Pubmed]
- Kawahara M, Kato-Negishi M (2011) Link between aluminum and the pathogenesis of alzheimer’s disease: The integration of the aluminum and amyloid cascade hypotheses. Int J Alzheimer’s Dis 2011:1-17
[Crossref] [Google Scholar] [Pubmed]
- Liu WJ, Jin HY, Lee KA, Xie SH, Baek HS, et al. (2011) Neuroprotective effect of the glucagon-like peptide-1 receptor agonist, synthetic Exedin-4, in streptozotocin-induced diabetic rats. Br J Pharmacol 164:1410-1420
[Crossref] [Google Scholar] [Pubmed]
- Bais S, Kumari R, Prashar Y (2018) Ameliorative effect of trans-sinapic acid and its protective role in cerebral hypoxia in aluminum chloride induced dementia of alzheimer’s type. CNS Neurol Disord Drug Targets 17:144-154
[Crossref] [Google Scholar] [Pubmed]
- Ghasemi A, Khalifi S, Jedi S (2014) Streptozotocin-nicotinamide-induced rat model of type 2 diabetes (review). Acta Physiol Hung 101:408-420
[Crossref] [Google Scholar] [Pubmed]
- Kaur G, Invally M, Chintamaneni M (2016) Influence of piperine and quercetin on antidiabetic potential of curcumin. J Complement Integr Med 13:247-255
[Crossref] [Google Scholar] [Pubmed]
- Auti ST, Kulkarni YA (2019) Neuroprotective effect of cardamom oil against aluminum induced neurotoxicity in rats. Front Neurol 10:399
[Crossref] [Google Scholar] [Pubmed]
- Fujiki M, Hikawa T, Abe T, Ishii K, Kobayashi H (2006) Reduced short latency afferent inhibition in diffuse axonal injury patients with memory impairment. Neurosci Lett 405:226-230
[Crossref] [Google Scholar] [Pubmed]
- Gurung T, Shyangdan DS, O'Hare JP, Waugh N (2015) A novel, long-lasting glucagon-like peptide receptor-agonist: dulaglutide. Diabetes Metab Syndr Obes 8:363-386
[Crossref] [Google Scholar] [Pubmed]
- Wolf A, Bauer B, Abner EL, Ashkenazy-Frolinger T, Hartz AM (2016) A comprehensive behavioral test battery to assess learning and memory in 129S6/Tg2576 mice. PLoS One 11:1-23
[Crossref] [Google Scholar] [Pubmed]
- Kruk-Słomka M, Budzyńska B, Biała G (2012) Involvement of cholinergic receptors in the different stages of memory measured in the modified elevated plus maze test in mice. Pharmacol Rep 64:1066-1080
[Crossref] [Google Scholar] Pubmed]
- Seung TW, Park SK, Kang JY, Kim JM, Park SH, et al. (2018) Ethyl acetate fraction from Hibiscus sabdariffa L. attenuates diabetes-associated cognitive impairment in mice. Food Res Int 105:589-598
[Crossref] [Google Scholar] [Pubmed]
- Kraeuter AK, Guest PC, Sarnyai Z (2019) The Y-maze for assessment of spatial working and reference memory in mice. Methods Mol Biol 1916:105-111
[Crossref] [Google Scholar] [Pubmed]
- Nampoothiri M, John J, Kumar N, Mudgal J, Nampurath GK, et al. (2015) Modulatory Role of Simvastatin against Aluminum Chloride-Induced Behavioral and Biochemical Changes in experimental rats. Behav Neurol 2015:1-9
[Crossref] [Google Scholar] [Pubmed]
- Zhang H, Zhao W, Malhotra A (2018) Efficacy of Curcumin in ameliorating aluminum-induced neurotoxicity. J Environ Pathol Toxicol Oncol 37:163-172
[Crossref] [Google Scholar] [Pubmed]
- Nillert N, Pannangrong W, Welbat JU, Chaijaroonkhanarak W, Sripanidkulchai K, et al. (2017) Neuroprotective effects of aged garlic extract on cognitive dysfunction and neuroinflammation induced by b-amyloid in rats. Nutrients 9:1-13
[Crossref] [Google Scholar] [Pubmed]
- Cohen SJ, Stackman RW Jr (2015) Assessing rodent hippocampal involvement in the novel object recognition task. A review. Behav Brain Res 285:105-117
[Crossref] [Google Scholar] [Pubmed]
- Jiao L, Xiujuan S, Juan W, Song J, Lei X, et al. (2015) Comprehensive experiment-Clinical biochemistry: Determination of Blood glucose and triglycerides in normal and diabetic rats. Biochem Mol Biol Educ 43:47-51
[Crossref] [Google Scholar] [Pubmed]
- Hestrin S (1949) The reaction of acetylcholine and other carboxylic acid derivatives with hydroxylamine and its analytical application. J Biol Chem 180:249-261
[Crossref] [Google Scholar] Pubmed]
- Zhang XD, Liu XQ, Kim YH, Whang WK (2014) Chemical constituents and their acetyl cholinesterase inhibitory and antioxidant activities from leaves of Acanthopanax henryi: potential complementary source against Alzheimer’s disease. Arch Pharm Res 37:606-616
[Crossref] [Google Scholar] [Pubmed]
- Yu S, Liu YP, Liu HL, Li J, Xiang Y, et al. (2018) Serum protein-based profiles as novel biomarkers for the diagnosis of Alzheimer’s disease. Mol Neurobiol 55:3999-4008
[Crossref] [Google Scholar] [Pubmed]
- Bürklen TS, Schlattner U, Homayouni R, Gough K, Rak M, et al. (2006) The creatine kinase/Creatine connection to Alzheimer’s disease. CK inactivation, APP-CK complexes and focal creatine deposits. J Biomed Biotechnol 2006:1-11
[Crossref] [Google Scholar] [Pubmed]
- Feitosa CM, da Silva Oliveira GL, do Nascimento Cavalcante A, Morais Chaves SK, Rai M (2018) Determination of parameters of oxidative stress in vitro models of neurodegeneration diseases-A Review. Curr Clin Pharmacol 13:100-109
[Crossref] [Google Scholar] [Pubmed]
- Alam MN, Bristi NJ, Rafiquzzaman M (2013) Review on in vivo and in vitro methods evaluation of antioxidant activity. Saudi Pharm J 21:143-152
[Google Scholar] [Pubmed]
- Weydert CJ, Cullen JJ (2010) Measurement of superoxide dismutase, catalase and glutathione peroxidase in cultured cells and tissues. Nat protoc 5:51-66
[Crossref] [Google Scholar] [Pubmed]
- Li HQ, Ip SP, Zheng GQ, Xian YF, Lin ZX (2018) Isorhynchophylline alleviates learning and memory impairments induced by aluminum chloride in mice. Chin Med 13:29
[Crossref] [Google Scholar] [Pubmed]
- Feldman AT, Wolfe D (2014) Tissue processing and hematoxylin and eosin staining. Methods Mol Biol 1180:31-43
[Crossref] [Google Scholar] [Pubmed]
- Yakupova EI, Bobyleva LG, Vikhlyantsev IM, Bobylev AG (2019) Congo red and amyloids: history and relationship. Biosci Rep 39: BSR20181415
[Crossref] [Google Scholar] [Pubmed]
Open Access Journals
- Aquaculture & Veterinary Science
- Chemistry & Chemical Sciences
- Clinical Sciences
- Engineering
- General Science
- Genetics & Molecular Biology
- Health Care & Nursing
- Immunology & Microbiology
- Materials Science
- Mathematics & Physics
- Medical Sciences
- Neurology & Psychiatry
- Oncology & Cancer Science
- Pharmaceutical Sciences
