Does Increased Lumbar Lordosis Promote Osteoporosis of The Lumbar Spine?
Woelfle Roos JV1*, Goldhahn I1, Weckbach S1, Reichel H1 and Lattig F2
1Department of Orthopaedic Surgery, University of Ulm, Ulm, Germany
2Berit Paracelsus Klinik, Niederteufen, Switzerland
- *Corresponding Author:
- Dr. Julia V. Wölfle-Roos
Department of Orthopaedic Surgery
University of Ulm, Oberer Eselsberg 45, 89081 Ulm, Germany
Tel: +49-731-1775118
Fax: +49-731-1771185
E-mail: julia.woelfle@uni-ulm.de
Received date: January 24, 2018; Accepted date: February 20, 2018; Published date:February 28, 2018
Citation: Roos JVW, Goldhahn I, Weckbach S, Reichel H, Lattig F (2018) Does Increased Lumbar Lordosis Promote Osteoporosis of The Lumbar Spine?. J Orthop Disord. Vol.1 No.1:16
Abstract
Objective: Increasing thoracic kyphosis is a typical clinical feature of osteoporosis. Recent clinical studies suggest a correlation between increased lumbar lordosis and lumbar bone mineral density (BMD). The aim of this study was to investigate the relationship between lumbar lordosis and BMD. Subjects and Methods: All postmenopausal patients who had undergone DEXA measurement of BMD between 2011 and 2013 were included in this study if biplanar X-rays were available and if the patient did not have any medical condition influencing lumbar lordosis or BMD (e.g. fractures). Lumbar lordosis L1–S1 of the remaining 69 patients was measured on the lateral X-ray and was correlated to the lumbar and femoral BMD. Results: There was a significant negative correlation between lumbar lordosis and lumbar BMD (R=-0.447, p<0.001) even when taking into account potential confounding factors such as age, gender, BMI, and spondylotic changes. The correlation was strongest in the lumbar apex (L3, R=-0.458, p<0.001). We did not find a significant correlation between lumbar lordosis and femoral BMD (R=- 0.207, p=0.142). Conclusion: We found a statistically significant negative correlation between lumbar lordosis and lumbar BMD. As the correlation was strongest in the lumbar apex and as we found no significant correlation between lumbar lordosis and femoral BMD, increased lumbar lordosis might be considered to be the cause and not the result of low lumbar BMD. Thus, when assessing the risk of osteoporotic vertebral fractures in patients with hyperlordosis the possibility of low lumbar BMD especially at the lumbar apex should be considered.
Keywords
Hyperlordosis; Lumbar lordosis; DEXA; Bone mineral density; Osteoporosis
Introduction
Increasing thoracic kyphosis is a common clinical feature of osteoporosis [1-7]. In recent studies, low bone mineral density (BMD) has been additionally associated with increased lumbar lordosis. Cunha-Henriques et al. compared 30 female patients aged 40–65 years with osteoporosis to another 33 patients matched according to age and menopausal status without osteoporosis. They found a highly significant difference of lumbar lordosis measured on lateral X-rays between patients with osteoporosis (117.7 ± 8°) and those without (53.1 ± 5°) [1]. Pavlovic et al. measured lumbar lordosis clinically with a flexicurve in 104 premenopausal and 138 postmenopausal women. They found a significant negative correlation between lumbar lordosis and BMD in both groups [6]. However, evidence remains controversial, as other studies found no significant correlation between lumbar lordosis and BMD [5,7], and Lee et al. even found a significantly lower lumbar lordosis in patients with osteoporosis (27.3 ± 15.5°) compared to those without (40.3 ± 3.9°) [5].
There are different hypotheses as to the cause of a possible correlation between lumbar lordosis and bone mineral density. On the one hand, lumbar lordosis might result in lower axial load of the lumbar vertebral bodies thus causing low lumbar BMD. On the other hand, low BMD might lead to wedging deformities of the thoracic spine with compensatory lumbar lordosis or of the lumbar spine. Last but not least, it must be considered that influencing factors of lumbar lordosis and/or BMD–e. g. age [8-11], gender BMI spondylotic changes [10,12] might simulate a correlation between lumbar lordosis and BMD.
The aim of this study was to investigate if there is a correlation between lumbar lordosis and BMD, taking into account major potential confounding factors, and if increased lumbar lordosis is the result or the cause of low lumbar BMD.
Methods
The primary hypothesis of this study was that increased lumbar lordosis was associated with low lumbar BMD. Furthermore, we postulated that no correlation between lumbar lordosis and femoral BMD would be found, as we expected that increased lumbar lordosis was the cause and not the result of low lumbar BMD.
All patients who had undergone measurement of bone mineral density by means of dual-energy X-ray absorptiometry (DEXA) between January 2011 and December 2013 were reviewed. Patients were included in this study if biplanar X-rays of the lumbar spine in an upright position no more than 3 months before or after DEXA were available and if they did not meet with the following exclusion criteria. Conditions influencing the sagittal curvature such as fractures of the spine, spondylodesis, spondylolisthesis > grade 1 according to the Meyerding classification, scoliosis, ankylosing spondylitis, diffuse idiopathic skeletal hyperostosis, or translational deformities were excluded. Additionally, conditions influencing bone mineral density (i.e., rheumatoid arthritis, prolonged steroid use, metabolic disorders) or measurement of bone mineral density (i.e., metal implants of the spine, ankylosing spondylitis) were not included in this study. Apart from that, all 5 premenopausal patients were excluded. Demographic data of all 69 patients included in this study are depicted in Table 1.
| Gender | Female: Male = 53: 16 |
| Age | 68.9 years (44.1 – 88.8 years) |
| Body Height | 165.5 cm (150 – 184 cm) |
| Body Weight | 75.1 kg (50 – 120 kg) |
| Body Mass Index (BMI) | 27.2 kg/m2 (18.4 – 38.1 kg/m2) |
| Obesity (BMI>30) | 21/69 = 30.3% |
Continuous variables are shown as median (minimum -maximum).
Table 1: Demographic data of patients included (n=69).
Lumbar lordosis was measured on the lateral radiograph with a picture achieving computer system (Centricity PACS-IW 3.7.3.9, GE Healthcare Information Technologies, Germany) between the upper endplate of L1 and S1 using Cobb’s method. Additionally, the extent of lower and upper endplate sclerosis of each lumbar vertebral body L1 to L4 was evaluated according to the German consensus recommendations for assessing occupational diseases of the lumbar spine by Bolm-Audorff et al. [13]. If endplate sclerosis was rated grade II according to Bolm-Audorff et al. i.e., sclerotic changes exceeded 2 mm on the lateral radiograph endplate sclerosis was considered to be marked. Measurements were performed twice within an interval of two weeks to decrease intraobserver errors. Indication for X-ray was low back pain in all cases.
BMD of the lumbar spine and of the proximal femur was measured by means of dual-energy X-ray absorptiometry (Lunar iDXA, GE Healthcare, Germany). The T-score was defined as the absolute individual BMD compared to the peak BMD from the normative database divided by the standard deviation [14]. The T-score of the following regions of interest was noted: T-score of each lumbar vertebral body L1–L4, overall T-score L1–L4, T-score right femoral neck, T-score left femoral neck, mean bilateral T-score femoral neck.
Results
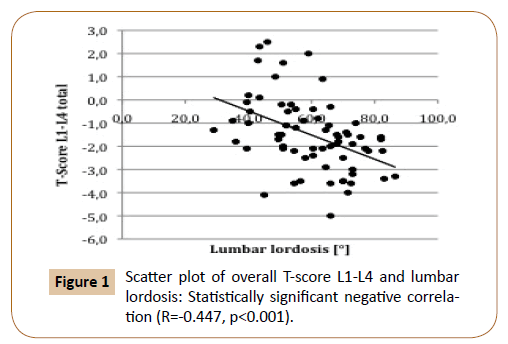
Median lumbar lordosis measured between L1 and S1 was 60.5° (range 29.0°–86.5°). DEXA showed a median overall T-score L1– L4 of -1.5 (range -5.0–+2.5). There was a statistically significant negative correlation between lumbar lordosis and T-score L1–L4 (R=-0.447, p<0.001) (Figure 1).
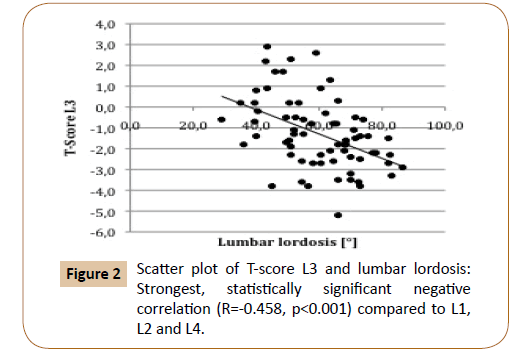
Correlation between BMD of the lumbar spine and lumbar lordosis was strongest for L3 (R=-0.458, p<0.001) (Figure 2 and Table 2).
| Variables | Score | Pearson’s Correlation Coefficient | p |
|---|---|---|---|
| Lumbar lordosis L1-L5 | T-score L1 | R = -0.366 | 0.002 |
| T-score L2 | R = -0.397 | 0.001 | |
| T-score L3 | R = -0.458 | <0.001 | |
| T-score L4 | R = -0.400 | <0.001 |
Table 2: Correlation between lumbar lordosis [°] and T-score of each lumbar vertebral body L1 to L4.
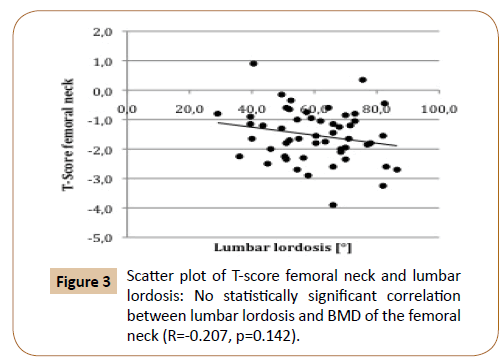
DEXA of the femoral neck was only available in 52 patients. Median T-score of the femoral neck was -1.5 (range -3.9–+0.9). The correlation between BMD of the lumbar spine (T-score L1-L4 total) and BMD of the femoral neck was statistically significant (R=0.476, p<0.001). There was no statistically significant correlation between lumbar lordosis and BMD of the femoral neck (R=-0.207, p=0.142 (Figure 3).
Further statistical analysis was conducted to determine the influence of several factors potentially affecting lumbar lordosis and/or bone mineral density. First-order correlations controlling for main continuous confounding factors still showed a statistically significant correlation between lumbar BMD and lumbar lordosis (age: R=-0.438 (p<0.001), weight: R=-0.395 (p=0.001), BMI: R=- 0.433 (p<0.001)).
When conducting a separate correlation analysis according to the presence or absence of major nominal confounding factors (gender, endplate sclerosis) still a significant correlation between lumbar BMD and lumbar lordosis could be seen in almost all cases (Table 3).
| Confounding factor | ||
|---|---|---|
| Gender | Male (n=16) | Female (n=53) |
| R = -0.344 | R = -0.443s | |
| Endplate sclerosis | Grade 0 – I# | Grade II# |
| L1* | R = -0.671s (n=19) | R = -0.291s (n=50) |
| L2* | R = -0.357 (n=24) | R = -0.330s (n=50) |
| L3* | R = -0.463s (n=25) | R = -0.264 (n=44) |
| L4* | R = -0.191 (n=27) | R = -0.150 (n=42) |
Table 3:Comparison of the correlation between T-Score L1-L4 and lumbar lordosis according to the presence of major nominal confounding factors.
Discussion
The most important finding of this study was the statistically significant negative correlation of lumbar lordosis and lumbar BMD even when major confounding factors such as age, gender, weight, and endplate sclerosis were taken into account.
These findings concur with Pavlovic et al. who found a statistically significant negative correlation between lumbar curvature and lumbar BMD in both premenopausal (n=100, R= -0.34) and postmenopausal women (n=134, R=-0.32), even though in their study lumbar lordosis was measured clinically by means of a flexicurve [6]. The authors controlled for the patients’ weight and age and still found a significant negative correlation. Cunha- Henriques et al. described a much stronger negative correlation between lumbar lordosis and lumbar BMD when measuring lumbar lordosis radiographically (R=-0.67). However, they did not take into account any confounding factors [1]. By contrast, no significant correlation between lumbar BMD and lordosis was found in other studies by Sinaki et al. [7] and Lee et al. (R=- 0.048) [5], which is possibly due to their much younger [7] and much more heterogeneous [5] study group. Papadakis et al. compared lumbar lordosis of patients with osteoporosis and/ or osteoarthritis and those without and did not find a significant difference between all four groups, though they did not perform correlation analysis [15].
Different hypotheses have been put forward to account for this negative correlation between lumbar lordosis and bone mineral density [6]. On the one hand, low bone mineral density might increase lumbar lordosis by way of wedging deformities. This hypothesis is supported by Pavlovic et al. who found a significant negative correlation between lumbar lordosis and both lumbar and femoral BMD suggesting that low BMD is the cause and not the result of increasing lumbar lordosis [6]. In the thoracic spine, a strong statistically significant correlation between BMD and indices of vertebral wedging (anterior/posterior height) has been described in literature [2]. In the lumbar spine, however, no comparable correlation has been found so far.
On the other hand, increased lumbar lordosis might diminish axial load of the lumbar vertebral bodies thus promoting bone loss. This is supported by our results which–in contrast to Pavlovic et al. [6] showed a statistically significant negative correlation of lumbar lordosis and lumbar BMD only (R=-0.447, p<0.001) but not of lumbar lordosis and femoral BMD (R=-0.207, p=0.142). In our study, correlation between lordosis and lumbar BMD was strongest in L3 and L4. As the lumbar apex is most commonly located at disk space L3/L4 ( 0.5 levels [2]) and as the lumbar apex is most likely to be affected by lumbar lordosis, our findings support the hypothesis that increased lumbar lordosis promotes osteoporosis of the spine.
Though the correlation between lumbar lordosis and BMD was statistically significant, a correlation coefficient below 0.5 must be interpreted as a weak correlation. One possible reason for this is that higher axial load of the posterior column in patients with increased lumbar lordosis might cause increased BMD of the posterior elements such as the facet joints. As standard spine BMD is measured in the anteroposterior direction, lower BMD of the vertebral bodies might be masked by increased BMD of the posterior spinal elements in patients with increased lumbar lordosis. Apart from that, the comparatively weak correlation suggests a multifactorial etiology of both lumbar lordosis and BMD.
Though it is widely known that BMD declines with increasing age [10], it is controversially discussed in literature if increasing age is associated with changes of lumbar lordosis. While Bernhardt et al. found that mean sagittal alignment did not differ when age was considered [2], Takeda et al. and Gelb et al. saw a significant decrease of lumbar lordosis with age [9,11]. Thus, it is unclear if the factor age must be considered a potential confounding factor of the correlation between lumbar BMD and lordosis. In our study, we did not find a relevant difference between zeroorder correlations of lumbar BMD and lordosis and first-order correlations when controlling for age (R=-0.438 (p<0.001)).
In literature, the correlation between lumbar BMD and lordosis has only been studied in women so far [1,5-7]. Ours is the first study to include male patients in our investigation. We found no difference between men and women with regard to the correlation of lumbar BMD and lordosis, but due to the low number of male patients (n=18) the correlation in the male group was not statistically significant. Other potential confounding factors such as body mass index and weight did not affect the correlation between lumbar BMD and lordosis noticeably (firstorder correlations R=-0.433 (p<0.001) and R=-0.395 (p=0.001) respectively).
It has been suggested in literature that lumbar BMD might be artificially high in patients with spondylotic changes of the lumbar spine [12], which is also the most convincing theory to account for the apparent increase in BMD in the 8th decade [10,12]. By contrast, no correlation between spondylosis and lordosis has been found in a review of 120 articles describing different factors associated with lumbar lordosis [8]. To analyze the influence of spondylotic changes on the correlation between lumbar BMD and lordosis, the correlation coefficient of patients with and without degenerative changes, especially endplate sclerosis, was compared on a segmental level L1–L4. Results were inconsistent: In L4 there was no correlation of lumbar BMD and lordosis, whereas in L1 and L3 an even stronger correlation among patients with endplate sclerosis was seen when compared to the overall study group. These inconsistent results suggest that the impact of endplate sclerosis on the correlation between lumbar BMD and lordosis should not be underestimated especially in the lower lumbar spine, but that the correlation is not solely due to the influence of degenerative changes [16].
In this study, we found a significant, moderately strong correlation between femoral and lumbar BMD (R=0.476, p<0.001). As osteoporosis is a systemic disease characterized by structural deterioration of all osseous tissue, BMD measurements at different skeletal sites (e.g. calcaneus, distal radius, femoral neck or lumbar spine) show a medium to strong correlation in most studies [17,18]. However, discrepancies between BMD measured at different sites have been reported, as for example vertebral bodies tend to be more sensitive to the effects of corticosteroid drugs and lumbar BMD might be increased by degenerative changes of the facet joints [19]. Due to this discrepancy between femoral and lumbar BMD Lai et al. suggest that both lumbar spine and proximal femur measurements should be made when looking for osteoporosis as otherwise up to 31% of patients would be misdiagnosed [14].
The major weakness of this study was its retrospective design, which did not allow us to evaluate the impact of other confounding factors such as diabetes mellitus, activity level, or back muscle strength on the correlation of lumbar BMD and lordosis. In particular, low extensor strength has been associated with both increased lumbar lordosis and low lumbar BMD [1] and might thus have simulated a negative correlation between both. However, the correlation between extensor strength and lumbar BMD is controversially discussed in literature, and was not seen by Mika et al. [20] in a study with 189 females between 50 and 80 years of age. The other major weakness of this study was its crosssectional design; a longitudinal analysis would have allowed us to further investigate if increasing lumbar lordosis is the cause or the result of low lumbar BMD. Last but not least, measurement of lumbar lordosis would have been more precise on sagittal full spine standing X-rays, which however were not available for our patients in this study. Nevertheless, lateral radiographs might be considered superior to clinical measurement of lumbar lordosis with a flexicurve used in other studies [6], as a reliable correlation between radiographic and clinical measurement has only been shown for thoracic kyphosis so far [21].
Conclusion
In conclusion, we found a statistically significant negative correlation between lumbar lordosis and lumbar BMD even when taking into account major confounding factors such as age, gender, spondylotic changes, weight, and BMI. The negative correlation between lumbar lordosis and lumbar BMD was only moderately strong suggesting a multifactorial etiology of both lumbar lordosis and BMD. Though increased lumbar lordosis might be caused by low lumbar BMD resulting in wedge deformities of the lumbar spine, we found some evidence in this study that increased lumbar lordosis might be the cause and not the result of low lumbar BMD: Correlation between lordosis and lumbar BMD was strongest at the lumbar apex and no significant correlation between lumbar lordosis and femoral BMD was found. In any case, the possibility of low lumbar BMD especially at the lumbar apex in patients with hyperlordosis should be kept in mind, especially when planning multilevel spinal fusion or assessing the risk of osteoporotic vertebral fracture.
Conflict of Interest
The authors declare that there was no financial or other conflict of interest that might have biased their work. No commercial company was involved in the planning of this study, the data collection, the interpretation of the data, or the writing of the manuscript.
References
- Henriques CS, Paiva CL, Neto PAM, Carvesan FG, Nanni L (2011) Postmenopausal women with osteoporosis and musculoskeletal status: a comparative cross-sectional study. J Clin Med Res 3: 168-176.
- Edmondston SJ, Singer KP, Price RI, Day RE, Breidahl PD (1994) The relationship between bone mineral density, vertebral body shape and spinal curvature in the elderly thoracolumbar spine: An in vitro study. Br J Radiol 67: 969-975.
- Ettinger B, Black DM, Palermo L, Nevitt MC, Melnikoff S (1994) Kyphosis in older women and its relation to back pain, disability and osteopenia: the study of osteoporotic fractures. Osteoporos Int 4: 55-60 .
- Huang MH, Connor BE, Greendale GA, Kado DM (2006) Hyperkyphotic posture and risk of future osteoporotic fractures: the Rancho Bernardo study. J Bone Miner Res 21: 419-423.
- Lee JS, Lee HS, Shin JK, Goh TS, Son SM (2013) Prediction of sagittal balance in patients with osteoporosis using spinopelvic parameters. Eur Spine J 22: 1053-1058.
- Pavlovic A, Nichols DL, Sanborn CF, Dimarco NM (2013) Relationship of thoracic kyphosis and lumbar lordosis to bone mineral density in women. Osteoporos Int 24: 2269-2273.
- Sinaki M, Itoi E, Rogers JW, Bergstralh EJ, Wahner HW (1996) Correlation of back extensor strength with thoracic kyphosis and lumbar lordosis in estrogen-deficient women. Am J Phys Med Rehabil 75: 370-374.
- Been E, Kalichman L (2014) Lumbar lordosis. Spine J 14: 87-97 .
- Gelb DE, Lenke LG, Bridwell KH, Blanke K, McEnery KW (1995)An analysis of sagittal spinal alignment in 100 asymptomatic middle and older aged volunteers. Spine 20: 1351-1358.
- Haddaway MJ, Davie MW, McCall IW (1992) Bone mineral density in healthy normal women and reproducibility of measurements in spine and hip using dual-energy X-ray absorptiometry. Br J Radiol 65: 213-217.
- Takeda N, Kobayashi T, Atsuta Y, Matsuno T, Shirado O, et al. (2009) Changes in the sagittal spinal alignment of the elderly without vertebral fractures: A minimum 10-year longitudinal study. J Orthop Sci 14: 748-753. <
- Tenne M, McGuigan F, Besjakov J, Gerdhem P, Akesson K (2013) Degenerative changes at the lumbar spine--implications for bone mineral density measurement in elderly women. Osteoporos Int 24: 1419-1428.
- Audorff UB, Brandenburg S, Brüning T, Dupuis H, Ellegast R, et al. (2005) Medical evaluation criteria for occupational diseases of the lumbar spine related to the intervertebral disc. Consensus recommendations for assessing the interrelationship as proposed by the interdisciplinary working group established by the HVBG Trauma Berufskrankh 7: 211-252.
- Lai K, Rencken M, Drinkwater BL, Chesnut CH (1993) Site of bone density measurement may affect therapy decision. Calcif Tissue Int 53: 225-228.
- Papadakis M, Papadokostakis G, Stergiopoulos K, Kampanis N, Katonis P (2009) Lumbar lordosis in osteoporosis and in osteoarthritis. Eur Spine J 18: 608-613 .
- Bernhardt M, Bridwell KH (1989) Segmental analysis of the sagittal plane alignment of the normal thoracic and lumbar spines and thoracolumbar junction. Spine 14: 717-721.
- Melton LJ, Atkinson EJ, O'Fallon WM, Wahner HW, Riggs BL (1991) Long-term fracture risk prediction with bone mineral measurements made at various skeletal sites. J Bone Miner Res 6 :146.
- Wasnich RD, Ross PD, Davis JW, Vogel JM (1989) A comparison of single and multi-site BMC measurements for assessment of spine fracture probability. J Nucl Med 30: 1166-1171.
- Cummings SR, Bates D, Black DM (2002) Clinical use of bone densitometry: A scientific review. JAMA 288: 1889-1897.
- Mika A, Unnithan VB, Mika P (2005) Differences in thoracic kyphosis and in back muscle strength in women with bone loss due to osteoporosis. Spine 30: 241-246.
- Greendale GA, Nili NS, Huang MH, Seeger L, Karlamangla AS (2011) The reliability and validity of three non-radiological measures of thoracic kyphosis and their relations to the standing radiological Cobb angle. Osteoporos Int 22: 1897-1905.
Open Access Journals
- Aquaculture & Veterinary Science
- Chemistry & Chemical Sciences
- Clinical Sciences
- Engineering
- General Science
- Genetics & Molecular Biology
- Health Care & Nursing
- Immunology & Microbiology
- Materials Science
- Mathematics & Physics
- Medical Sciences
- Neurology & Psychiatry
- Oncology & Cancer Science
- Pharmaceutical Sciences


