Biomathematical Model Study on the Association between Liver Fibrosis Disease and Anti-fibrotic Therapies Characteristics
1College of Science, Hubei University of Technology, Wuhan, Hubei, China
2School of Information and Mathematics, Yangtze University, Jingzhou, Hubei, China
3Hospital, Hubei University of Technology, Wuhan, Hubei, China
- Corresponding Author:
- Bin Zhao
College of Science
Hubei University of Technology Wuhan
430070, Hubei, China
Tel: +86 130 2851 7572
E-mail: zhaobin835@nwsuaf.edu.cn
Received Date: July 24, 2018; Accepted Date: October 03, 2018; Published Date: October 08, 2018
Citation: Zhao B, Cao J, Jiang X (2018) Biomathematical Model Study on the Association between Liver Fibrosis Disease and Anti-fibrotic Therapies Characteristics. J Zoonotic Dis Public Health. Vol.2 No.2:6
Copyright: © 2018 Zhao B, et al. This is an open-access article distributed under the terms of the Creative Commons Attribution License, which permits unrestricted use, distribution, and reproduction in any medium, provided the original author and source are credited.
Abstract
Liver fibrosis was fully developed after CCl4 induction for 7 weeks in eight animals. Clinical pathologic parameters, four indicators of hepatic fibrosis in monkey showed similarly changes in human. All animals had liver fibrosis after 1.5 months of CCl4 induction, and liver fibrosis still existed after 9 months recovery periods, the fibrosis stages in most animals had no obvious regression without treatment. Biomathematical analysis of the liver fibrosis would aid to utilize the anti-fibrotic therapies and their derivatives for various biomedical applications.
Keywords
Liver fibrosis; Animal model; CCl4; Reverse
Introduction
Liver fibrosis is the final common stage of the most chronic liver diseases; it is caused by several factors which lead to a major worldwide health care burden. Over the decades, the understanding of the liver fibrosis disease was growing rapidly, several studies reported that this progress could be regressed or reversed, which give us a bright prospect in developing antifibrotic therapies. Clinical pathologic parameters, four indicators of hepatic fibrosis in monkey showed similarly changes in human.
Liver fibrosis was defined as an abnormal response of the liver to persistent injury, characterized by the excessive accumulation of collagenous extracellular matrices (ECMs) that lead to fibrotic process and wound healing [1-3]. After liver injury, the repair process begins in two distinct paths: [4-8].
Regenerative path – injured cells replaced by same type of cells
Connective tissue – replace normal parenchymal tissue in uncontrolled fashion (fibroplasias or fibrosis)
The unrestrained repair process of persisting injury resutling in damaged tissues or organs was substituted by profuse amount of ECM and ache from extensive pathological fibrosis [3]. The onset of liver fibrosis was in a subtle way continued with liver failure and end with a risk of liver cancer [9]. Orthotropic liver transplantation was the only effective therapy for the cirrhosis or hepatocellular carcinoma (end-stage liver disease) associated with mortality and morbidity [10]. The disadvantages of liver transplantation were the commitment of recipients to lifelong toxic immunosuppression, shortages of organ donors and recrudescence of the original disease in transplant recipients. Therefore, urgent effective antifibrotic treatments were required according to the medical needs [11,12].
In-vitro model (cell culture and human tissue culture) [13-15] and in-vivo experimental animal models were the two broad groups of liver fibrosis research work. In-vitro model were primed for the study of specific mediator and cell behavior but it cannot clearly review the event that occur in-vivo. For several decades, animal models had been used for fibrogenesis study and to validate anti-fibrotic effects of potential therapeutic approaches [16,17]. Animal models were authorized for: multiple sampling at strategic times during the development vs. resolution phases, comprehensive study of questions that may not be able to address in human studies and experimental testing with restriction of the minimal number of variables [18].
Animal model for the current liver fibrosis research was done in following categories:
The cholestatic mechanism that damage the biliary epithelium including surgical bile duct ligation model [19], gene knockout or transgenic model [20,21] dietary models by feeding with 3,5-diethoxycarbonyl-1,4dihydrocollidine (DDC) or α-naphthylisothiocyanate (ANIT) [22,23].
Induced by hepatotoxins such as carbon tetrachloride (CCl4) [24] thioacetamide (TAA) [25], or dimethylnitrosamine (DMN) [26] that belong into toxin-induced liver models.
Activated by metabolic liver injuries including both alcohol induced fibrosis and NASH-associated fibrosis [27-30].
Induced by autoimmune responses via injecting heterologous serum to elicit liver fibrosis [31].
Rodent animal models were used because it can mimic the liver fibrosis development but there are some differences between murine and human need such as: different marker molecules to identify corresponding immune cell subsets [32], different number and proportion of distinct immune cell populations in the liver and diversity in RNA expression is reflecting the fundamental physiological differences between mice and humans [33]. Subsets of circulating classical and non-classical monocytes exhibit different ratios in humans (90%:10%) and mice (50%:50%) [34]. High-fat diet and/or CCl4 induced rodent liver fibrosis was widely investigated [24,35]. Nonhuman primate’s animal models were found to be irreplaceable because of similar anatomical, genetical and physiological features to humans and in the way few studies reported of monkey liver fibrosis. Alcohol induced liver fibrosis models (3 years) were also developed in rhesus monkeys [36]. Another 16 weeks study was carried out with combined CCl4 subcutaneous dosing with chronically fed highfat diet and alcohol in drinking water to establish liver fibrosis model in cynomolgus monkeys [37]. So, in order to develop a non-alcoholic liver fibrosis monkey model with a single stimulus within a reasonable time frame, CCl4 through the portal vein were chosen selectively to target the liver.
Materials and Method
Animal and husbandry
Cynomolgus monkeys (3-6 years, 3-7 kg) were provided by Hainan Jingang Biotech Co., Ltd, China. All animals were single-housed in stainless steel cages equipped with a bar type floor and an automatic watering valve, these cages conform to standards set forth by the US Animal Welfare Act. The rooms were controlled with humidity at 40% to 70%, temperature at 18°C to 29°C, 10 to 20 air changes/hour and 12-hour light/dark. Regular or high fat diet and fresh fruit were fed daily. Protocols for all the animal studies were approved by the Institutional Animal Care and Use Committee (IACUC) (WuXi AppTec Co., Ltd, Suzhou, Jiangsu province, The People’s Republic of China).
Reagent and food
Analytical Grade reagent CCl4 (catalog no. 20050521, Sinopharm Chemical Reagent Co., Ltd, The People’s Republic of China.), PEG 400 (catalog no. MKBG7718V). Ketamine hydrochloride (catalog no. 1507293, Fujian Gutian Pharma Co., Ltd, The People’s Republic of China).
Experiment
Animals had portal vein cannulation surgery. Briefly, animals were anesthetized through trachea intubation with isoflurane during surgery, the animals lied on its back and general sterilized in operation area, exposed portal vein and selected a branch of mesenteric vein at the far end. PE catheter was cannulated into the portal vein. After securing the catheter, the other end of catheter was connected with a heparin cap to confirm the catheter unobstructed. The heparin cap was placed in muscle layer subcutaneously. After a 20-28 days recovery period, the animals were ready to use.
Eight convalescent portal vein cannulated animals were assigned into this experiment. Animals were dosed with CCl4 formulated in polyethylene glycol (PEG) 400 (400 mL/L) via intravenous bolus injection into portal vein. Animals were received escalating dosage at 0.1 mL/kg once weekly, 0.1 mL/kg twice weekly and 0.15 mL/kg twice weekly (Figure 1), all animals were put into recovery phase after the last dose.

Figure 1: Dose schedule of CCl4 during model induction phase.
Blood samples were collected before and weeks 1, 2, 4, 6, 8, 12, 24, 46 after first dosing, all blood samples were collected from a peripheral vessel into commercially available tubes containing Potassium (K2) EDTA or plain with separating gel before CCl4 dosing on the specified day. Serum samples were stored at -60 degree or lower until analysis.
Liver biopsy and ultrasound B examination were conducted in this experiment. Animals were anesthetized with ketamine hydrochloride (10 mg/kg), lied on his back, sterilized appropriately, used ultrasound B (Vet-M7, Mindray) to keep away from big vessel and gall bladder, and then inserted auto biopsy gun (acecut 14G x 115 mm, TSK, Japan) to collect liver tissue. After the procedure, animals were observed daily by experienced technician till its recovery.
Sample analysis
Whole blood samples (anti-coagulation EDTAK2) for hematological parameters were analyzed by an automatic analyzer (ADVIA 2120, Siemens). Serum samples for clinical chemistry parameters were detected by an automatic analyzer (HITACHI 7180, Hitachi High-Tech Science Systems Corporation). Serum samples for four indicators of hepatic fibrosis laminin (LN), hyaluronic acid (HA), collagen type IV (CIV), and N-terminal propeptide of collagen III (PIIINP)) parameters were determined through radio immunoassay (RIA) method in ADC CLIA 400 automatic plate immunoassay analyzer (Autobio).
Pathological examinations
Liver tissue or biopsy samples were fixed in 10% formaldehyde, trimmed, processed, embedded in paraffin, sectioned, stained with hematoxylin and eosin and sirius red staining, and then examined microscopically. Liver fibrosis is classified by using Metavir system [38]: No fibrosis (F0), Fibrous portal expansion (F1), Few bridges or septa (F2), numerous bridges or septa (F3) and Cirrhosis (F4) (Table 1).
| Stage | Histologic description |
|---|---|
| 0 | No fibrosis |
| 1 | Zone 3 perisinusoidal fibrosis only |
| 2 | Zone 3 plus portal/periportal fibrosis |
| 3 | As above with bridging fibrosis |
| 4 | Cirrhosis |
Table 1: Simple grading and staging systems for liver fibrosis [1].
Bio Mathematical Models and Explanations
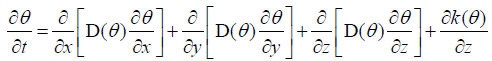
First of all, we introduce a form of Richards’s equations as follows:
 3.1
3.1
Where D(θ) denotes water diffusivity; K(θ) denotes hydraulic conductivity; t denotes time; denotes liver fibrosis content; x, y, z denote coordinate axes.
If the liver fibrosis content is lower than the saturated (unsaturated) fibrosis content with little change, we take as D(θ) = a , where a is a constant.
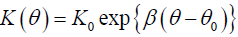
We assume that unsaturated hydraulic conductivity is calculated by using the Libardi method, that is
 3.2
3.2
Where β is a constant; K0 and θ0 are the values of K and during steady-state infiltration, respectively.
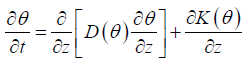
Next, we have intend to simplify equation (3.1), in other words, here we only consider the case that liver fibrosis flows in the vertical direction, and therefore we have
 3.3
3.3
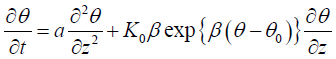
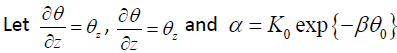
By substituting D(θ) = a and equation (3.2) into equation (3.3), hence the following semi-empirical Richards equation is obtained:
 3.4
3.4
Then, by make use of the (G′ /G) expansion method, we obtain an exact solution for the equation (3.4), however, we omit the description of the (G′ /G) expansion method.
 , then the equation
(3.4) can be equivalently changed into
, then the equation
(3.4) can be equivalently changed into
 3.5
3.5
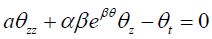
Using the travelling wave variable θ (z,t ) =θ (ξ ) and ξ = z −ωt carries out the equation (3.5) into an ordinary differential equation for θ =θ (ξ)
 3.6
3.6
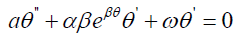
In order to apply the (G′ /G) -expansion method, we use the Painlevé transformation v = eβθ, or equivalently
 hence the equation (3.6) can be written as
 3.7
3.7
Suppose that the solution of ordinary differential equation (3.7) can be expressed by a polynomial in (G / G) as follows:
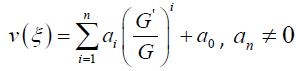 3.8
3.8
where G = G(ξ ) satisfies the second order differential equation in the form
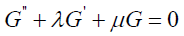 3.9
3.9
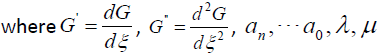 are real constants to
be determined later.
are real constants to
be determined later.
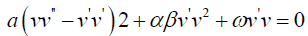
According to the (G′ /G) - expansion method, considering the homogeneous balance between vv'' and v'v2 in the equation (3.7), we get 3n +1 = 2n + 2⇒n =1, hence we can write (3.8) as
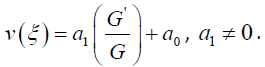 3.10
3.10
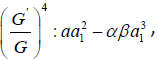
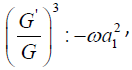
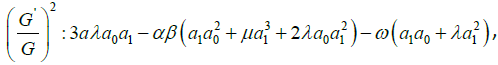
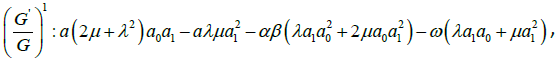
Substituting (3.10) along with (3.9) into (3.7) and collecting all terms with the same order of
 together, the left-hand
side of (3.7) are converted into polynomial in
together, the left-hand
side of (3.7) are converted into polynomial in
. Setting
each coefficient of each polynomial to zero, we derive a set of
algebraic equations for λ,μ,ω, a0, a1, as follows:
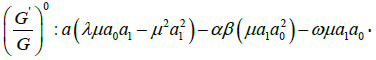
Solving the algebraic equations above yields
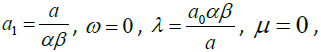 3.11
3.11
where a0 is arbitrary constant.
By using (3.11), (3.10) can be written as
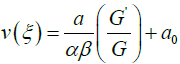 3.12
3.12
where ξ = z .
Substituting the general solutions of equation (3.9) into (3.12), we have an exact solution of the equation (3.7) as follows:
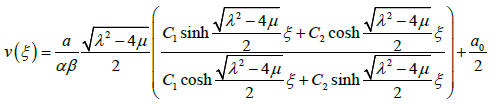 3.13
3.13

C2 , a , β and a0 are arbitrary constants.
Therefore by
 we have an exact solution of the
equation (3.4) as follows:
we have an exact solution of the
equation (3.4) as follows:
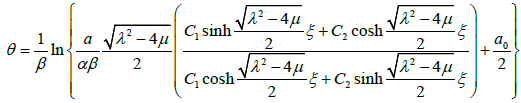 3.14
3.14
According to what has been discussed above, we assume that liver fibrosis content, PPARγ and Nrf2 satisfy
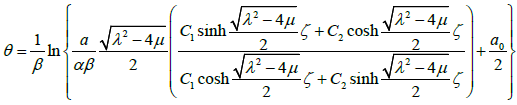 3.15
3.15
where ζ =δ z −ε t , δ ,ε are arbitrary constants.
The Biomathematical models showed that liver fibrosis could be established by only given CCl4, which testify the hypothesis. In current stage, many technology could assist diagnose liver fibrosis, but no one indicator can diagnosis the diseases except for pathological result. And the above monkey Biomathematical model is a better system to explore the prevention and treatment of chronic liver diseases and develop new diagnostic techniques and novel treatment.
Results
Monkeys were dosed for up to 7 weeks, total CCl4 dose volumes were from 1.43 to 3.46 ml. All the animals entered into recovery phase after last dosing. The mean animal body weight (4.61 ± 0.56 kg) decreased about 9% (4.20 ± 0.48 kg) on week 7, but increased to 4.82 ± 0.42 kg and 5.45 ± 0.52 kg at 6 and 12 months respectively (Figure 2).

Figure 2: Animal body weight changes in this study (n=8).
Values are expressed as the mean ± SEM.
Liver enzymes Aspartic Transaminase (AST), Alanine Aminotransferase (ALT), Alkaline Phosphatase (ALP), Gammaglutamyl Transpeptidase (GGT) concentration were increased significantly after CCl4 induction, the mean peak levels were 77.6 ± 9.37 U/L, 1071 ± 146 U/L, 1482 ± 453 U/L and 151 ± 29.3 U/L respectively (Figure 3). Total Bilirubin (TBIL) level was increased and reached to peak (8.4 ± 1.64 μmol/L) at week 4. The total protein (TP), albumin (ALB) and albumin/globulin (A/G) ratio were declined 11% (70.2 ± 1.98 g/L), 25% (31.2 ± 1.26 g/L) and 41% (0.69 ± 0.11) after dosing of CCl4 (Figure 4). All changed values returned gradually to normal in recovery period. Other clinical chemistry parameters do not change significantly.

Figure 3: Sequential changes of liver enzymes in the process of liver fibrosis (n=8). Values are expressed as the mean ± SEM.

Figure 4: Sequential changes of other clinical pathologic parameters in the process of liver
Fibrosis (n=8). Values are expressed as the mean ± SEM.
Whole hematology parameters including red blood cell, white blood cell, hemoglobin and other related items were in normal range during this experiment.
The HA, LN, and PIIINP parameters were increased from 72.8 ± 21.6 ng/mL to 136 ± 32.0 ng/mL, 201 ± 16.9 ng/mL to 299 ± 28.8 ng/mL, 26.1 ± 5.27 ng/mL to 49.5 ± 5.94 ng/mL after CCl4 induction respectively. HA and LN level restored to normal after a recovery periods, but the PIIINP value was still higher at week 24 than baseline (Figure 5). The mean CIV value was 34 ng/mL in week 4, beside that all the other CIV values were below the limit of quantitation (15 ng/mL).

Figure 5: Indicators of hepatic fibrosis curve in cymonolgus monkeys pre and post CCl induction (n=8). Values are expressed as the mean ± SEM.
Pathology examination in liver biopsy samples showed that fibrosis was found for all animals (Figure 6). Liver fibrosis were existed persistently during the recovery period (Table 2), it did not cure naturally without treatment. Irregular or nodular surface and blunt edges in liver were observed under ultrasound B examination (Figure 7).

Figure 6: Pathological changes in liver tissue (200 X). The pictures sirius red staining (A) and HE staining (D) are presented F3, which the formed numerous bridges or septa, small number of pigmented macrophages (hemosiderin) and mononuclear inflammatory cells were observed. The pictures (B, E) are presented F2, few bridges or septa with inflammatory cells. And the pictures (C, F) are normal liver.
| Animal | 1.5 months | 3 months | 6 months | 11 months |
|---|---|---|---|---|
| 1 | 1 | 2 | 2 | 1 |
| 2 | 3 | 3 | 3 | 2 |
| 3 | 3 | 2 | 2 | 2 |
| 4 | 3 | 4 | 4 | 3 |
| 5 | 2 | 2 | 2 | 2 |
| 6 | 2 | 3 | 3 | 3 |
| 7 | 2 | 1 | 2 | 3 |
| 8 | 2 | 2 | 2 | 2 |
Table 2: Liver fibrosis stages for individual animal at different months after initial CCl4 dosing.

Figure 7: Ultrasound liver images before induction, 1.5 months, 3 months, 11 months after induction. a) Clear liver edge, smooth envelope, uniform echo from liver parenchyma, the structure and track of vessels are normal. b) Obtuse and thick liver edge, parenchyma echo coarsened, increased liver volume and expansive portal vein. c) Enhanced punctiform echo in parenchyma, rough liver edge, the branch of portal vein is a bate and the vein wall is blur. d) Strong echo structure in parenchyma, thickening liver edge.
Aspartic Transaminase (AST)-77.6 ± 9.37 U/L Alanine Aminotransferase (ALT)-1071 ± 146 U/L Alkaline Phosphatase (ALP)-1482 ± 453 U/L Gamma-glutamyl Transpeptidase (GGT)- 151 ± 29.3 U/L Total Bilirubin (TBIL) - (8.4 ± 1.64 μmol/L) The total protein (TP), -11% (70.2 ± 1.98 g/L),
Albumin (ALB) 25% (31.2 ± 1.26 g/L) and
Albumin/globulin (A/G) 41% (0.69 ± 0.11)
The HA, parameters were increased from 72.8 ± 21.6 ng/mL to 136 ± 32.0 ng/mL,
LN-201 ± 16.9 ng/mL to 299 ± 28.8 ng/mL, 2
PIIINP-26.1 ± 5.27 ng/mL to 49.5 ± 5.94 ng/mL after CCl4 induction respectively.
Discussion
The kinetics of fibrosis development can be roughly divided into three phases: acute injury, initiation of fiber formation and advanced fibrosis [39]. CCl4 was metabolized by hepatocytes and thus produce toxic trichloromethyl (CCl3) radicals by CYP2E1, an enzyme expressed in perivenular hepatocytes. An acute Centro lobular necrosis triggers a wound healing response as: 1. recruitment of phagocytic and inflammatory cells to clear necrotic zones, 2. activation of fibrogenesis and increased ECM, 3. proliferation of parenchymal and non-parenchymal cells to replace dead cells. When the result is repeated, successive rounds of wound healing occur prior to resolution of the previous one resulting in fibrosis accumulation [18]. CCl4 administration via portal vein develop liver fibrosis, induce hemolysis and liver cell necrosis that reduce the liver's ability to metabolize and excrete bilirubin leading to a buildup of unconjugated bilirubin in the blood.
Liver fibrosis evaluation methods can be divided into invasive and non-invasive [40]. Non-invasive method includes serum tests, RNA expression analysis and imaging techniques. These methods may be performed repeatedly, allowing for ongoing monitoring of potential fibrosis in vivo [41]. In this study, the mean ALT was increased almost 20-fold after administrating CCl4. ALT was released from liver tissue into the circulation in proportion to the degree of hepatocellular damage. Its level is thought to be one of the most sensitive markers of liver injury and liver disease progression [42]. Mean AST level increased less than 3-fold after CCl4 induction. ALT is predominantly found in the liver, with clinically negligible quantities found in the kidneys, heart, and skeletal muscle. In contrast, AST is found in the liver, heart (cardiac muscle), skeletal muscle, kidneys, brain, and red blood cells. Therefore, ALT is a more specific indicator of liver damage than AST. The increasing of four liver enzymes AST, ALT, ALP, GGT levels and TBIL indicate liver toxicity.
ALB and TP, and A/G ratio were decreased. ALB was produced in the liver; impaired liver cannot synthesize effectively and maintain ALB level. Whereas, globulins are produced in the liver or immune system. This might be the reason why GLB was not changed during CCl4 induction. The ratio of AST/ALT>1 (AAR) had been proposed as a test of cirrhosis in human [43], while other study demonstrate that AST/ALT ratio was confounded when used in alcoholic and many other acute and chronic fatty infiltrating liver diseases [44], and not recommended for evaluation the stage of fibrosis. Among the monkeys were diagnosed as liver fibrosis, the AST/ALT ratios were below 1.0 throughout the study.
The processes of liver fibrosis were characterized mainly by cellular activation of hepatic stellate cells (HSCs) and were able to express and deposit large quantities of extracellular matrix components [45,46]. Liver ECM components include collagen type I, III, and IV, fibronectin, undulin, elastin, laminin, hyaluronan, and proteoglycans were higher than normal in advanced stage [47]. HA, LN, PIIINP were increased, those were consistent with previous studies [48-50]. But N-terminal pro-peptide of collagen type III (PIIINP) level also elevated in chronic pancreatitis [44] and HA levels may be elevated after meal or glucose drink [51] and were not specific for liver fibrosis.
The ideal biomarker was specific for liver, readily available and standardized between all laboratories performing diagnostic biochemistry/hematology, not subject to false positive results, for example due to inflammation and identifies the stage of fibrosis [52]. Currently, no non-invasive markers were specific and capable of providing accurate information about fibrogenesis and the extent of fibrosis in the liver. The utility of serum models such as Fibrotest [53], Fibro meter [54], Fibrospect [55], Hepascore [56] were used to predict fibrogenesis, but currently cannot replace the gold-standard method liver biopsy [57]. Fibrosis stage was assessed by Metavir (stage 0-4) score. We found that increased fibrillar eosinophilic material (H&E stained slides) and red Sirius Red stained were noted in the periportal (centroacinar) area, this change generally limited to individual lobules, but also with extension from one portal tract to another (bridging fibrosis), in addition, small number of pigmented macrophages (hemosiderin) and mononuclear inflammatory cells were present.
However, there were some limitations when using liver biopsy evaluation. Firstly, hepatic fibrosis may not be homogenous throughout the liver, the size of biopsy specimen is not large enough to contain whole hepatic lobule, and it only represents a tiny fraction of organ. Sampling error (25%-40%) may result in poor reproducibility [58]. Secondly, it’s an invasive procedure that caused pain and major complication occurring in 40% and 0.5% of patients, respectively [59]. Thirdly, there was well known observer variability amongst pathologists in categorizing the degree of fibrosis, no matter how precisely defined the stage [60]. The liver fibrosis scores minor changed in different months in our experiment, it mainly depend on the liver biopsy sample size and sampling location, some histopathologic images including whole hepatic lobules which contribute to making judgment, and it’s really challenge to evaluate the fibrosis score in images with partial hepatic lobule. Increasing the biopsy sample numbers may decrease the erroneous judgment, but noting that biopsy is an invasive procedure.
Many imaging techniques have emerged for liver fibrosis detection and assessment, such as ultrasound [61] computed tomography (CT) [62] and magnetic resonance imaging (MRI) [63]. The image of ultrasound B showed clearly changes during the induction in our study, but it only produces specific findings, with very limited sensitivity and cannot assess the fibrosis stage, especially in early and intermediate stages. CT and MRI have the same problem [64,65].
All in all, it would be better to combine both non-invasive and invasive method for comprehensive assessment of the liver stage. Liver fibrosis reversal is still a debated topic. When administrating of neutralizing TIMP1-specific antibody decreases the collagen content in CCl4-induced fibrosis [53] and the reversibility of fibrosis was found in experimentally induced cholestasis in rat [56]. In humans, spontaneous resolution of liver fibrosis can occur after successful treatment of the underlying disease. Hepatitis C caused liver fibrosis could be reverse after treatment [54]. It may take years for significant regression to be achieved, the time course varies depending on the underlying cause of the liver disease and its severity. Some experimental evidence suggests cirrhosis might reach a point of no return. Using the CCl4-intoxication rat model of liver fibrosis, the remodeling of advanced cirrhosis is limited and the liver remains cirrhotic even after a very protracted recovery period [55]. Our study indicates the same process after 9-month recovery period, liver fibrosis remain existing. In the other hand, it means a long term therapeutic window using this model.
Conclusion
Liver fibrosis represents a classical outcome of many chronic liver diseases. Animal models are being used for several decades to study fibro genesis and to evaluate the anti-fibrotic potential of therapies and strategies. Previous study demonstrated that monkeys and human have similar liver architecture including hepatocyte, portal regions, bile duct, portal vein and liver veins [66]. Our study showed that liver fibrosis could be established by only given CCl4, which testify the hypothesis. In current stage, many technologies could assist diagnose liver fibrosis, but no one indicator can diagnosis the diseases except for pathological result. The monkey model was found to be a better system to explore the prevention and treatment of chronic liver diseases and develop new diagnostic techniques and novel treatment.
Conflict of Interest
We have no conflict of interests to disclose and the manuscript has been read and approved by all named authors.
Acknowledgments
We would like to express my gratitude to all those who helped us during the writing of this article.
References
- Anthony PP, Ishak KG, Nayak NC, Poulsen HE, Scheuer PJ, et al. (1977) The morphology of cirrhosis: definition, nomenclature, and classification. Bull World Health Organ 55: 521-540.
- Friedman SL (2008) Mechanisms of hepatic fibrogenesis. Gastroenterology 134: 1655-1669.
- Hayashi H, Sakai T (2011) Animal models for the study of liver fibrosis: new insights from knockout mouse models. Am J Physiol Gastrointest Liver Physiol 300: G729-G738.
- Friedman SL (2004) Mechanisms of disease: Mechanisms of hepatic fibrosis and therapeutic implications. Nat Clin Pract Gastroenterol Hepatol 1: 98-105.
- Tomasek JJ, Gabbiani G, Hinz B, Chaponnier C, Brown RA, et al. (2002) Myofibroblasts and mechano-regulation of connective tissue remodeling. Nat Rev Mol Cell Biol 3: 349-363.
- Liu T, Wang X, Karsdal MA, Diana J (2012) Leeming and Federica Genovese. Molecular Serum Markers of Liver Fibrosis. Biomark Insights 7: 105-117.
- Wynn TA (2007) Common and unique mechanisms regulate fibrosis in various fibro proliferative diseases. J Clin Invest 117: 524-529.
- Wynn TA (2008) Cellular and molecular mechanisms of fibrosis. Am J Pathol 214: 199-210.
- Gines P, Cardenas A, Arroyo V, Rodes J (2004) Management of cirrhosis and ascites. N Engl J Med 350: 1646-1654.
- Davis GL, Albright JE, Cook SF, Rosenberg DM (2003) Projecting future complications of chronic hepatitis C in the United States. Liver Transpl 9: 331-338.
- Iredale JP (2003) Cirrhosis: new research provides a basis for rational and targeted treatments. BMJ 327: 143-147.
- Fallowfield JA, Iredale JP (2004) Targeted treatments for cirrhosis. Expert Opin Ther Targets 8: 423-435.
- Friedman SL, Rockey DC, McGuire RF, Maher JJ, Boyles JK, et al. (1992) Isolated hepatic lipocytes and Kupffer cells from normal human liver: morphological and functional characteristics in primary culture. Hepatology 15: 234-243.
- Geerts A (2001) History, heterogeneity, developmental biology, and functions of quiescent hepatic stellate cells. Semin Liver Dis 21: 311-336.
- Benyon RC, Iredale JP, Goddard S, Winwood PJ, Arthur MJP, et al. (1996) Expression of tissue inhibitor of metalloproteinase 1 and 2 is increased in fibrotic human liver. Gastroenterology 110: 821-831.
- Constandinou C, Henderson N, Iredale JP (2005) Modeling liver fibrosis in rodents. Methods Mol Biol 117: 237-250.
- Tsukamoto H, Matsuoka M, French SW (1990) Experimental models of hepatic fibrosis: a review. Semin Liver Dis 10: 56-65.
- Starkel P, Leclercq IA (2011) Animal models for the study of hepatic fibrosis. Best Pract Res Clin Gastroenterol 25: 319-333.
- Heinrich S, Georgiev P, Weber A, Vergopoulos A, Graf R, et al. (2011) Partial bile duct ligation in mice: a novel model of acute cholestasis. Surgery 149: 445-451.
- Gershwin ME, Oertelt S, Lian ZX, Cheng CM (2006) Anti-mitochondrial antibodies and primary biliary cirrhosis in TGF-β receptor II dominant-negative mice. J Immunol 177: 1655-1660.
- Gershwin ME, Wakabayashi K, Lian ZX, Moritoki Y (2006) IL-2 receptor α−/− mice and the development of primary biliary cirrhosis. Hepatology 44: 1240-1249.
- Sullivan BP, Cui W, Copple BL, Luyendyk JP (2012) Early growth response factor-1 limits biliary fibrosis in a model of xenobiotic-induced cholestasis in mice. Toxicol Sci 126: 267-274.
- Trauner M, Fickert P, Stoger U, Fuchsbichler A (2007) A new xenobiotic-induced mouse model of sclerosing cholangitis and biliary fibrosis. Am J Pathol 171: 525-536.
- Slater TF, Cheeseman KH, Ingold KU (1985) Carbon tetrachloride toxicity as a model for studying freeradical mediated liver injury. Philos 311: 633-645.
- Ding Z, Zhuo L (2013) Attenuation of hepatic fibrosis by an imidazolium salt in thioacetamide-induced mouse model. J Gastroenterol Hepatol 28: 188-201.
- Jenkins SA, Grandison A, Baxter JN, Day DW (1985) A dimethylnitrosamine-induced model of cirrhosis and portal hypertension in the rat. J Hepatol 1: 489-499.
- Gea VH, Friedman SL (2011) Pathogenesis of liver fibrosis. Annu Rev Pathol 6: 425-456.
- Rinella ME, Green RM (2004) The methionine-choline deficient dietary model of steatohepatitis does not exhibit insulin resistance. J Hepatol 40: 47-51.
- Sahai A, Malladi P, Pan X, Paul R, Aldana HM, et al. (2004) Obese and diabetic db/db mice develop marked liver fibrosis in a model of nonalcoholic steatohepatitis: role of short-form leptin receptors and osteopontin. Am J Physiol Gastrointest Liver Physiol 287: 1035-1043.
- Tsukamoto H, Towner SJ, Ciofalo LM, French SW (1986) Ethanol-induced liver fibrosis in rats fed high fat diet. Hepatology 6: 814-822.
- Baba Y, Saeki K, Onodera T, Doi K (2005) Serological and immune histochemical studies on porcine-seruminduced hepatic fibrosis in rats. Exp Mol Pathol 79: 229-235.
- Yang SQ, Lin HZ, Lane MD, Clemens M, Diehl IS (1997) Obesity increases sensitivity to endotoxin liver injury: implications for the pathogenesis of steatohepatitis. Proc Natl Acad Sci USA 94: 2557–2562.
- Lin S (2014) Comparison of the transcriptional landscapes between human and mouse tissues. Proc Natl Acad Sci USA 111: 17224-17229.
- Heitbrock LZ, Randolph GJ, Ingersoll MA, Spanbroek R (2010) Comparison of gene expression profiles between human and mouse monocyte subsets. Blood 115: e10-e19.
- Xu ZJ, Fan JG, Ding XD (2010) Characterization of High-Fat, Diet-Induced, Non-alcoholic Steatohepatitis with Fibrosis in Rats. Dig Dis Sci 55: 931-940.
- Weizhi J, Wei S, Wang H (2015) Rhesus monkey model of liver disease reflecting clinical disease progression and hepatic gene expression analysis. Sci Rep 5: 15019.
- Ding K (2014) Establishment of a liver fibrosis model in cynomolgus monkeys. Exp Toxicol Pathol 66: 257-261.
- Bedossa P, Poynard T (1996) An algorithm for the grading of activity in chronic hepatitis C. The METAVIR Cooperative Study Group. Hepatology 24: 289-293.
- Liedtke C (2013) Experimental liver fibrosis research: update on animal models legal issues and translational aspects. Fibrogenesis & Tissue Repair 6: 19.
- Ahmad W, Ijaz B, Gull S (2011) A brief review on molecular, genetic and imaging techniques for HCV fibrosis evaluation. Virol J 8: 53.
- Zhou K, Lu LG (2009) Assessment of fibrosis in chronic liver diseases. J Dig Dis 10: 7-14.
- Daxboeck F, Gattringer R, Mustafa S, Bauer C, Assadian O (2005) Elevated serum alanine aminotransferase (ALT) levels in patients with serologically verified Mycoplasma pneumonia pneumonia. Clin Microbiol Infect 11: 507-510.
- Giannini E, Risso D, Botta F (2003) Validity and clinical utility of the aspartate amino transferaseal anine amino transferase ratio in assessing disease severity and prognosis in patients with hepatitis C virus related chronic liver disease. 163: 218-24.
- Lohr M, Hummel F, Martus P, Cidlinsky K, Kröger JC, et al. (1999) Serum levels of extracellular matrix in acute pancreatitis. Hepatogastroenterology 46: 3263-3270.
- Friedman SL (2008) Hepatic stellate cells: protean multifunctional and enigmatic cells of the liver. Physiological Reviews 88: 125-172.
- Tacke F, Weiskirchen R (2012) Update on hepatic stellate cells: pathogenic role in liver fibrosis and novel isolation techniques. Expert Rev Gastroenterol Hepatol 6: 67-80.
- Bataller R, Brenner DA (2005) Liver fibrosis. J Clin Invest 115: 209-218.
- Leeming DJ, Nielsen MJ, Dai Y, Veidal SS, Vassiliadis E, et al. (2012) Enzyme-linked immunosorbent serum assay specific for the 7S domain of Collagen Type IV (P4NP 7S): A marker related to the extracellular matrix remodeling during liver fibrogenesis. Hepatology Research 42: 482-493.
- Rosenberg WM, Voelker M, Thiel R, Becka M, Burt A, et al. (2004) Serum markers detect the presence of liver fibrosis: a cohort study. Gastroenterology 127: 1704-1713.
- Stickel F, Poeschl G, Schuppan D, Conradt C, Hesse AS, et al. (2003) Serum hyaluronate correlates with histological progression in alcoholic liver disease. Eur J Gastroenterol Hepatol 15: 945-50.
- Fraser JR, Gibson PR (2005) Mechanisms by which food intake elevates circulating levels of hyaluronan in humans. J Intern Med 258: 460-466.
- Rossi E, Adams LA, Bulsara M, Jeffrey GP (2007) Assessing Liver Fibrosis with Serum Marker Models. Clin Biochem Rev 28: 3-10.
- Roeb E, Behrmann I, Grotzinger J, Breuer B, Matern S, et al. (2000) An MMP-9 mutant without gelatinolytic activity as a novel TIMP-1 antagonist. FASEB Journal 14: 1671-1673.
- Arthur MJ (2002) Reversibility of liver fibrosis and cirrhosis following treatment for hepatitis C. Gastroenterology 122: 1525-1528.
- Issa R, Zhou X, Constandinou CM, Fallowfield J (2004) Spontaneous recovery from micronodular cirrhosis: evidence for incomplete resolution associated with matrix cross linking. Gastroenterology 126: 1795-1808.
- Abdel-Aziz G, Lebeau G, Rescan PY, Clément B, Rissel M, et al. (1990) Reversibility of hepatic fibrosis in experimentally induced cholestasis in rat. Am J Pathol 137: 1333-1342.
- Afdhal NH, Nunes D (2004) Evaluation of liver fibrosis: a concise review. Am J Gastroenterol 99: 1160-1174.
- Ratziu V, Charlotte F, Heurtier A, Gombert S, Giral P et al. (2005) Sampling variability of liver biopsy in nonalcoholic fatty liver disease. Gastroenterology 128: 1898-1906.
- Thampanitchawong P, Piratvisuth T (1999) Liver biopsy: complications and risk factors. World J Gastroenterol 5: 301-304.
- Zachary D, Goodman (2007) Grading and staging systems for inflammation and fibrosis in chronic liver diseases. J Hepatol 47: 598-607.
- Horng MH (2007) An ultrasonic image evaluation system for assessing the severity of chronic liver disease, Computerized Medical Imaging and Graphics 31: 485-491.
- Gómez MR, González EG, Madrazo A, Valencia MV, Rodrigo L, et al. (2008) Optical Analysis of Computed Tomography Images of the Liver Predicts Fibrosis Stage and Distribution in Chronic Hepatitis C. Hepatology 47: 810-816.
- Aguirre DA, Behling CA, Alpert E, HassaneinTI, SirlinCB, et al. (2006) Liver fibrosis: noninvasive diagnosis with double contrast material-enhanced MR imaging. Radiology 239: 425-437.
- Cohen EI, Wilck EJ, Shapiro RS (2006) Hepatic imaging in the 21st century. Seminars in Liver Disease 26: 363-372.
- Hussain SM, Semelka RC (2005) Hepatic imaging: comparison of modalities. Radiologic Clinics of North America 43: 929-947.
- Pang R, Liu J, He J (2005) Establishment and evaluation of macaque liver fibrosis model. World Chin J Digestol 13: 1956-1958.

Open Access Journals
- Aquaculture & Veterinary Science
- Chemistry & Chemical Sciences
- Clinical Sciences
- Engineering
- General Science
- Genetics & Molecular Biology
- Health Care & Nursing
- Immunology & Microbiology
- Materials Science
- Mathematics & Physics
- Medical Sciences
- Neurology & Psychiatry
- Oncology & Cancer Science
- Pharmaceutical Sciences