ISSN : 2349-3917
American Journal of Computer Science and Information Technology
TQWT Based Features for Classification of ALS and Healthy EMG Signals
Kiran PU, Abhiram N, Taran S and Bajaj V*
Department of PDPM, Indian Institute of Information Technology Design and Manufacturing, Jabalpur, 482005, India
- *Corresponding Author:
- Bajaj V
Department of PDPM, Indian Institute of Information Technology Design and Manufacturing, Jabalpur, 482005, India
E-mail: bajajvarun056@yahoo.co.in
Received date: March 26, 2018; Accepted date: April 10, 2018; Published date: April 17, 2018
Citation: Kiran PU, Abhiram N, Taran S, Bajaj V (2018) TQWT Based features for classification of ALS and healthy EMG signals. Am J Compt Sci Inform Technol Vol.6 No.2:19. DOI: 10.21767/2349-3917.100019
Copyright: © 2018 Kiran PU, et al. This is an open-access article distributed under the terms of the Creative Commons Attribution License, which permits unrestricted use, distribution, and reproduction in any medium, provided the original author and source are credited.
Abstract
Amyotrophic lateral sclerosis (ALS) is a disease, affects the nerve cells in brain and spinal cord that controls the voluntary action of muscles, which identification can be possible by processing electromyogram (EMG) signals. This study focuses on the extraction of features based on tunable-Q factor wavelet transform (TQWT) for classifying ALS and healthy EMG signals. TQWT decomposes EMG signal into sub-bands and these sub-bands are used for extraction of statistical features namely mean absolute deviation (MAD), interquartile range (IQR), kurtosis, mode, and entropy. The obtained features are tested on k-Nearest Neighbour and least squares support vector machines classifiers for the classification of ALS and healthy EMG signals. The proposed method obtained better classification results as compared to other existing methods.
Keywords
Tunable Q-factor Wavelet Transform, ALS EMG signals, k-Nearest Neighbour (k-NN)
Introduction
Electromyography is recording and evaluating the electrical activities during contraction and relaxation of striated muscles. The obtained electrical signal is called as electromyogram (EMG). EMG is being used in many fields such as exercise physiology, human factors, etc., [1]. In medical sciences, EMG is used for diagnosis of neuromuscular diseases based on the motor unit. Motor unit is a combination of muscle fibers and motor neurons. A motor neuron is a nerve cell originated in the spinal cord. Upper motor neurons are situated at brain which sends signals to lower motor neurons at spinal cord to control the muscular activities. Muscles present in eyes, tongue, and the whole face are under the control of lower motor neurons. The disorder of these motor neurons will create many diseases, mostly amyotrophic lateral sclerosis (ALS) [1]. It was first brought into international attention in 1939 because of Lou Gehrig’s speech at Yankee stadium, and so this disease is also called with his name. It results in the gradual degeneration and damage of nerve cells in the brain and spinal cord that controls the individual action of striated muscles. It results in twitching, cramping of muscles, slurred, nasal speech, and difficulty in chewing or swallowing. ALS generally affects people around the age group of 65 years and 50 years in case of inherited patients [2]. The manual analysis of ALS signals is a very monotonous task which requires professionals to diagnose. An automatic, accurate, and fast method is required to diagnose the ALS EMG signals.
The feature extraction process plays an important role for analysis and classification of EMG signals. The various time, frequency, and time-frequency domain features have been used for classifying EMG signals. Time domain features like autocorrelation, square integral, mean absolute value, variance and integrated EMG have been used for classification of ALS and healthy EMG signal [3,4]. Frequency domain features like total power, peak frequency, median frequency, and mean power have been explored for classification of ALS and healthy EMG signals [5]. Time-frequency domain features like root mean square (RMS), turns ratio, autoregressive coefficients have been used for classification of EMG signals [6]. The classification of ALS and healthy EMG signals has also been done through short time Fourier transform (STFT) [7].
Motor Unit Action Potentials (MUAPs) analysis and feature extraction was used with binary-support vector machine (SVM) classifier for the discrimination of ALS and healthy EMG signals [8]. Time-domain based features like autoregression (AR), waveform length, and mean absolute value were given as inputs to multilayer perceptron (MLP) and artificial neural network (ANN) classifiers for classifying ALS and healthy EMG signals [9]. The ensemble empirical mode decomposition (EEMD) decomposes EMG signal into set of intrinsic mode functions (IMFs), where the noisy IMFs separated using fast independent component analysis (ICA) algorithm and time domain features set used as input to linear discriminant analysis classifier for classification of EMG signals [10]. Mel-frequency cepstral coefficients (MFCCs) based methods were used for the extraction of features from higher order MUAPs of an EMG signal, the obtained feature set have been applied to the knearest neighbour (k-NN) classifier for classifying ALS and healthy EMG signals [11]. Spectral features like power spectral density, amplitude modulated bandwidth, and frequency modulated bandwidth were extracted by using improved empirical mode decomposition (IEMD) for classifying EMG signals [12]. A new hybridization of SVM with particle swarm optimisation (PSO) as PSO-SVM used for classifying EMG signals [13]. Multiscale principal component analysis (MSPCA) and discrete wavelet transform (DWT) have been used to extract the features and de-noising the EMG signal. The obtained features are applied to decision tree algorithms for classifying EMG signals [14].
Discrete cosine transform (DCT) is used to extract the features from one of the MUAPs having a dynamic range, and the obtained feature set has been given as input to the k-Nearest Neighbor classifier (k-NN) to classify EMG signals [15]. The coefficients obtained from autoregressive analysis have been given as input to neuro-fuzzy system for classifying EMG signals [16].
In this paper, tunable-Q factor wavelet transform (TQWT) based features are extracted for the classification of ALS and healthy EMG signals. TQWT decomposes EMG signal into subbands and features such as mean absolute deviation (MAD), interquartile range (IQR), kurtosis, mode, and entropy are extracted from the sub-bands. The obtained statistical features are fed as inputs to k-NN and LS-SVM classifiers to classify ALS and healthy EMG signals. The organization of the remaining paper is as follows: Section. 2 contain, ALS and healthy EMG signals dataset, the proposed methodology- TQWT, and features extraction will present. The results and discussions of classifying ALS and healthy EMG signals are in Section 3 and Section 4 conclude the paper.
Methodology
Dataset
The dataset comprises of 89 ALS and 133 healthy EMG signals which have been taken from, dataset R002 at https:// www.emglab.net [17]. It consists of two groups namely ALS and healthy. The healthy EMG dataset has been taken from 10 people of 21-37 years age, among them, females are 4 and males are 6, they didn’t have any kind of neuromuscular disorders. ALS dataset has been taken from 8 patients among them 4 are females and 4 are males whose age is between 35-67 years. Among the 8 patients taken, 5 have died within a few years. A standard needle electrode has been used for accession. Audio and Visual feedback has been used for monitoring the signal quality [18]. The EMG signal has been amplified at a frequency range of 5 Hz-5 kHz filter settings and sampled at a frequency of 10 kHz. Figure 1 shows the block diagram of proposed method explaining the whole method stepwise. Figure 2 shows the example of each of the ALS and healthy EMG signals.
The block diagram of proposed method is depicted in Figure 1.

Figure 1: Block Diagram of proposed methodology

Figure 2: The EMG signals: (a) ALS EMG signals (b) Healthy EMG signals
Tunable Q-factor wavelet transform (TQWT)
Recently, TQWT is one of the decomposition processes widely using in medical sciences as biomedical signal processing and vibration signals like seismic signals pro. According to [19], by comparing with other discrete-time wavelet transforms, TQWT is very easy and efficient method in terms of tuning the parameters. TQWT uses very efficient radix-2 FFT’s and filters having non-rational transfer functions like used in Fractional Spline Wavelet Transform (FSWT). In this study, TQWT decomposes the EMG signal into several high pass and low pass sub-bands. In this paper, we are using two-channel filter banks in 7-stages to decompose EMG signal. Each filter bank contains a low pass and a high pass filter with their respective scaling factors α and β. The first level filter bank takes EMG signal as input whose sampling frequency is fs which will give two outputs comprises of a low pass and a high pass subband whose sampling frequencies are αfs and βfs respectively. The low pass sub-band obtained from first stage filter bank will be the input for second level filter bank and it continues further upto 7 stages. Figure 3 (a) shows a 3-stage wavelet decomposition example and Figure 3 (b) shows first stage filter bank.

Figure 3: (a) Example of 3-stage wavelet Decomposition and (b) First stage Filter Bank.
The decomposition process by TQWT is mainly depends on three parameters, which are defined below.
Oversampling rate (redundancy): It is defined as the process of sampling a signal with its sampling frequency considerably greater than or equal to the Nyquist rate. It is denoted by r. In [18], Ivan Selesnick highly recommended taking r ≥ 3, and in [19], it is recommended to take 3 or 4. In this paper, we have taken redundancy value as 3.
Number of levels: J represents the number of stages (levels) used in TQWT. The J levels TQWT provides J+1 sub-bands.
Q-factor: It is a dimensionless parameter which characterizes a resonator bandwidth and center frequency. It is also known as Quality factor (Q). The Q-factor does not depend on the number of levels J [19]. It depends only on the filter bank parameter β. By considering these parameters, in this paper, we’ve decomposed EMG signal into 8 sub-bands, which are shown in Figure 4.
Figure 4: Sub-bands obtained after applying TQWT on EMG data
Features extracted from sub-bands of TQWT
The statistical features are computed from TQWT provided sub-bands for the classification of ALS and healthy EMG signals. The description of these features is as follows. Mean Absolute Deviation (MAD): It is used to describe the variation in EMG signal. The mean absolute deviation is defined as the mean of the distances of each data from their respective mean. MAD is defined as [20],
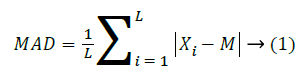
Where L is the total length of the dataset, Xi is the ith sample amplitude, and M is mean of the data.
Inter quartile range: It is defined as the measure of variability of the EMG signal which is based on dividing the whole dataset into quartiles, which is mathematically defined as [20],
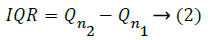
Where Qn1 and Qn2 are the 25th and 75th percentile of the data respectively.
Kurtosis: It is used to measure the sharpness of the peakedness in the probability density function (PDF) of a time series. It can be defined as [21],
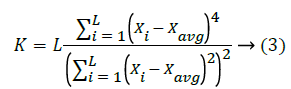
Where K is the kurtosis, L is the total length of the dataset, Xi is the ith sample amplitude, and Xavg is the average of the data.
Mode: It is defined as the data or a value which appears maximum number of times in a total dataset [21].
Entropy: It is usually referred to the uncertainty of a signal which is used to calculate the complexity of time domain signals. Entropy is defined as [20],
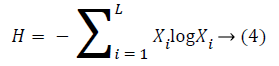
Where H is the entropy, Xi is the ith sample amplitude, and L is sequence length.
Classification
k-Nearest neighbour classifier (k-NN)
The k-NN is the easiest and efficient classifier to identify and classify different patterns [22], uses a distance function to classify the EMG groups i.e., ALS and healthy groups. This function computes the distance between the features which have applied on the given dataset and the neighbourhood EMG dataset of groups from both ALS and healthy [22,23]. The EMG signals then classified by observing the closest training group of every individual instance present in the training set. The k-NN classifier is also a type of instance learning based classifier in which the total classification will done among the nearest objects or instances in a training set [23]. The optimum value of k has been chosen for the classification EMG dataset into ALS and healthy groups. The distance function used in this proposed method is called as Euclidean distance, mathematically expressed in Eq (5) between two points p and q [24].

Where, x=(x1, x2,……….xn) and y= (y1, y2,…………yn) are the Cartesian coordinates in Euclidean n-space.
Least squares support vector machines (LS-SVM)
The TQWT based features are also tested on LS-SVM classifier for classification of ALS and healthy EMG signals. The LS-SVM is least squares variant of support vector machine supervised learning method. It is most commonly used for pattern recognition and classification of the data. For N input-output training instances {xi,yi}N i=1, the LS-SVM decision function can be defined as [25],
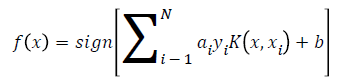
where ai, K(x,xi), and b are represent Lagrange multipliers, kernel function, and bias term, respectively. In this paper, the radial basis function (RBF) kernel is considered for LS-SVM classifier, which can be defined as [25],
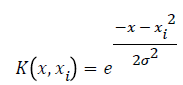
Where σ defines the width RBF kernel.
Results and Discussion
The TQWT decomposes EMG signals into different sub-bands. The TQWT parameters chosen for the decomposition of EMG signals are as follows: quality factor (Q) as 1, redundancy factor (r) as 3, and number of levels (J) as 7. As the number of levels has been set to 7, the number of sub-bands obtained is 8. These sub-bands represent the information of ALS and healthy EMG signals, in terms of high-frequency components and the lowfrequency components. The statistical measures of these subbands are used as features to classify ALS and healthy EMG signals. The statistical measures are MAD, IQR, kurtosis, mode, and entropy. For the classification of ALS and healthy EMG signals, statistical analysis of the features is presented in Tables 1 and 2 and Figures 5-9 by the range and p-value of KW test. In Figures 5 and 6 MAD and IQR features show lower value for ALS EMG signals for all sub-bands except lowest frequency, eighth sub-band. This could be happening because of the high variability of healthy EMG signals as compared to ALS EMG signals. Figure 7 and Table 1 kurtosis shows a higher value for ALS as compared to healthy EMG signals, which shows the high peaked nature of ALS EMG signals for all sub-bands in comparison with healthy EMG signals. In Figure 8 and Table 2, mode feature shows a high value for all sub-bands of healthy EMG signals in comparison with ALS EMG signals sub-bands. This could be happening because healthy EMG signals show higher repetitive value in comparison with the ALS EMG signals. Entropy feature in Figure 9 and Table 2 shows a higher value for ALS EMG signals in comparison with healthy EMG signals for all sub-bands except the eighth sub-band. This shows that ALS EMG signals show higher complexity in comparison with the healthy EMG signals. In Tables 1 and 2 all features for all sub-bands show significantly lower p-value, which signifies the better classification ability of proposed features for the ALS and healthy EMG signals.

Figure 5: Statistical analysis of MAD features for eight subbands of ALS and healthy EMG signals.

Figure 6: Statistical analysis of IQR features for eight subbands of ALS and healthy EMG signals.

Figure 7: Statistical analysis of Kurtosis features for eight subbands of ALS and healthy EMG signals.

Figure 8: Statistical analysis of Mode features for eight subbands of ALS and healthy EMG signals.

Figure 9: Statistical analysis of Entropy features for eight subbands of ALS and healthy EMG signals.
| FEATURES | |||||||
|---|---|---|---|---|---|---|---|
| MAD | IQR | Kurtosis | |||||
| SB | Type | Mean ± Std | Probability | Mean ± Std | Probability | Mean ± Std | Probability |
| SB1 | ALS | 13.21 ± 3.11 | 3.21 x 10⁻⁵ | 20.47 ± 3.14 | 4.84 x 10⁻⁸ | 187.36 ± 346.55 | 0.0001 |
| Normal | 14.49 ± 2.63 | 23.15 ± 3.40 | 96.04 ± 314.35 | ||||
| SB2 | ALS | 6.76 ± 1.90 | 0.0024 | 9.43 ± 1.45 | 1.57 x 10⁻⁸ | 189.98 ± 263.87 | 0.0001 |
| Normal | 7.48 ± 2.09 | 11.05 ± 1.99 | 113.87 ± 273.58 | ||||
| SB3 | ALS | 5.29 ± 1.58 | 0.0159 | 6.94 ± 1.07 | 1.68 x 10⁻⁸ | 200.66 ± 253.07 | 0.0002 |
| Normal | 5.86 ± 1.95 | 8.26 ± 1.63 | 123.14 ± 240.36 | ||||
| SB4 | ALS | 4.55 ± 1.44 | 0.0449 | 5.70 ± 0.87 | 1.76 x 10⁻⁸ | 203.22 ± 241.22 | 0.0003 |
| Normal | 5.06 ± 1.87 | 6.86 ± 1.43 | 127.27 ± 218.88 | ||||
| SB5 | ALS | 4.10 ± 1.35 | 0.083 | 4.93 ± 0.76 | 1.76 x 10⁻⁸ | 200.74 ± 230.53 | 0.0006 |
| Normal | 4.55 ± 1.81 | 5.99 ± 1.30 | 129.27 ± 203.38 | ||||
| SB6 | ALS | 3.78 ± 1.30 | 0.1293 | 4.40 ± 0.68 | 1.81 x 10⁻⁸ | 198.50 ± 221.84 | 0.0008 |
| Normal | 4.19 ± 1.76 | 5.38 ± 1.21 | 130.34 ± 191.41 | ||||
| SB7 | ALS | 3.54 ± 1.26 | 0.1893 | 4.00 ± 0.62 | 2.09 x 10⁻⁸ | 196.13 ± 214.80 | 0.0009 |
| Normal | 3.92 ± 1.72 | 4.93 ± 1.14 | 130.93 ± 181.70 | ||||
| SB8 | ALS | 541.13 ± 896.99 | 4.36 x 10⁻⁷ | 672.97 ± 1.89x10³ | 0.0605 | 27.46 ± 45.24 | 0.0006 |
| Normal | 335.68 ± 191.31 | 426.19 ± 290.70 | 19.65 ± 25.92 | ||||
Table 1: The Mean ± Std of MAD, IQR, and Kurtosis with classification Probability of ALS and healthy EMG signals.
| Features | |||||
|---|---|---|---|---|---|
| MODE | Entropy | ||||
| SB | Type | Mean ± Std | Probability | Mean ± Std | Probability |
| SB1 | ALS | -518.66 ± 648.89 | 0.0205 | 1.32 ± 0.11 | 6.73 x 10⁻⁸ |
| Normal | -400.93 ± 670.49 | 1.30 ± 0.04 | |||
| SB2 | ALS | -379.70 ± 556.34 | 0.0106 | 1.66 ± 0.15 | 7.35 x 10⁻⁷ |
| Normal | -282.13 ± 435.25 | 1.61 ± 0.10 | |||
| SB3 | ALS | -344.74 ± 501.74 | 0.0073 | 1.88 ± 0.18 | 1.68 x 10⁻⁷ |
| Normal | -249.56 ± 315.19 | 1.80 ± 0.13 | |||
| SB4 | ALS | -318.22 ± 458.20 | 0.0067 | 2.05 ± 0.20 | 1.09 x 10⁻⁷ |
| Normal | -230.95 ± 323.32 | 1.94 ± 0.17 | |||
| SB5 | ALS | -297.13 ± 423.76 | 0.0064 | 2.19 ± 0.22 | 3.17 x 10⁻⁷ |
| Normal | -216.22 ± 297.98 | 2.06 ± 0.19 | |||
| SB6 | ALS | -279.93 ± 395.42 | 0.0056 | 2.31 ± 0.23 | 2.61 x 10⁻⁷ |
| Normal | -204.20 ± 276.13 | 2.17 ± 0.22 | |||
| SB7 | ALS | -265.64 ± 371.53 | 0.0059 | 2.43 ± 0.25 | 1.173 x 10⁻⁷ |
| Normal | -194.23 ± 257.87 | 2.26 ± 0.24 | |||
| SB8 | ALS | -5.7 x 10³ ± 4.25 x 10³ | 2.83 x 10⁻¹⁴ | 0.75 ± 0.28 | 7.82 x 10⁻⁷ |
| Normal | -311 x 103 ± 2.32 x 10³ | 0.89 ± 0.19 | |||
Table 2: The Mean ± Std of Mode and entropy with classification Probability of ALS and healthy EMG signals.
The obtained features are tested on k-NN and LS-SVM classifiers for the classification of ALS and healthy EMG signals. The performance of these classifiers is evaluated with 10-crossvalidation method. The specificity, sensitivity, and accuracy are calculated as classification performance parameters. The percentage measure of healthy subjects is defined as specificity (SPE). Sensitivity (SEN) is determined by the percentage of ALS subjects. The accurately classified percentage of subjects is called as Accuracy (Acc). These performance measures are respectively can be defined as,
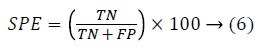
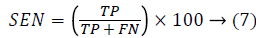
TP and FP signify true positive and false positive rate of ALS class EMG signals. TN and FN signify true negative and false negative rate of healthy class EMG signals. The specificity, sensitivity, and accuracy of the proposed method with LS-SVM and k-NN classifiers are computed in Table-3. In this table, classification performance is computed with sub-band wise features, where k-NN shows better classification performance as compared to LS-SVM classifier. The SB1 and SB7 features with k- NN classifier provide the 95% classification accuracy but sensitivity of SB7 is better for diagnosis of ALS EMG signals. The performance comparison of proposed method with other existing methods is shown in Table 4.
| LS-SVM | k-NN | |||||
|---|---|---|---|---|---|---|
| Sub-bands | SPE (%) | SEN (%) | ACC (%) | SPE (%) | SEN (%) | ACC (%) |
| SB1 | 86.09 | 100 | 90.45 | 94.74 | 95.4 | 95 |
| SB2 | 84.97 | 100 | 89.55 | 96.09 | 92.39 | 94.55 |
| SB3 | 83.33 | 100 | 88.18 | 95.97 | 88.54 | 92.73 |
| SB4 | 81.76 | 100 | 86.82 | 96.77 | 89.58 | 93.64 |
| SB5 | 80.75 | 100 | 85.91 | 94.53 | 90.22 | 92.73 |
| SB6 | 79.75 | 100 | 85 | 95.38 | 93.33 | 94.55 |
| SB7 | 79.27 | 100 | 84.55 | 96.85 | 92.47 | 95 |
| SB8 | 69.89 | 100 | 74.55 | 90.37 | 90.59 | 90.45 |
Table 3: Sub-band wise obtained classification performance of proposed method with LS-SVM and k-NN classifiers.
| Method | Classifier | Accuracy, % |
|---|---|---|
| Doulah and Fattah proposed method [11] | k-NN | 92.5 |
| EMD [1] | LSSVM | 95 |
| EMD [12] | LSSVM | 92.66 |
| AFEEMD [12] | LSSVM | 91.74 |
| Proposed method | k-NN | 95 |
Table 4: Performance comparison of proposed method with existing methods.
Conclusion
In this paper, TQWT based features are proposed for the classification of ALS and healthy EMG signals. TQWT decomposes EMG signals into high and low frequencies subbands. The statistical features like MAD, IQR, mode, kurtosis, and entropy are extracted from the sub-bands. The extracted five features are tested with KW test and observed that all are suitable for classification of ALS and healthy EMG signals. The classification performance of extracted feature is evaluated with LS-SVM and k-NN classifiers. Although, k-NN classifier obtained better classification performance parameters as compared to LSSVM. The TQWT based features with k-NN classifier obtained 95% classification accuracy, which is better as compared to other existing methods. In future work, we will focus on the usage of TQWT method with new features for higher accuracy in EMG signal classification and other neural diseases.
References
- Mishra VK, Bajaj V, Kumar A, Singh GK (2016) Analysis of ALS and healthy EMG signals based on empirical mode decomposition, IET Science, Measur Technol 10: 963-971.
- Mishra VK, Bajaj V, Kumar A (2016) Classification of normal, ALS, and myopathy EMG signals using ELM classifier, In IEEE 2nd International Conference on Advances in Electrical, Electronics, Information, Communication and Bio-Informatics (AEEICB) 455-459.
- Shijiya S, Thomas P (2016) A modular approach to finer classification of EMG signals. Int J Adv Res Electrical, Electronics and Instrumentation Eng 10.
- Fattah SA, Iqbal MA, Jumana MA, Doulah ASU (2012) Identifying the motor neuron disease in EMG signal using time and frequency domain features with the comparison. Signal Image Process 3: 99.
- Krishna A, Thomas P (2015) Classification of EMG signals using spectral features extracted from dominant motor unit action potential. Int J Eng Adv Technol 4.
- Khan M, Singh J, Tiwari M (2016) A Multi-classifier approach of EMG signal classification for diagnosis of neuromuscular disorders. J Bioengineer & Biomedical Sci S3: 003.
- Doulah, ASU, Iqbal MA, Jumana MA (2012) ALS disease detection in EMG using time-frequency method. In IEEE Informatics, Electronics & Vision 648-651.
- Goen A (2014) Classification of EMG signals for assessment of neuromuscular disorders. Int J Electronics and Electrical Eng 2.
- Elamvazuthi I, Duy NHX, Ali Z, Su SW, Khan MA, et al. (2015) Electromyography (EMG) based classification of neuromuscular disorders using multi-layer perceptron. Procedia Comp Sci 76: 223-228.
- Naik GR, Selvan SE, Nguyen HT (2016) Single-channel EMG classification with ensemble-empirical-mode-decomposition-based ICA for diagnosing neuromuscular disorders. IEEE Transactions on Neural Systems and Rehabilitation Engineering 24: 734-743.
- Doulah ABMSU, Fattah SA (2014) Neuromuscular disease classification based on mel frequency cepstrum of the motor unit action potential. In IEEE International Conference on Electrical Engineering and Information & Communication Technology 1-4.
- Mishra VK, Bajaj V, Kumar A, Sharma D, Singh GK (2017) An efficient method for analysis of EMG signals using improved empirical mode decomposition. AEU-Int J Electronics and Comm 72: 200-209.
- Subasi A (2013) Classification of EMG signals using PSO optimized SVM for diagnosis of neuromuscular disorders. Comp Biol Medicine 43: 576-586.
- Gokgoz E, Subasi (2015) A Comparison of decision tree algorithms for EMG signal classification using DWT. Biomedical Signal Processing and Control 18: 138-144.
- Doulah AB, Fattah SA, Zhu WP, Ahmad MO (2014) DCT domain feature extraction scheme based on motor unit action potential of EMG signal for neuromuscular disease classification. Healthcare Technology Letters 1: 26-31.
- Koçer S (2010) Classification of EMG signals using neuro-fuzzy system and diagnosis of neuromuscular diseases. J Medical Sys 34: 321-329.
- Nikolic M (2001) Detailed analysis of clinical electromyography signals: EMG decomposition, findings and firing pattern analysis in controls and patients with myopathy and amyotrophic lateral sclerosis (Doctoral dissertation).
- Selesnick IW (2011) TQWT toolbox guide, Electrical and Computer Engineering, Polytechnic Institute of New York University.
- Selesnick IW (2011) Wavelet transform with tunable Q-factor. IEEE Transactions on Signal Processing 59: 3560-3575.
- Taran S, Bajaj V (2017) Rhythm based identification of alcohol EEG signals, IET Science. Measurement & Technol.
- Upton G, Cook I (1996) Understanding statistics, Oxford University Press.
- Krishna A, Thomas P (2015) Classification of EMG signals using spectral features extracted from dominant motor unit action potential. Int J Eng Adv Technol 4.
- Fattah SA, Iqbal A, Jumana MA, Doulah AS (2012) Identifying the motor neuron disease in EMG signal using time and frequency domain features with the comparison. An Int J Signal & Image Processing 3: 2.
- Deza MM, Deza E (2009) Encyclopaedia of distances, Springer Berlin Heidelberg 1-583.
- Suykens JA, Vandewalle J (1999) Least squares support vector machine classifiers. Neural processing letters 9: 293-300.


Open Access Journals
- Aquaculture & Veterinary Science
- Chemistry & Chemical Sciences
- Clinical Sciences
- Engineering
- General Science
- Genetics & Molecular Biology
- Health Care & Nursing
- Immunology & Microbiology
- Materials Science
- Mathematics & Physics
- Medical Sciences
- Neurology & Psychiatry
- Oncology & Cancer Science
- Pharmaceutical Sciences