ISSN : 2393-8854
Global Journal of Research and Review
Relationship of Genetic Polymorphism (Intronic SNP RS2606345 of CYP1A1) and Drug Response in North Indian Epileptic Patients & Controls
Upadhyay C1*, Das S2 and Mazumder A1
1Noida Institute of Engineering and Technology, Greater Noida, Uttar Pradesh, India
- *Corresponding Author:
- Upadhyay C
Noida Institute of Engineering and Technology
Greater Noida, Uttar Pradesh, India
Tel: 01202328062
E-mail: chanchalupadhyay28@gmail.com
Received Date: August 01, 2017; Accepted Date: August 17, 2017; Published Date: August 27, 2017
Citation: Upadhyay C, Das S, Mazumder A (2017) Relationship of Genetic Polymorphism (Intronic SNP RS2606345 of CYP1A1) and Drug Response in North Indian Epileptic Patients & Controls. Glob J Res Rev. Vol. 4 No. 3: 26
Abstract
It is observed that many of the epilepsy patients fail to achieve good response to treatment, leading to increased risk of death and psychosocial consequences. Many hypotheses have been given regarding this variable response like variation in Drug metabolizing enzyme (DME). The role of one such DME i.e., CYP1A1, has been evaluated in this study which is known to metabolize estrogen into its various metabolites. Estrogen is observed to play a role in causing seizures interfering with normal brain function. One of its important SNP rs2606345 is observed to play a key role in seizure occurrence. The intronic SNP IVS1+606C>A shows no response to AEDs.
Keywords
Genetic polymorphism; Drug response; Epilepsy
Introduction
The human genome consists of different forms of genetic variations such as Single Nucleotide Polymorphisms, tandem repeats (minisatellite, microsatellite) large and small segmental deletions/insertion/duplication. The first genetic variation to be identified was by Davidson and Cortner in mitochondrial malate dehydrogenase [1]. As of June 2008, with 128 builds, dbSNP has reported 12.8 million SNPs and by build 129 the number of SNPs had reached more than 14 million [2]. Although the current build 138 has validated 1, 87, 382 SNPs out of the 9 lakh new SNPs reported. The first SNP reported was by Slightom in 1980 in human fetal G-gamma and A-gamma genes [3]. Such polymorphism may help in understanding the association of gene with disease and drug response. SNPs are one of the most common forms of genetic variations and may influence disease complexity and patient response towards drug. Epilepsy is a common chronic neurological disorder characterized by seizures that are known to fluctuate with the concentration of female sex hormone namely estrogens. A seizure is a transient disturbance of neuronal synchrony [4]. Only two thirds of patients are seizurefree under pharmacological treatment [5]. Hydroxylation of estrogens to catechol estrogens is catalyzed by CYP1A1. Epilepsy as a disease model is suitable for understanding the association of CYP1A1 polymorphisms with variable response to patients on anti-epileptic drugs (AEDs) [6].
Grover et al. in 2010 found that a genetic variant from CYP1A1 is one of the factors determining drug response to first-line AEDs [7].
The objective of this study was to characterize the frequency of intronic SNP rs2606345 of CYP1A1 in North Indian epileptic patients and controls.
Material and Methods
Isolation of DNA from blood samples
Isolation of DNA from cells is done using a combination of physical and chemical methods. DNA can be extracted from various cells of the body. One of the oldest, safest and efficient methods includes salting out method [8].
Quantification of isolated DNA
DNA was estimated by taking its Optical Density(OD).Tecan was used to take the absorbance. It is a very sensitive instrument that estimates the sample with just 1 μL sample.
Plate preparation
The DNA samples and controls were diluted or concentrated according to the estimated Optical Density, resulting in a total concentration of 25 ng/μL, to be used directly for PCR reaction.
Primer designing for the amplification process
A few set of PCR primers were designed using Primer Select module of DNASTAR Laser gene Software (DNASTAR Inc, Madison, WA, USA). Primer length was checked in UCSC InSilico PCR (genome.brc.mcw.edu/cgi-bin/hgPcr) and the specificity of the primers was confirmed using Electronic PCR database (lpgws. nci.nih.gov/perl/epcr).
Snapshot PCR
Genotyping method based on a single-base extension, that is, each probe binds to complementary DNA template in the presence of fluorescently labeled ddNTPs and AmpliTaq DNA Polymerase.
Polymerase extends primer by one base, adding one ddNTP to 3’ end, hence giving peaks, which are later observed on Peak Scanner™.
Polymerase chain reaction
It is used to amplify a single or a few copies of a piece of DNA across several orders of magnitude, generating thousands to millions of copies of a DNA sequence.
It uses repeated cycles, each of which consists of these steps:
PCR amplification was carried out, to amplify the desired region of the CYP1A1gene. This amplified region covered the SNP C>A (rs2606345) which is to be characterized. Following reaction components and thermal cycler conditions were standardised (Tables 1 and 2).
Table 1 Reagents used for PCR.
| Reagents | Volume | Use |
|---|---|---|
| 10X PCR buffer with 15mM MgCl2 | 2.5µL | Buffer is needed to provide a stable pH medium and Mg2+ is needed as a crosslinker. |
| dNTPs(deoxy Nucleotide Tri Phosphates)(2mM) | 2.5µL | The building blocks of DNA that will help synthesise the DNA chain. |
| Forward Primer(10pm/µL) | 1µL | Primer that attaches to the forward strand i.e. in 5’-3’ direction. |
| Reverse Primer(10pm/µL) | 1µL | Primer that attaches to the reverse strand i.e. in 3’-5’ direction |
| Taq polymerase(3U/µL) | 0.4µL | DNA polymerase helps in synthesisingthe DNA chain by linking dNTPs. |
| PCR water | 16.6µL | Acts as a universal solvent |
| DNA template(25ng/µL) | 1µL | The fragment to be amplified. |
Table 2 Temperature conditions for PCR.
| Condition | Temperature | Time | |
|---|---|---|---|
| Denaturation | 96˚C | 5 minutes | 30 cycles |
| Denaturation | 95˚C | 30 seconds | |
| Annealing | 50-60˚C | 30 seconds | |
| Extension | 72˚C | 30 seconds | |
| Final extension | 72˚C | 10 minutes | |
| Final hold | 4˚C | ∞ |
Agarose gel electrophoresis
Agarose gel electrophoresis is a procedure used to separate a mixed population of DNA and RNA fragments by length, to estimate the size of DNA and RNA fragments. Negatively charged nucleic acid molecules are separated by applying an electric field to move the molecules through an agarose matrix towards the positive terminal. Shorter molecules move faster and migrate farther than the longer ones, as shorter molecules migrate more easily through the pores of the gelin natural light &they cosediment with DNA because of the high-density glycerol present in them.
Snapshot PCR
Snapshot genotyping is a fast, high-throughput, multiplex mutational profiling method based on the Applied Biosystems Snapshot platform [9]. One advantage of Snapshot genotyping over conventional dideoxy-nucleeotide (Sanger) sequencing is that mutations can be detected when mutant DNA comprises as low as 5% of the total DNA. This is a method to determine SNP genotypes. Primer with its 3’ end flanking the SNP is used. It is extended one nucleotide by Taq polymerase and fluorescentlylabelled dideoxy nucleoside triphosphates (ddNTPs) complementary to the bases are added to it. These ddNTPs lack an -OH on both the 3', 2'-C of the ribose sugar. Now, the 5'-C can form a phosphodiester bond with the previous nucleotide in the chain, but the 3'-C cannot form a bond with next incoming dNTP, thus terminating the chain. The resulting fragment is now one nucleotide longer; SNPs can then be identified by the oneor two-colour peaks associated with the incorporated labeled ddNTP.
Single base pair extension of amplified product was carried out to extend one nucleotide of the region of CYP1A1 gene which was to be characterized for SNP, IVS1+606C>A (rs2606345). Snapshot multiplex ready reaction mix is used, which contains ddATP-dR6G, ddCTP-dTAMRA, ddUTP-dROX, ddGTP-dR110, AMPLITAQ FS TACS/core, and multiplex reaction buffer. dR6G, dTAMRA, dROX, and dR110 are fluorescent dyes that impart green, black, red, and blue color to the respective dideoxy nucleoside triphosphates incorporated (Tables 3 and 4).
Table 3 Reagents for Snapshot PCR.
| Component Snapshot reaction mix |
Volume(μl) 0.5 |
|---|---|
| Primer 2pmol/μl | 1 |
| PCR product | 1 |
| PCR water | 2.5 |
| Total | 5 |
Table 4 Temperature conditions for Snapshot PCR.
| Denaturation | 96˚C | 1 minute | |
|---|---|---|---|
| Denaturation | 96˚C | 10 seconds | 30 cycles |
| Annealing | 50˚C | 5 seconds | |
| Extension | 60˚C | 30 seconds | |
| Final hold | 4˚C | 10 minutes |
CIP treatment
Products obtained from Snapshot™ PCR were purified before loading into the ABI Prism 3130XL genetic analyzer. This was done to remove any leftover ddNTPs/short oligonucleotide strands from the reaction tube. Alkaline Phosphatase (CIP) catalyzes the removal of 5´ phosphate groups from DNA, RNA, ribo- and deoxyribonucleoside triphosphates (Tables 5 and 6).
Table 5 Reagents for CIP.
| Components | Volume(μl) |
|---|---|
| 10,000U/µl CIP enzyme | 0.14 |
| 10XNE buffer | 0.52 |
| Total | 0.66 |
Table 6 Temperature conditions for CIP treatment.
| Temperature | Time |
|---|---|
| 37˚C | 60 minutes |
| 80˚C | 20 minutes |
Instrumentation and protocol
The upgradable applied biosystems’ 416-capillary 3130 Genetic Analyzer instrument is used for genotyping. It is a suite of fluorescence-based capillary electrophoresis (CE) systems.
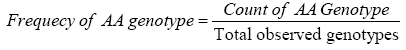
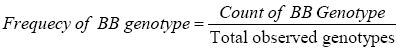
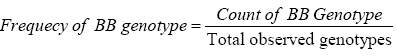
SNP distribution analysis and test for HWE
The genotypic and allelic frequencies were calculated from the obtained results of sequencing.
Genotypic frequency is calculated by using the formula:
Allelic frequency is calculated by using the formula:


The obtained frequencies were investigated for Hardy–Weinberg equilibrium (HWE) to rule out possibility of any genotyping error or any selection pressure. The HWE law states that in large randomly mating population both allelic and genotypic frequencies remain constant generation to generation, provided no mutation, no selection, no migration.
The HWE is checked by using the following equation:
(p2)+(2pq)+(q2)=1
Here, p is the frequency of allele A and q is the frequency of allele B.
After putting observed allelic frequencies in the above equation, it gave expected genotype frequencies of SNPs that follows HWE.
Number of expected genotypes was calculated using the following formula:
Expected genotype count=expected genotype frequency x n
Here, n=total number of individuals
The verification of HWE was done by performing χ2 (chi square) test among observed genotype counts (O) and expected genotype counts (E) for controls samples using the following formula
χ2=Σ[(O-E)2/E]
Results
Genetic variation analysis
The detailed information of the human CYP1A1 metabolizing gene was retrieved from NCBI; the chromosomal location of the gene along with its neighbouring genes was marked as shown in the figure. The detailed information of the genetic variants was retrieved from dbSNP (Tables 7 and 8) (Figures 1 and 2).
Table 7 Genetic variation analysis.
| Gene name | Chromosomal location | Gene length (bp) | Coding (bp) | Noncoding (bp) | Isoform | Exons |
|---|---|---|---|---|---|---|
| CYP1A1 | 15q24.1 | 2608 | 512 | 3387 | 6 | 7 |
Table 8 The details of our primers were as follows.
| No. | Oligonucleotide | Sequence (5’→3’) | Tm (°c) | GC-content |
|---|---|---|---|---|
| 1. | CYP1A1_FP_PCR | ACGTTGGATGTCTTTGTCCTTTGCTGGGAG(30) | 63.6 | 50% |
| 2. | CYP1A1_RP_PCR | ACGTTGGATGGGTGAGTTTTTAGGGACTGG(30) | 63.2 | 50% |
| 3. | CYP1A1_FP_Snpsht | CAGTTGGCAATCTGTCA(17) | 49.6 | 47% |

Figure 1: Human CYP1A1 metabolizing gene detail along with initial and final number of genetic variants.

Figure 2: CYP1A1 gene representation.
Patients and healthy individuals
In the present study, we studied a group of 20 North Indian epilepsy patients and 20 unrelated North Indian healthy individuals. Both controls and patients belong to same ethnicity and geographical area. The healthy individuals were not reported to have a history of epilepsy seizures or any other neuropsychiatric disorder.
Genotyping results and their analysis
Cases: 20 epilepsy patients from North Indian population were considered for genotyping of SNP IVS1+ 606C>A (rs2606345) present on CYP1A1gene. Seven (35%) patients were homozygote for wild allele (CC), whereas two (10%) patients were homozygote for mutant (AA) allele. Eleven of the patients had heterozygous genotype as AC=(55%) (Table 9) (Figures 3 and 4).
Table 9 Genotypes of cases.
| S.no. | Sample ID | Chromatogram color | Genotype |
|---|---|---|---|
| 1 | Sample 1 | Black,green | CA |
| 2 | Sample 2 | Black, green | CA |
| 3 | Sample 3 | Black,green | CA |
| 4 | Sample 4 | Black,green | CA |
| 5 | Sample 5 | Black,green | CA |
| 6 | Sample 6 | Black,green | CA |
| 7 | Sample 7 | Green,green | CC |
| 8 | Sample 8 | Green,green | CC |
| 9 | Sample 9 | Black,green | CA |
| 10 | Sample 10 | Green,green | CC |
| 11 | Sample 11 | Black,black | AA |
| 12 | Sample 12 | Black,black | AA |
| 13 | Sample 13 | Black,green | CA |
| 14 | Sample 14 | Green,green | CC |
| 15 | Sample 15 | Black, green | CA |
| 16 | Sample 16 | Black, green | CA |
| 17 | Sample 17 | Green,green | CC |
| 18 | Sample 18 | Black,green | CA |
| 19 | Sample 19 | Green,green | CC |
| 20 | Sample 20 | Black,green | CA |

Figure 3: Chromatogram for homozygous call in sample 7 with genotype CC.

Figure 4: Chromatogram for heterozygous call in sample 1 showing CA genotype.
Genotypes of cases
Healthy controls: In case of healthy individuals, six individuals were homozygous for wild type allele (CC=30%), one (1%) individual had homozygous genotype with variant AA and Twelve (60%) were heterozygous possessing genotype CA (Tables 10-12) (Figures 5-7).
Table 10 Genotypes of healthy controls.
| S.no. | Control ID | Chromatogram color | Genotype |
|---|---|---|---|
| 1 | Control 1 | Black, green | CA |
| 2 | Control 2 | Black,black | CC |
| 3 | Control 3 | Black,black | CC |
| 4 | Control 4 | Black. Green | CA |
| 5 | Control 5 | Green, green | CC |
| 6 | Control 6 | Green, green | CC |
| 7 | Control 7 | Green, green | CC |
| 8 | Control 8 | Black , green | CA |
| 9 | Control 9 | Green, green | CC |
| 10 | Control 10 | Green, green | CA |
| 11 | Control 11 | Black, black | AA |
| 12 | Control 12 | Black,black | AA |
| 13 | Control 13 | Green,green | CC |
| 14 | Control 14 | Black,green | CA |
| 15 | Control 15 | Black,green | CA |
| 16 | Control 16 | Black,green | CA |
| 17 | Control 17 | Green, green | CC |
| 18 | Control 18 | Black, green | CA |
| 19 | Control 19 | Black, green | CA |
| 20 | Control 20 | Black,green | CA |
Table 11 Summary of genotypic frequencies of samples and cases.
| Genotype | Samples (n=20) | Controls (n=20) | ||
|---|---|---|---|---|
| Genotype count | Genotype frequency | Genotype count | Genotype frequency | |
| CC | 6 | 0.35 | 8 | 0.4 |
| CA | 12 | 0.55 | 10 | 0.55 |
| AA | 2 | 0.1 | 2 | 0.05 |
Table 12 Summary of allelic frequencies of samples and cases.
| Phenotype | Total number | IVS1 + 606C>A frequency | |
|---|---|---|---|
| C | A | ||
| Epilepsy cases | 20 | 0.625 | 0.375 |
| Controls | 20 | 0.675 | 0.325 |

Figure 5: Chromatogram for a heterozygous call in control 1 with CA genotype.

Figure 6: Chromatogram for a homozygous call in control 2 with CC genotype.

Figure 7: Graphical representation of samples and cases.
Genotypes of healthy controls
Verifying Hardy- Weinberg equilibrium (HWE): Assuming the null hypothesis that both cases and controls exhibit Hardy-Weinberg equilibrium (Table 13).
Table 13 Observed and expected genotypic frequencies of samples and cases.
| Genotypes | Cases (n=20) | Controls (n=20) | ||
|---|---|---|---|---|
| No. of observed genotypes (O) | No. of expected genotypes (E) | No. of observed genotypes (O) | No. of expected genotypes (E) | |
| CC | 6 | 7.81 | 8 | 9.12 |
| CA | 12 | 9.38 | 10 | 8.78 |
| AA | 2 | 2.81 | 2 | 2.12 |
Using the formula, χ2=Σ[(O-E)2/E]
For controls:
χ2=(1.12)2/9.12+(1.22)2/ 8.78+(1.12)2/2.12
χ2=1.2858
Similarly, for samples
χ2=0.6
The studied SNP (CYP1A1 (IVS1+606C>A)) was not deviating from HWE in cases and control sample set (χ2 calculated< χ2 critical at degree of freedom=1 and 0.05 level of significance).
Discussions
The study was undertaken to characterize the genotypic frequency of the intronic SNP rs2606345 of CYP1A1 in North Indian epileptic patients and healthy controls. CYP1A1 is an important xenobiotic and drug metabolizing enzyme, but in some situations, it can also be activated by endogenous factors like sex or hormonal factors. Endogenous factors play a significant role in the transcriptional regulation of the enzyme. Estrogen, a hormonal factor is known to interfere with the normal brain functioning causing seizures. The SNP rs2606345 is found to have significant role in estrogen related neuropsychiatric disorders.
Genotyping was done by single base extension method using Snapshot™ kit and calls were given for the respective genotypes of all the samples. Genotypic and allelic frequencies were then calculated.
The allelic and genotypic frequencies were used for checking the HWE conformance of population. The Hardy-Weinberg law is important in the field of population genetics. It states that allele and genotypic frequencies in a population will remain constant over the generations. The deviations that could influence the law are non-random mating, mutation, selection, genetic drift, gene flow and meiotic drive. Because such influences are generally present in real populations, the principle describes an ideal condition against which the effects of these influences can be analyzed.
Hardy-Weinberg equilibrium was calculated by using Pearson's chi-squared test. The χ2 value was less that the critical value of 3.814 at degree of freedom 1 and 0.05 level of significance.
Conclusion
It is observed that one- fourth of the epilepsy patients fail to achieve good response to treatment, leading to increased risk of death and psychosocial consequences. Many hypotheses have been given regarding this variable response like variation in DMEs, drug transporters and drug targets. The role of one such DME i.e. CYP1A1, has been evaluated in this study which is known to metabolize estrogen into its various metabolites. Estrogen is observed to play a role in causing seizures interfering with normal brain function. One of its important SNP rs2606345 is observed to play a significant role in seizure occurrence. The intronic SNP IVS1+606C>A shows no response to AEDs. For our study, this polymorphism was genotyped in 20 North Indian patients with epilepsy, and 20 control subjects without epilepsy. It was observed that CYP1A1 was highly polymorphic in studied sample set. Our objective was to check the frequency of this polymorphism in epilepsy patients and control samples. No significant differences in the frequencies of samples and patients were found. If further detailed phenotyping including age, gender, seizure occurrence etc. could have been known, in the patients, exact correlation with that of the published literature by Grover et al could be made. Other than this small sample will still limit the final interpretation of result therefore, a large sample size will also be needed for final correlation.
References
- Davidson RG, Cortner JA (1967) Mitochondrial malate dehydrogenase: A new genetic polymorphism in man. Science 157: 1569-1571.
- Bethesda DB (2005) SNP FAQ Archive. National Center for Biotechnology Information USA.
- Slightom JL (1980)Human fetal G gamma- and A gamma-globin genes: complete nucleotide sequences suggest that DNA can be exchanged between these duplicated genes. Cell 21:627-638.
- Mahgoub A,Idle JR, Dring LG, Lancaster R, Smith RL (1977) Polymorphic hydroxylation of Debrisoquine in man. Lancet 2: 584-586.
- Kwan P, Brodie M J (2002) Refractory epilepsy: a progressive, intractable but preventable condition? Seizure 11: 77-84.
- Szoeke CE, Newton M, Wood JM, Goldstein D, Berkovic SF, et al. (2006) Update on pharmacogenetics in epilepsy: A brief review. The Lancet Neurology 5:189-196.
- Grover S, Talwar P, Gourie-Devi M, Gupta M, Bala K, et al.(2010) Genetic polymorphisms in sex hormone metabolizing genes and drug response in women with epilepsy. Pharmacogenomics 11: 1525-1534.
- Miller SA, Dykes DD, Polesky HFRN(1988) A simple salting out procedure for extracting DNA from human nucleated cells Nucleic acids. Research 16: 1215.
- Diasâ€ÂÂSantagata D, Akhavanfard S, David SS, Vernovsky K, Kuhlmann G, et al.(2010)Rapid targeted mutational analysis of human tumours: a clinical platform to guide personalized cancer medicine. EMBO Molecular Medicine 2: 146-158.

Open Access Journals
- Aquaculture & Veterinary Science
- Chemistry & Chemical Sciences
- Clinical Sciences
- Engineering
- General Science
- Genetics & Molecular Biology
- Health Care & Nursing
- Immunology & Microbiology
- Materials Science
- Mathematics & Physics
- Medical Sciences
- Neurology & Psychiatry
- Oncology & Cancer Science
- Pharmaceutical Sciences