ISSN : 0976-8505
Der Chemica Sinica
Preparation, Spectroscopic Characterization and Particle Size Distribution of Sulfamethazine Schiff bases-β-Cyclodextrins Inclusion Complexes
Jabbar Saleh Hadi*, Aqeel T Kadum
Department of Chemistry, College of Education for Pure Sciences, university of Basrah, Basrah-Iraq
Abstract
Schiff bases of Sulfamethazine with o.Vanillin and Cinnamaldehyde were prepared and characterized and then the inclusion complexes of thes Schiff bases with β-CD were prepared in 1:1 molar ratio by freeze drying method. The interaction between Schiff bases and β-CD was characterized by IR , HNMR, 13CNMR and XRD. Also, a further study of particle size distribution utilized to investigate the effect of complication on particle size decreased after complication with β-CD.
Keywords:
Sulfamethazine, Schiff bases, Inclusion complex, PSD, β-CD
Introduction
Cyclodextrins are oligosaccharides with a Lipophilic central cavity and ahydrophilic outer surface. The naturally occurring Cyclodextrins are α, β and ɣ which containing 6, 7 and 8 glucopyranose units respectively and to toroid shape of Cyclodextrins are capable of forming inclusion complexes with many organic molecules especially with drugs [1,2]. The inclusion complexes of host-guest systems accurse through physical forces such as hydrogen bonding, vandwalls and electrostatic attraction [3] .The pharmaceutical applications of inclusion complexes is to enhance the solubility, stability, bioavailability and controlled release of drug molecules [4,5]. Over the last two decades the synthesis many Schiff bases derived from sulfdrug were studied [6,7]. Also the inclusion complexes of free sulfa drug were prepared by interaction with different Cyclodextrins [8-10] but we believe that the inclusion complexes of Schiff base derived from sulfa have not been studied, so this is the aim of this work .
Experimental
Materials and methods
All chemicals and solvents employed in synthesis were of extra pure grade and used as received. Sulfamethazine and o-Vanillin were obtained from Sigma-Aldrich, Cinnamaldehyde and Sulphuric acid were obtained from BDH, β-CD was obtained from across organic company.
Spectral measurement and instrumentation
Melting points were recorded on the rmofisher in open capillaries and were left uncorrected, IR Spectra were recorded as a KBr pellets by using Shimadzu FTIR-Spectrophotometer. 1H and 13CNMR Spectra were recorded on Bruker (400 MHZ),DMSO-d6 was used as a solvent TMS as the internal reference. The Mass Spectra was by the EI technique at 70 eV with an Agilent Technologies 5975C Spectrometer. XRD Spectra were recorded on Philips X. Pertrop MPD diffract meter using Cu Kα radiation (λ=1.54060 Å) and analyzed from 2 θ(5-40°) with scan step time 0.5 second and generator setting 20 mA, 400 KV. The particle size distribution was examined by Malvern 2000, the samples were dispersed in deionized water and solicited before scanning.
Synthesis of SMT-o.V Schiff base
The Schiff base SMT-o.V was prepared by mixing 50 ml of hot ethanol solution (60°C) of 5 mmol (1.39 gm) Sulfamethazine with 10 ml of warm ethanol solution of o.Vanillin (5 mmol, 0.76 gm) (Figure 1) . The reaction mixture was refluxed and 2 drops of H2SO4 was added. The resulting orange precipitate which formed during the reflux was filtered hot, washed with cold ethanol and finally recrystallized from ethanol and dried in oven at 50 °C, m.p 218-219 °C, orange Crystals yield 73% .
Synthesis of SMT-cinn schiff base
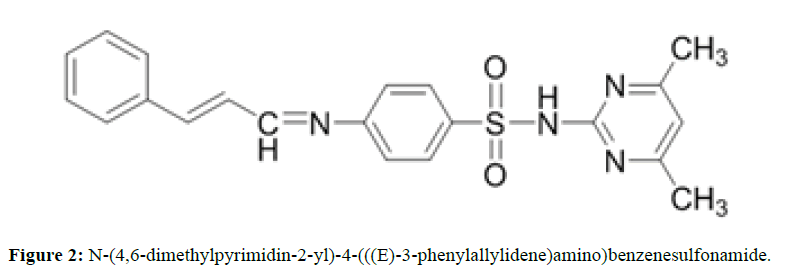
To a hot ethanol solution of 5 mmol (1.39 gm) of Sulfamethazine; 5 mmole (0.66 gm) of Cinnamaldehyde dissolved in 10 ml of absolute ethanol was added drop wise with continuous stirring, than 2 drops of conc. H2SO4 was added to the mixture and refluxing, the reaction progress was monitored by TLC (ethyl acetate: Benzene) ( 3:7) until the reaction complete (~ 10 hurs), then the reaction mixture Kept overnight at refrigerator, and the solid which separated flittered and washed with cold ethanol, dried in air m.p 87°C-89°C, yield 45% Rf=0.568 (Figure 2).
Preparation of inclusion complexes by freeze drying method
The general procedure for preparing the inclusion complexes between Schiff base and β-CD was carried out as following [11,12]. Solutions of Schiff base with β-CD (1:1 molar ratio) were prepared in deionized water (50 ml) . The resulted solutions was stirred for 3 days at room temperature , then the solution was freezing and then lyophilized in a freeze drying (CHRIST, model alpha 1-2 LD Plus Germany) . The resulting solid was collected and kept in adesicator over silica gel.
Results and Discussion
The two Schiff bases which prepared in this study are stable, nanhygroscopic, sparingly soluble in the common organ solvents but soluble in DMSO and DMF.The inclusion complexes are light powder stable and nanhygroscopic, sparingly soluble in water and soluble in DMF, DMSO.
Mass spectra analysis
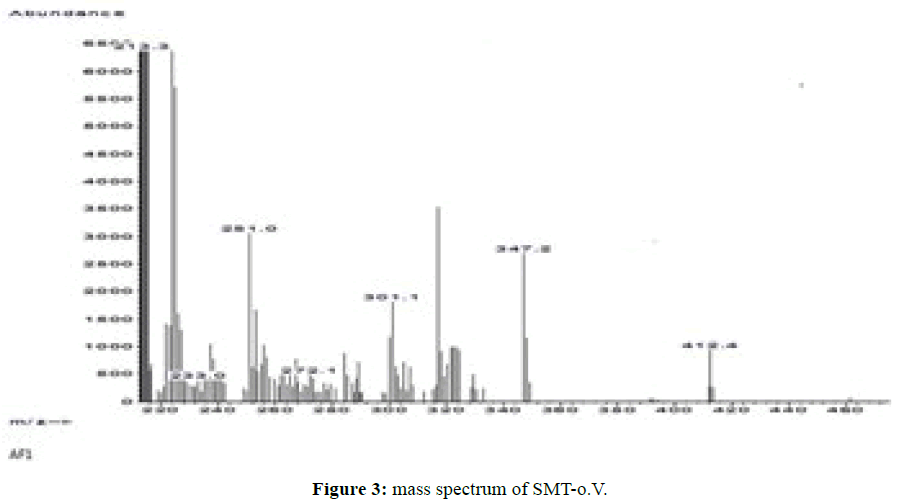
Both Schiff bases SMT-o.V and SMT-Cinn show a molecular ion peak (M•+) in agreement with proposed empirical formulas where SMT-o.V mass spectrum show the molecular ion peak at m/z=412.4 (Figure 3) and SMT-Cinn mass spectrum.Show the molecular ion at m/z=392.2 which indicated the condensation of Sulfamethazine with aldehydes in (1: 1 molar ratio) .
IR Spectra of Schiff bases SMT-o.V and their inclusion complex SMT-o.V-βCD
The IR spectrum of Schiff base SMT-o.V shows a characteristic band at ϑ 1614.42 cm-1 which attributed to stretching vibration of azomethine group (-C=N) (6,7), two storng bands at 1568.13 and 1458.26 cm-1 attributed to (C=C) stretching vibration also a very strong bands at 1350.17 and 1159.22 cm-1 attributed to asymmetric and symmetric stretching of SO2 group respectively .
The strong band at 975.98 cm-1 attributed to stretching vibration of (S-N) group [13]. When compared these data with the IR Spectrum of their inclusion complex (SMT-o.V-βCD) we noted that a significant shift in the (C=N) band to higher frequency (+ 9.64 cm-1) , change also include the (C=C) , SO2 and S-N bands (Table 1) in addition the band at 2931.8 cm-1 which attributed to (C-H) stretching vibration in free β-CD was Shifted to lower frequency (- 3.86 cm-1) in the complex spectrum . This significant differences indicating the in capsulation of Schiff base in the cavity of β-CD [14,15].
| band | βCDfree cm-1 |
SMT-o.V cm-1 |
SMT-o.V-βCD cm-1 |
∆ ϑ cm-1 |
|---|---|---|---|---|
| ϑ O-H ϑ N-H |
3365.78 ------ |
3500 3263.56 |
3329.14 | |
| ϑC-H | 2931.80 | ------- | 2927.94 | -3.86 |
| ϑ C=Nazom | ------ | 1614.42 | 1624.06 | +9.64 |
| ϑC=Nmethaz | ------ | 1600.92 | 1597.06 | -3.86 |
| ϑ¨—C | 1568.13 1458.26 |
1552.70 1516.05 |
-15.43 +57.79 |
|
| ϑO=S=O asy | ------ | 1350.17 | 1340.53 | -9.64 |
| ϑO=S=O sym | ------ | 1159.22 | 1155.36 | -3.86 |
| ϑS-N | ------ | 975.98 | 947.06 | -28.92 |
Table 1: IR data of SMT- o.V and comparison with their SMT-o.V-βCDββ
IR Spectra of SMT-cinn and SMT-cinn-βCD
The IR Spectrum of SMT-Cinn show a strong band attributed to azomethine stretching at 1625.99 cm-1, this band shifted to lower frequency in IR Spectrum of SMT-Cinn-βCD (1616.35 cm-1) a series of strong band at 1550.77,1508.33 and 1485.19 cm-1 attributed to (C=C) stretching , all these bands decrease in intensity upon complication with β-CD . The strong band at 1344.38 cm-1 which attributed to asymmetric stretching of SO2 to lower frequency 1340.53 cm-1 while the symmetric stretching at 1151.5 cm-1 Shifted to higher frequency 1157.29 cm-1. Also the band at 2924.09 cm-1 which attributed to (C-H) aliphatic of β-CD moiety, these band appear in free β-CD at 2931.8 cm-1 from these data you can say that the Schiff base entirely overlap with β-CD.
HNMR Spectra of SMT-o.V and their inclusion Complex
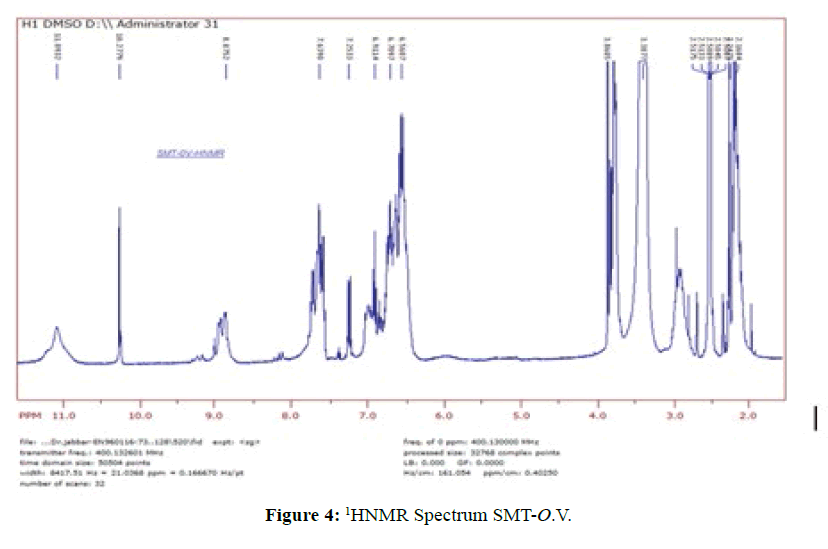
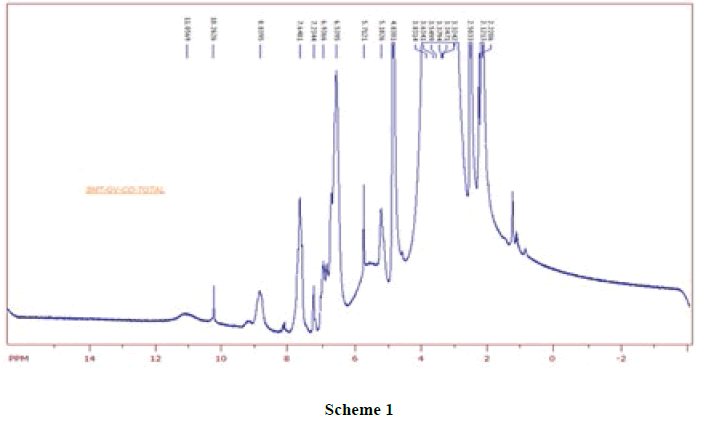
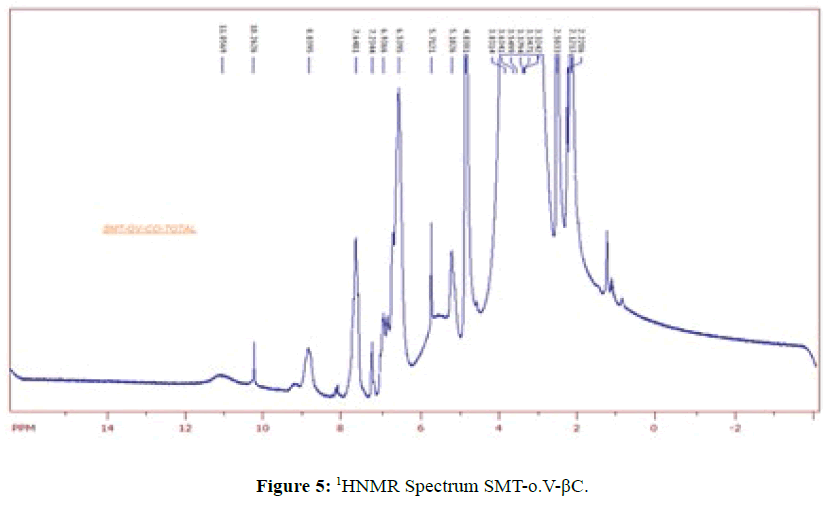
1HNMR Spectrum of SMT-o.V (Figure 4) show a signal at 8.8752 ppm attributed to azomethine proton [6] which indicated the formation of Schiff base also the Spectrum show a signals depicted in Scheme 1.When compared the spectral data of SMT-o.V with their inclusion complex a significant changes where observed in chemical shift for all signals, where the methyl group protons signal shifted to highfield Δσ= -0.047 ppm, the methoxy protons signal shifted to highfield Δσ= -0.029 ppm. The azomethine signal shifted to highfield Δσ= -0.35 ppm also the aromatic protons signal as well as the OH and NH protons signals where shifted to high field (Figure 5) . These result together with H3 and H5 protons of β-CD which shifted to high field (H3 Δσ= - 0.26, H5 Δσ= -0.24 ppm) indicated the totally encapsulated between guest and host [16,17].
13CNMR Spectra of SMT-cinn and their inclusion complex
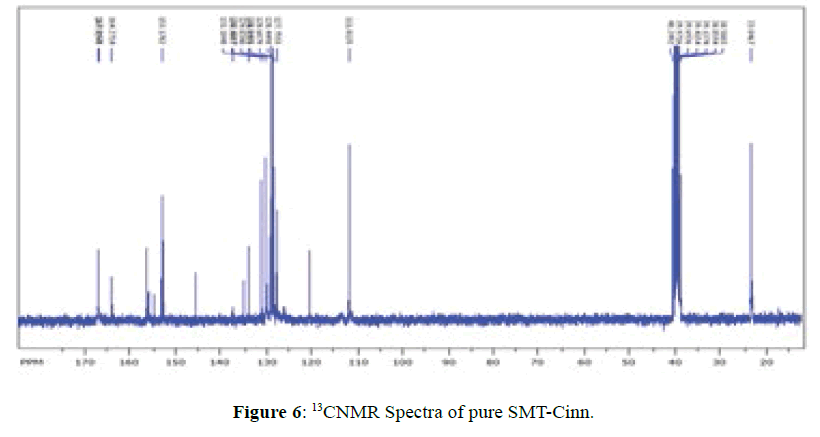
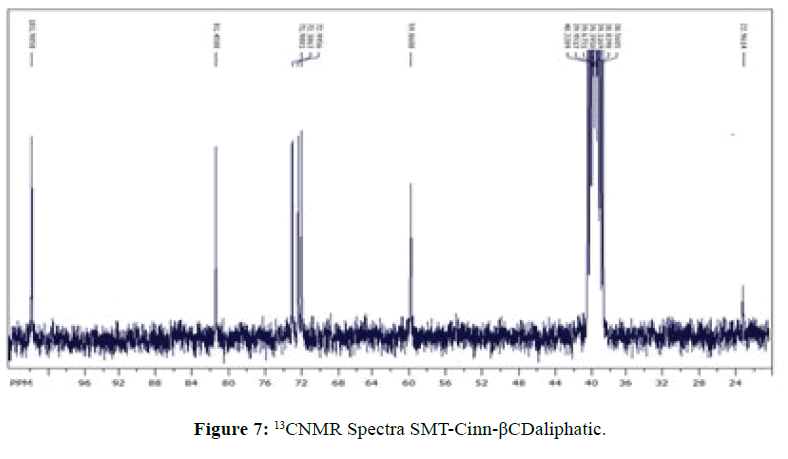
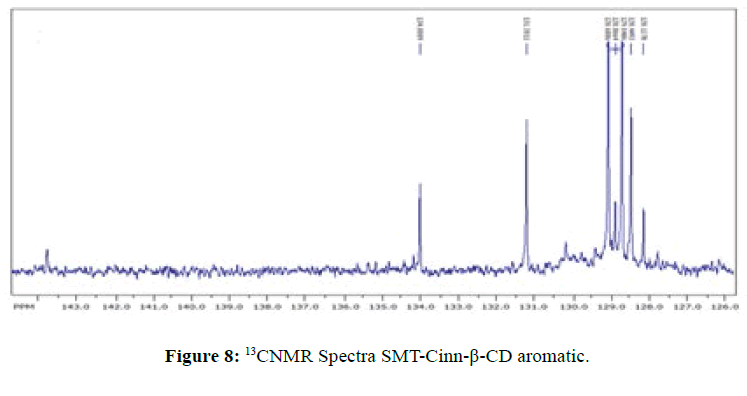
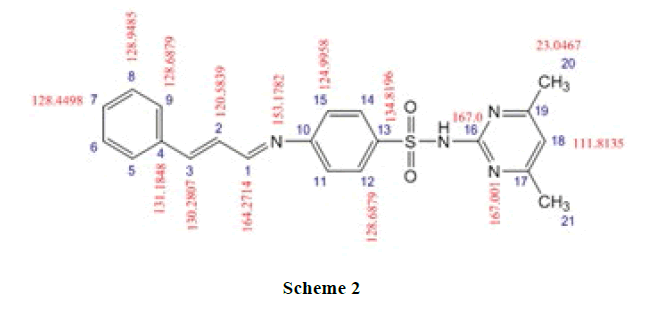
The 13CNMR Spectra of pure SMT-Cinn and their inclusion complex SMT-Cinn-β-CD are showing in Figures 6-8. The numbering of β-CD carbon atoms and SMT-Cinn are depicted in Scheme 2 and Table 2.
| No.of C | βCDfree ppm |
SMT-Cinn ppm |
SMT-Cinn-βCD ppm | ∆s ppm |
|---|---|---|---|---|
| C‾1 | 62.5 | 59.8608 | - 2.7 | |
| C‾2 | 79.6 | 72.9956 | - 6.7 | |
| C‾3 | 83.1 | 81.4588 | - 1.7 | |
| C‾4 | 74.1 | 71.9801 | - 2.2 | |
| C‾5 | 74.4 | 72.3863 | - 2.1 | |
| C‾6 | 110.0 | 101.9058 | - 8.1 | |
| C1 | 164.2714 | 163.4348 | - 0.8366 | |
| C2 | 120.5839 | 121.7343 | + 1.1504 | |
| C3 | 130.2807 | 130.2004 | - 0.0803 | |
| C4 | 131.1848 | 131.2011 | + 0.0163 | |
| C5,9 | 128.6879 | 128.4493 | - 0.2386 | |
| C6,8 | 128.9485 | 128.6886 | - 0.2599 | |
| C7 | 128.4498 | 128.1278 | - 0.322 | |
| C10 | 153.1782 | 152.7834 | - 0.3948 | |
| C11,15 | 124.9958 | 121.7343 | - 3.2615 | |
| C12,14 | 128.6879 | 128.4493 | - 0.2386 | |
| C13 | 134.8196 | 134.0092 | - 0.8104 | |
| C16 | 167 | 167.005 | - 0.005 | |
| C17 | 167.001 | 166.2602 | + 0.7408 | |
| C18 | 111.8135 | 111.8117 | - 0.0018 | |
| C19 | 167.001 | 166.2602 | + 0.7408 | |
| C20,21 | 23.0467 | 22.9614 | - 0.0853 |
Table 2 :13CNMR data and chemical shift change of SMT-Cinn and SMT-Cinn-βCD
The largest variation of chemical shift are observed for all signals of carbon atoms of β-CD where all signals shifted to high field compared with free β-CD also a significant change in chemical shift of SMT-Cinn carbon where a signals of (C1,C2) as when as the aromatic carbon (C4-C9) are shielded, these data suggest that the guest in included in the host cavity through the penetration of benzene ring and the side chain with azomethine group .
X-ray powder diffractometry:
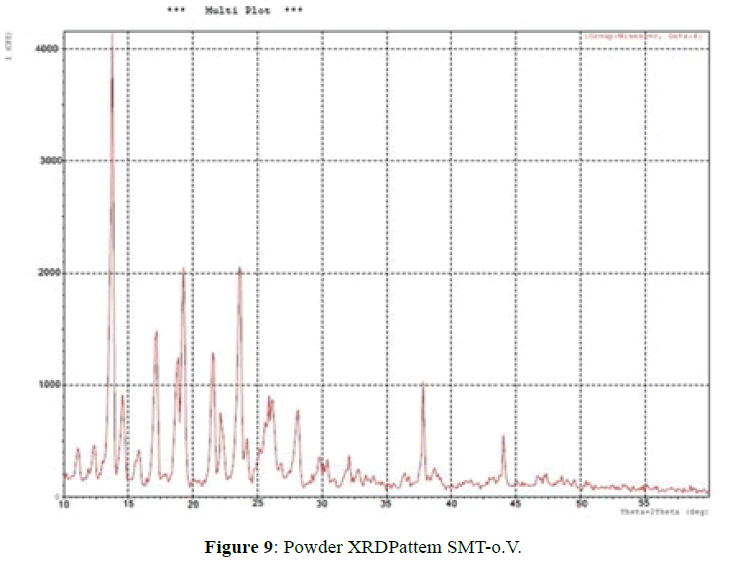
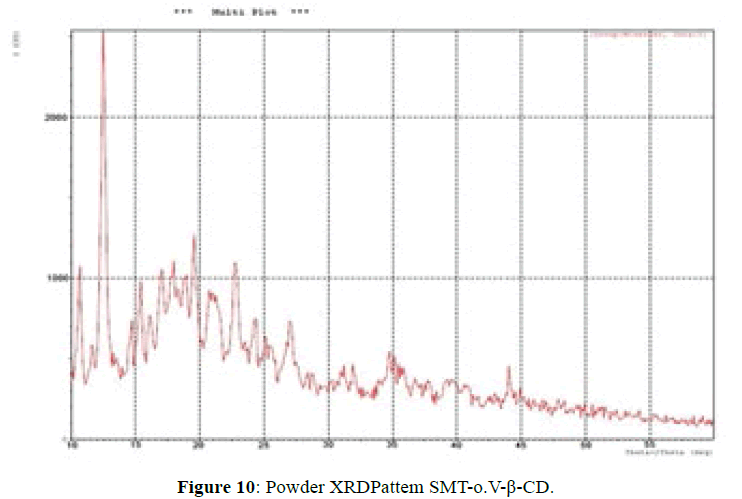
The XRD patterns of SMT-o.V and their inclusion complex SMT-o.V-β-CD are shown in Figures 9 and 10. The diffract gram of shift base showed sharp and intense peaks at 2θ=13.78 (100%), 19.29 (53%), 23.63 (56%) and another less intense peaks at 2θ=17.16 (37%), 18.83 (32%) and 21.57 (33%); which indicates its crystalline nature of Schiff base, when compared it with XRD pattern of their inclusion complex show the totally absence of the peaks corresponding to free β-CD and free SMT-o.V; which indicates the formation of the inclusion complex [8,10,18] and a new peaks were observed at 2θ=12.55 (100%), 19.60 (33%) and 22.8 (31%).
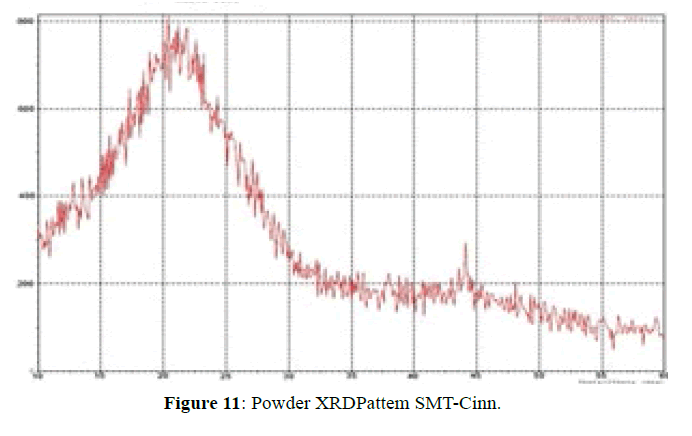
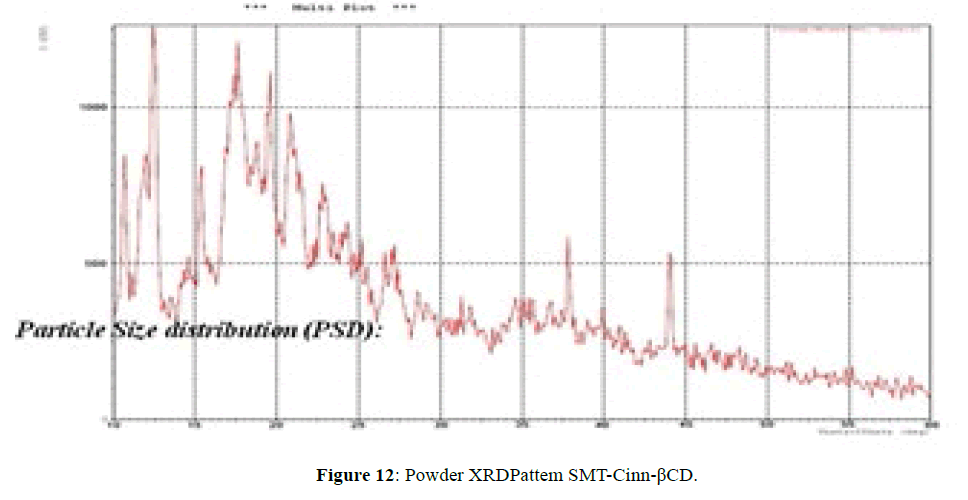
The XRD pattern of SMT-Cinn (Figure 11) confirmed the amorphous nature, while XRD pattern of this inclusion complex SMT-Cinn-β-CD (Figure 12) is characterized by diffraction peak at 2θ=18.38 (100%), 12.30 (89%) and 21.05 (74%). This result confirm the higher interaction between guest and host charges the crystalline nature [18,19].
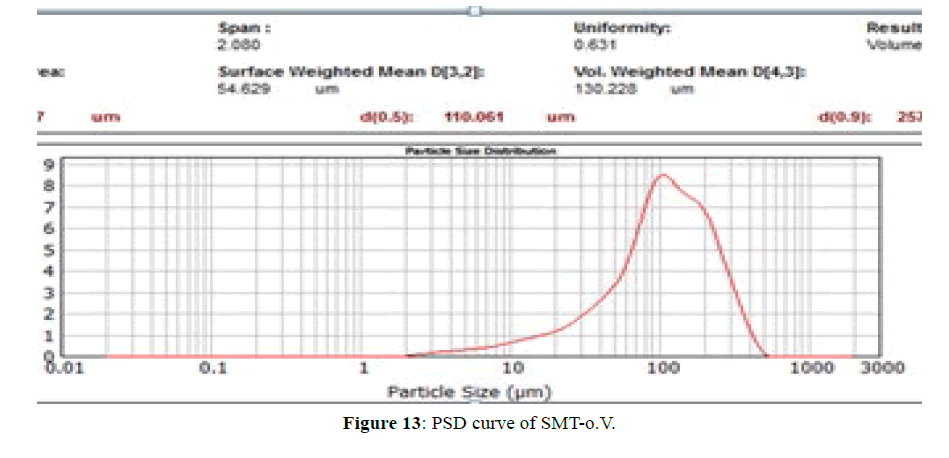
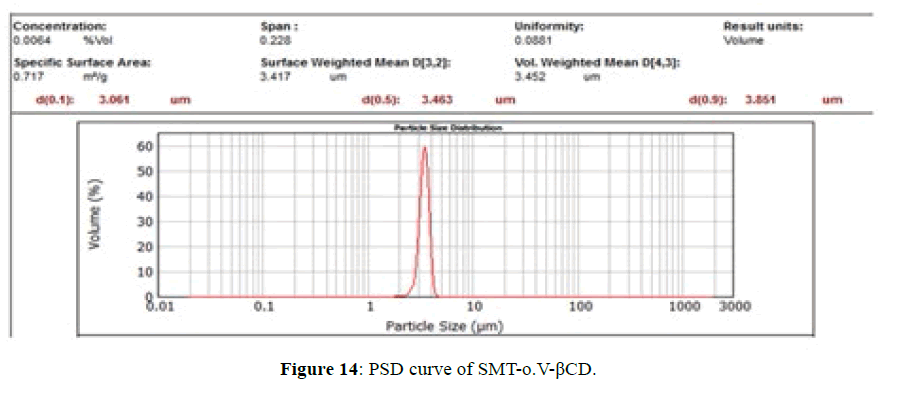
PSD for SMT-o.V and SMT-o.V-βCD are shown in Figures 13 and 14, the distribution curve of SMT-o.V show a wide range at distribution where 10% (d0.1) of particle have a size less than 28.9 μm and 90% (d0.9) of particle less than 257.78 μm , and mean D [4,3] equal 130.22 μm, specific surface area equal 0.0448 m2/g . while the distribution curve of their inclusion complex show narrowing rang where 10% of particle size less than 3.06 μm and 90% of particle less than 3.85 μm, the mean D [4,3] equal to 3.45 μm and the specific surface area equal 0.717 m2/g , this distribution can be classified as monodispersive [20,21], it is clearly the enhancement of surface area of particle by 16 folds .
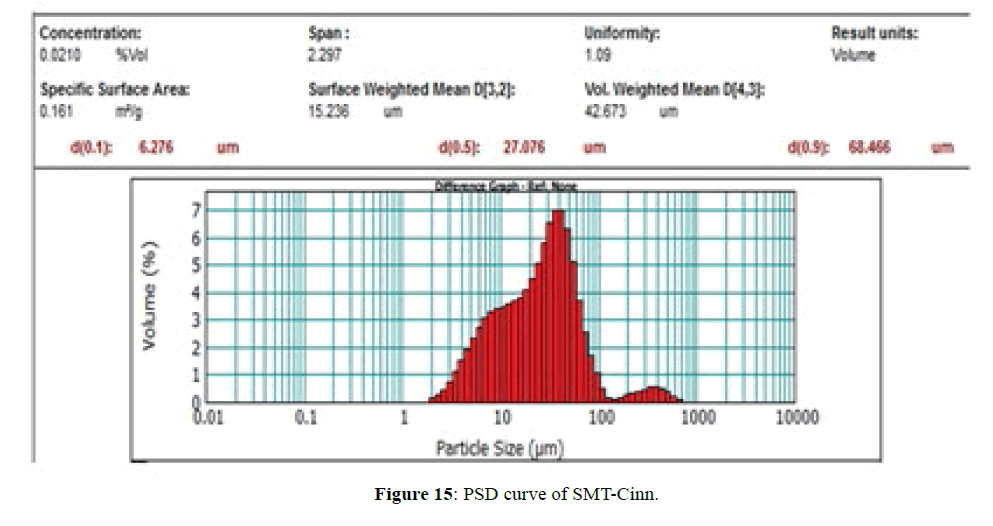
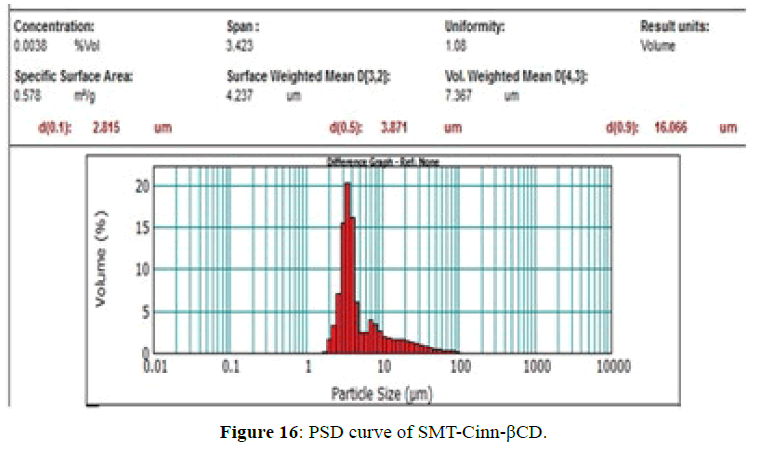
The PSD curves of SMT-Cinn and their inclusion complex are show in Figures 15 and 16. The PSD curve of SMTCinn presenting 10% of particle size less than 6.27 μm and 90% less than 68.46 μm, while the PSD curve of SMTCinn- βCD show a 10% of particle size below 2.8 μm and 90% below 16 μm, also the specific surface area increase by 3.5 folds.
Conclusion
Schiff bases derived from sulfamethazine can be complexed with β-CD to produce inclusion complexes in solid state. A significant change in the position of IR bands, HNMR and C13NMR signals indicating that the Schiff bases either totally encapsulated in β-CD cavity in case of SMT-Cinn or partially encapsulated in case of SMT-o.V .The XRD data confirm the higher interaction between guest and host where the characteristic peak of guest disappear upon complexation with β-CD and in some cases change to amorphous powder.Comparing of the PSD of Schiff bases with their inclusion complexes shows that the particle size decrease and the surface area increase upon complexation with β-CD.
References
- Rasheed A, Kumar Sravanthi AVVN (2008), Cyclodextrins as Drug Carrier Molecule,Sci. Pharm 76: 567-598.
- Szafran B, Pawlaczylc J (1999), Interaction between Sulfaproxyline and β-Cyclodextrin in the Solution and Solid States, J Incl Phenom Macrocycl Chem 34:131-139.
- Liu L, GUO QX (2001) Isokinetic relationship, isoequilibrium relationship, and enthalpy-entropy compensation, J. Incl. Phenom. Macrov Chem 39: 193-209.
- Uekama K, Hirayama F, Irie T (1998), Cyclodextrin Drug Carrier Systems, Chem Rev 98: 2045-2076.
- Magnusdotir A, Masson M, Loftsson T (2002), Self Association and Cyclodextrin Solubilization of NSAIDs J. Inc. Phenom. Macr.Chem, Vol, 44: 213-218.
- Ebrahimi H, Hadi JS,H. S. AL-Ansari (2013) A new series of Schiff bases derived from sulfa drugs and indole-3-carboxaldehyde: Synthesis, characterization, spectral and DFT computational studies, Journal of MolecularStructure 1039: 37- 45.
- Alsalim T, Saeed MEM, Hadi JS, Zeino M, R. Gany et al. (2014), Cytotoxicity of Novel Sulfanilamides Towards Sensitive and Multidrugresistant Leukemia Cells, Curr Med Chem 21: 2715-2725.
- Zoppi A, Delrivo A, Aiassa V, Longhi MR (2013), AmericanAssociation of Pharmaceutical Sciences 14:727-735.
- Zoppi A, Quevedo MA, Delerivdo A, Longhi AR (2010), Complexation of sulfonamides with β‐cyclodextrin studied by experimental and theoretical methods, J. Pharm. Sci 99:3166-3176.
- Rajendrian N, Siva S, Saravanan J (2013), Inclusion complexation of sulfapyridine with α- and β-cyclodextrins: Spectral and molecular modeling study, J. Mol. Struct 1054–1055: 215 – 222.
- Figueiras A, Cardoso O, Veiga F, de carvalho RB, Ballaro G (2015), Preparation and characterization of Trimethoprim inclusion complex with Methyl-β-Cyclodextrin and determination of its antimicrobial activity,Pharm. Anal Acta Vol. 6:1-5.
- Ai F, Wang J, Li Y, Ma Y (2017), Effect of Drug Particle Size on Complexation, Physicochemical Properties and Dissolution of Cyclodextrin Inclusion Complexes, J. Pharm. Sci. Vol. 79: 131-138.
- Li W, Lu B, sheng A, Yang F, Wang Z (2010), Spectroscopic and theoretical study on inclusion complexation of beta-cyclodextrin with permethrin, J. Mol. Struct, 981:194-203.
- Ghorab MK, Adeyeye MC (2001) Enhanced bioavailability of process‐induced fast‐dissolving ibuprofen cogranulated with β‐cyclodextrin. Pharm. Dev. Technolo.Vol. 6: 315-324.
- Singh R, Bharti N, Madan J, Hiremath SH (2010), Structure Elucidation of Benzhexol-β-Cyclodextrin Complex in Aqueous Medium by 1H NMR Spectroscopic and Computational Methods, JPST 2: 171-183.
- Ali SM, Fatma k, Dhokale S (2013) Structure elucidation of β-cyclodextrin–xylazine complex by a combination of quantitative 1H–1H ROESY and molecular dynamics studies, J. Org. Chem 9:1917-1924.
- Youming Z, Xinrong D, Liangcheng W, Taibao W (2008) Synthesis and characterization of inclusion complexes of aliphatic-aromatic poly(Schiff base)s with β-cyclodextrin (highlight), J. Incl. Phenom. Macro. Chem. 60: 313-319.
- Shinde AJ, Paithane MB, Ingole VS, More HN (2012) Am. J. Pharm Res 2: 880-891.
- Jablan J, Weitner T, Gabricevic M, Jug M (2011), Stability and Structure of Inclusion Complexes of Zaleplon with Natural and Modified Cyclodextrins, Croat. Chem. Acta Vol. 84: 169-178.
- Gadad AP, Chandra PSAP, Dandagi PM, Masthiholimath VS (2012), IJPSN, Vol. 5, lssue 2.
- Kotronia M, Kavetsou E, Loupasaki S, Kikionis S, Vouyiouk S et al.(2017),Encapsulation of Oregano (Origanum onites L.) Essential Oil in β-Cyclodextrin (β-CD): Synthesis and Characterization of the Inclusion Complexes, Bioengineering 4: 74.

Open Access Journals
- Aquaculture & Veterinary Science
- Chemistry & Chemical Sciences
- Clinical Sciences
- Engineering
- General Science
- Genetics & Molecular Biology
- Health Care & Nursing
- Immunology & Microbiology
- Materials Science
- Mathematics & Physics
- Medical Sciences
- Neurology & Psychiatry
- Oncology & Cancer Science
- Pharmaceutical Sciences

