Preparation, Characterization and Evaluation of Activated Charcoal from Biowaste for Efficient Removal of Basic Blue 41 from Textile Effluent
Adam Mekonnen Engid1,2* and Embiale Molla Melese1
1Department of Industrial Chemistry, Addis Ababa Science and Technology University, Addis Ababa, Ethiopia
2Department of Nanotechnology, Addis Ababa Science and Technology University, Addis Ababa, Ethiopia
- *Corresponding Author:
- Adam Mekonnen Engid
Department of Industrial Chemistry,
Addis Ababa Science and Technology University,
Addis Ababa,
Ethiopia
Tel: 251937405870
E-mail: adam.mekonnen@aastu.edu.et
Received date: March 31, 2023, Manuscript No. IPWPC-23-16207; Editor assigned date: April 04, 2023, PreQC No. IPWPC-23-16207 (PQ); Reviewed date: April 19, 2023, QC No. IPWPC-23-16207; Revised date: May 31, 2023, Manuscript No. IPWPC-23-16207 (R); Published date: June 08, 2023, DOI: 10.36648/IPWPC.5.1.003
Citation: Engid AM, Melese EM (2023) Preparation, Characterization and Evaluation of Activated Charcoal from Biowaste for Efficient Removal of Basic Blue 41 from Textile Effluent. J Water Pollut Control Vol:5 No:1.
Abstract
Commonly used textile cationic dyes like Basic Blue 41 (BB 41) adversely affect the environment and human health. Adsorption technique is reported as a best approach to remove such organic dyes and Activated Carbon (AC) is one of the promising adsorbent. However, the quality of AC and its adsorption efficiencies could be determined by the type of biomass as well as the activation conditions. This study was designed to prepare an AC from mixture of Teff Husk (TH) and Niger Seed Cake (NSC) under optimized condition to find alternative and efficient adsorbent for the removal of BB 41 from textile discharge. In this study, TH (75%) and NSC (25%) was selected as optimum ratio based on physicochemical analysis results of the prepared adsorbents. The SEM, BET, XRD and FTIR analysis of the optimized Biowaste Activated Carbon (BWAC) had shown excellent physicochemical properties and surface features. The effect of pH, adsorbent dose, contact time and initial concentration of BB 41 on adsorption efficiency of BWAC were evaluated using batch adsorption experiment. The maximum adsorption efficiency (96.77%) was observed at pH 9, 0.2 g adsorbent dose, 50 mg/L of initial concentration of BB 41 and 60 mins contact time, The batch experimental adsorption data was well fitted to Freundlich isotherm model and the adsorption kinetics data was close fitting to pseudo second order kinetic model with R2=0.999. The adsorption thermodynamics study had shown endothermic process and the adsorption process was spontaneous. The proposed BWAC was effective to remove BB 41 from real sample with an adsorption efficiency of 98.04%. The availability of the bio wastes plus excellent performance of the prepared adsorbent is promising for the feasibility of mass production to remove BB 41 dye and other organic pollutants having similar properties in textile industry.
Keywords
Basic blue 41; Adsorption; Teff husk; Niger seed cake; Adsorption isotherms; Adsorption kinetics
Introduction
With continuing population explosion and an increase in industrialization, the need for water is estimated to increase by 400% before the end of 2050.
Industries that use dyes during processing generate large amounts of wastewater with a high concentration of dyes. These industries consume substantial volumes of water and release large volume of waste with high concentration of dyes. Dyes and pigments released to water bodies results an aesthetic colouration even after minor release into the environment [1]. Synthetic dyes adversely affect human health through food chain and further cause a serious threat to food security by affecting the natural ecosystem. Disposal of synthetic dyes can cause serious health problems as they might cause, allergy, dermatitis, and skin irritation and also provoke cancer and mutation in humans, carcinogenic, acute and chronic health problems.
Those dyes classified as anionic and cationic dyes are nonbiodegradable and resistant to heat, light, many chemicals and oxidizing agents. BB 41 is a cationic dye and it is the most commonly used colouring dye among all other dyes of its category. It is selected to represent a group of dyes having large molecular size and difficult to be degraded in natural environment [2]. Due to this fact, the discharges of wastewater containing BB 41 in to water bodies contribute major aesthetic and ecological problems. As a result, environmental legislation commonly obligates textile factories to treat effluents before discharging into the receiving watercourses.
There are many methods such as physical, biological and chemical methods to remove dye from textile effluent. However, some of those methods are very expensive, use dangerous chemicals and generate toxic sludge as byproduct which is environmentally harmful. Adsorption is considered as a promising technique due to its simplicity for design, easy operation and insensitivity to toxic substances and is an effective and widely used physical method to eliminate or lower the concentration of wide range.
Materials and Methods
Chemicals and materials
To carry out the designed project the following analytical grade chemicals and reagents had been used without further purification. Orthophosphoric acid (H3PO4, 85%, Sisco Research laboratories Pvt. Ltd., India), Sodium Chloride (NaCl, 99.9%) was obtained from India, Hydrochloric acid (HCl, 37%), Sodium Hydroxide (NaOH, 99%). Ethanol (C2H5OH), Sodium Bicarbonate (NaHCO3, 99%) and BB41 dye (C20H26N4O6S2).
Apparatus and instruments
Hot air oven (universal), muffler furnace (bio base), orbital shaker (SSL1, Unite Kingdom), centrifuge (C2006, Unite Kingdom), fume hood, mortar, desiccator, digital pH meter (multi 9620IDS), thermometer, electronic balance (AUW320, SHIMADZU), 150 μm sieved (B.S/I.S.O.3310), quartz cuvette (2100-ESQ-4), Scanning Electron Microscope (SEM, JCM-6000 PLUS), UV-Vis spectroscopy (Jasco V-770), X-Ray diffraction (XRD, Ultima IV), Brunauer emmett-teller (Horiba Instruments, Inc. SA-9600), Fourier-Transform Infrared Spectroscopy (FTIR, iS50 ABX, Germany) were materials used for experiments, analysis and characterization.
Sample collection and pre-treatment
The TH was collected from local farmers around Addis Ababa using polyethylene bags and it was washed with distilled water to remove soluble impurities. Then, it was sun dried ground and sieved to have uniform size distribution. Finally, the dry powder was stored at room temperature using polyethylene bags for further experiment. The second sample (NSC) was collected from the nearby oil factory, Kana food complex around Kebena in Addis Ababa [3-5]. Then NSC was dried, to remove any moisture, powdered and sieved to a size of TH. The real sample (textile industry discharge) was collected from Ketema Kebeda (KK) textile industry in Addis Ababa using plastic bottles which was rinsed with nitric acid and distilled water as of Tadesse, et al (Figure 1).

Figure 1: a) TH and b) NSC c) textile industry wastewater samples.
Preparation of BWAC
Different parameters that can affect the properties of hypothesized adsorbent (BWAC): Percentage composition of TH and NSC, pyrolysis temperature and concentration of impregnating chemical solution were studied. As a result, impregnating H3PO4 solution with concentrations of (10%, 30% and 50%), proportion of TH and NSC (5%, 15% and 25% NSC) and carbonization temperature of (300°C, 400°C and 450°C). with 40 g sample mass were evaluated.
The preparation of AC was done by following previously reported procedures. The experiment was done by taking 40 g of mixed samples with different proportion of TH and NSC (0%, 5%, 15%, 25% and 35%). Then, the mixed samples were soaked in 80 mL of H3PO4 solution (10%, 30% and 50%) for 24 hrs followed by removing the solution and the residue was washed with distilled water to bring the pH of samples near to 7 [6]. Then, the samples were kept in a hot air oven at 120°C for 10 hrs. Next, the samples were heated in an oven at 300°C, 400°C, 450°C and 500°C for 2 hrs and the product was washed with distilled water to remove any soluble compounds followed by drying at 100°C in an oven for 24 hrs before crashing [7]. Finally, the products were sieved into 150 μm mesh size (B.S/I.S.O.3310) and preserved in desiccators for characterization (Figure 2).

Figure 2: Preparation scheme of BWAC.
Proximate analysis of BWAC
The proximate analysis was done to determine the Ash content (Ac), Moisture Content (MC), Volatile Matter (VM) and Fixed Carbon (FC) of the prepared adsorbents.
Determination of MC
The moisture content of each batch was determined by placing 1 g of dry sample in an oven for 3 hrs at a temperature of 150°C. Then the moisture content of the samples was computed using equation 1.

Where;
W1=Weight of original sample.
W2=Weight of dried sample.
Determination of AC
The Ac of the prepare AC was determined by taking 1 g of each dried BWAC into pre dried crucible. Then, the crucibles were placed in a furnace at temperature of 650°C for 3 hrs until constant weight was obtained. Then, percentage of Ac was determined using equation 2.
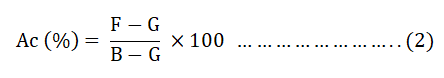
Where;
F=Mass of crucible plus ash (g).
G=Mass of empty crucible (g).
B=Mass of crucible plus dried sample (g).
Volatile Matter (VM)
The prepared AC (1 g) was taken in weighed container and be placed in a furnace and maintained at 550°C for 1 hr. Then, the crucibles were cooled in desiccators and weighed again to compute the VM using equation 3.

Where;
M1=Weight of non-dried sample (g).
M2=Weight of dried sample.
Determination of FC
The FC content was calculated by subtracting the sum of percentage of MC, VM and Ac from 100 as shown in equation 4.

Characterization of BWAC
The physicochemical properties (surface structure, crystalline structure, surface chemistry, and specific surface areas) of the THAC (control) and BWAC were studied using different instruments: Scanning Electron Microscope (SEM, JCM-6000 PLUS), X-Ray Diffraction (XRD, Ultima IV), FT-IR spectrophotometer (iS50 ABX, Germany) and Brunauer Emmett- Teller (Horiba Instruments, Inc. SA-9600).
Point of zero charge
The pH at point of Zero Charge (pZC) corresponds to the pH at which the surface net charge of the adsorbent can be zero. In a series of 250 mL flask, 50 mL of 0.1 M HCl solution was taken and the pH of the solution was adjusted between 2 and 10 using NaOH and HCl. Then, 0.01 g of adsorbent was added to each flask and left for 24 hrs with constant stirring to reach at equilibrium [8]. Then the pH of each solution was measured and PZC was determined by ploting (pHinitial–pHfinal) against pHinitial.
Adsorption experiment
The adsorption efficiency of BWAC and THAC was studied in batch adsorption method at room temperature. The effect of different parameters on the adsorption efficiency were evaluated by varying pH (3, 4, 5, 6, 7, 8, 9, 10 and 11), dose of adsorbent (0.1, 0.2, 0.3, 0.4, 0.5, 0.6, 0.7 and 0.8 g), contact time (20, 40, 60, 80, 100, 120, 140 minutes) and the initial concentration of BB 41 dye (25, 50, 75, 100, and 125 mg/L). The effect of each parameter was studied by varying one of the factors at a time with a constant volume of solution and at the laboratory temperature. At the end of each experiment, the supernatant solutions were centrifuged at 4000 rpm for 10 minutes and filtered through a Whatman number 1 filtered paper [9]. The absorbance of the filtrate was measured at λmax=606 nm of BB 41. Adsorption capacity of the adsorbents and the percentage of removed BB 41 was calculated using Equations 5 and 6 respectively.
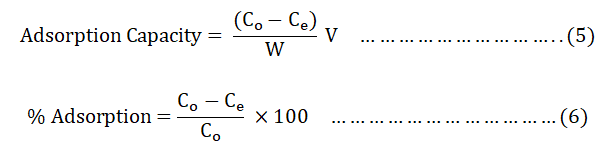
Where;
Co and Ce=Initial and final (equilibrium) concentrations of the
textile dye in mg/L.
V=Volume of solution (L).
w=Weight of BWAC (g).
Calibration curve plot
To determine the concentration of BB 41 in the supernatant solution, after each adsorption experiment. The absorbance of BB 41 dye standard solutions (0 mg/L-5 mg/L) and (5 mg/L–15 mg/L) were determined at λmax=606 nm of BB 41 using UV spectrophotometer. Then, the calibration lines and the linear equation were determined by plotting absorbance versus concentration.
Optimization of adsorption parameters
Effect of pH: To determine the optimum pH for BB 41 adsorption on prepared adsorbents, different pH values (3, 4, 5, 6, 7, 8, 9, 10 and 11) were considered. The pH value of the solutions was adjusted by adding 0.1 M HCl and 0.1 M of NaOH and the adsorption experiments were carried out by keeping other parameters constant. Then the adsorption process was done as it was mentioned in section 2.6. Finally, the absorbance of the supernatant solution was determined to compute the concentration of BB 41 dye at equilibrium [10].
Effect of adsorbent dose: To study the effect of adsorbent dose, different weight of adsorbents were taken (0.1 g-0.8 g), keeping other parameters constant. Then, a portion of solution was analyzed using UV-Vis spectrophotometer.
Effect of contact time: To examine the effect of contact time on adsorption of BB 41, the experiment was conducted in different contact time duration (20–140 min) at laboratory temperature and by keeping other parameters constant.
Effect of initial concentration of BB 41 dye: The effect of the adsorbante initial concentration was evaluated using selected concentration of BB 41 dye (25, 50, 75, 100, and 125 mg/L) under the optimized pH, adsorbent dose and contact time.
Study of adsorption isotherms: The adsorption experiments were carried out using rotary shaker at 240 rpm in 250 mL flasks at room temperature for 60 min. The experiment was done by taking 100 mL of BB 41 solution with different initial concentrations (25, 50, 75, 100 and 125 mg/L) at pH 9. After the experiment, the residual dye concentration was determined from supernatant solution.
Then, the adsorption isotherms were tested against Langmuir model using equation 7 and Freundlich equation 8.
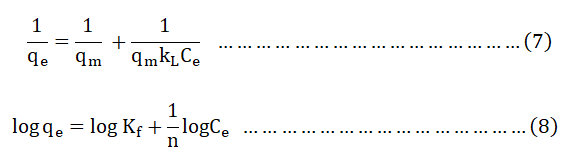
Where;
qe=(mg/g) is the adsorption capacity.
Ce=Equilibrium concentration after adsorption (mg L-1).
1/n=Intensity of adsorption or affinity.
Kf (mg g-1)=Freundlich adsorption constant.
qm (mg g-1)=Maximum adsorption capacity.
KL (L mg-1)=Langmuir constant.
Adsorption kinetics study
In order to determine the adsorption kinetic, batch experiments were done in different contact time (20, 40, 60, 80 and 100 min) using optimum parameters: pH=9, adsorbent dose=0.2 g and BB 41 initial concentration=50 mg/L). At the end of each experiment the concentration of BB41 in the filtrates was measured by UV-Vis spectrophotometer [11]. Then, the amount of adsorbate at equilibrium (qe) and at any instant of time t (qt) was computed from the absorbance of the supernatant solution. Then, the amount of adsorbate was tested against the pseudo first order equation 9 and pseudo second order equation 10.
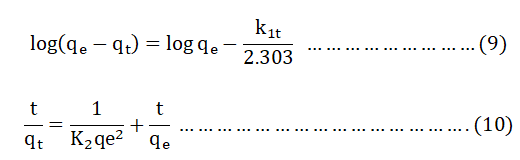
qe and qt (mg g-1)=Amount of BB 41 adsorbed by the adsorbent at the equilibrium and at a time t respectively.
k1 (min-1), K2 (g mg-1min-1)=Rate constant of the corresponding model [12].
The value of k1 and qe were calculated from the slope and intercept of the plot of log (qe-qt) versus t for pseudo first order and linear relationship of t/qt versus t for pseudo second order model, from which qe and K2 can be determined from the slope and intercept of the plot respectively.
Adsorption thermodynamics
The adsorption thermodynamics experiment of the adsorbent (optimized BWAC) for BB 41 dye adsorption was done under optimized parameters and at different a temperature (25°C, 30°C, 40°C, and 50°C) in an incubator shaker. Then, the equilibrium concentrations were determined as mentioned above. The thermodynamics parameter of Gibb’s free energy change (ΔG°), enthalpy change (ΔH°) and entropy change (ΔS°) were calculated from thermodynamics equilibrium constant (Kc) as follows using equations 11-13.
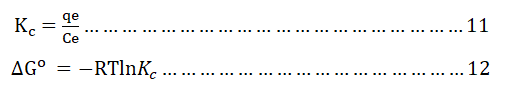
Where;
T is the temperature in kelvin (K)
R is the ideal gas constant=8.314 J mol-1.K-1.
ΔS° and ΔH° where determined from the following equation:

The linear plot of lnKc versus 1/T(K) the enthalpy (ΔH°), entropy (ΔS°) values were calculated from the slope (ΔH°/R) and intercept (ΔS°/R).
Real sample collection and analysis
To determine the adsorption efficiency of BWAC for removal of BB 41 from real sample, the collected sample was filtered using Whatman number 1 filter paper to avoid suspended material and the absorbance of a portion of the sample was determined at 606 nm to determine the concentration of BB 41 dye in the original sample. Then, 100 mL of the filtered sample was taken in 250 mL volumetric flask and the adsorption experiment was conducted under optimized parameters (pH=9, adsorbent dose=0.2 g and contact time=60 mins) at room temperature [13]. Finally, the residual concentration of BB 41 in the filtrate solutions was computed from the absorbance using a calibration line obtained from freshly prepared BB 41 test solutions (0.5 mg/L–15 mg/L).
Results and Discussion
BWAC preparation and optimization of parameters
The factors that can determine the quality of the prepared BWAC were evaluated based on the selected parameters (MC, AC, VM, and FC). The BWAC from 40 g biomass (20% NSC) prepared at a temperature of 300°C, 400°C, 450°C and 500°C in 2 hrs are shown in Figure 3. The BWAC prepared at 500°C was totally ash and it was not considered for proximate analysis.
When the temperature was increased from 300°C to 450°C the total yield of BWAC was decreased from 78.93% to 57.96% because of loss of additional mass at higher temperature. When the pyrolysis temperature was increased from 300°C to 450°C, the MC and VM of the BWAC were decreased while the Ac and FC were increased (Figure 4). The MC was decreased as the pyrolysis temperature was increased that imparts better property of the adsorbent due to loss of more water and other compounds that would exist within the pores [14]. The Ac was increased from 12.24% to 17.58% as the pyrolysis temperature increased from 300°C to 450°C due to progressive concentration of soluble inorganic mineral contents.
When the temperature increased from 300°C-450°C, the VM was decreased from 48.94% to 19.64% which might be due to burn-off of more volatile tar at higher temperatures and dehydration of additional hydroxyl groups [15]. On the other hand, the content of FC was increased from 19.98% to 61.46% as the temperature was raised from 300°C to 450°C. However, the BWAC which was prepared at 500°C was totally ash as shown in Figure 4a. As a result the optimum carbonization temperature was 450°C and this value was used for further experiment.

Figure 3: BWAC prepared at a) 300°C b) 400°C c) 450°C and d) 500°C.
The effect of percentage composition of the biomasses (TH and NSC) is displayed in Figure 4b. The MC of the prepared BWAC was decreased from 1.32% to 5.35% when the content of NSC increased from 5% to 25% NSC, but the MC was increased back to 5.0% when the content of NSC raised to 35%. This might be because of presence of uncooked organic structure to absorb moisture resulting from resulting incomplete pyrolysis of heat resistant biomass (NSC). This experimental result indicates that up to the optimum content of NSC, it helps to protect the biomass from burning during pyrolysis, but as the content of NSC increases it would need more energy during pyrolysis which is not a green and economical [16]. In addition to this, the total yield of BWAC was increased from 50.61% to 63.0% as the content of NSC raised from 5% NSC to 25% which supports the above justification.
On the other hand, the VM was decreased from 31.48% to 19.64% as the percentage of NSC was raised from 5% to 25%. This might be due to the heat holding property of the biomass with more content of NSC that could help to remove more compounds during pyrolysis. However, the VM had shown a slight increase when the content of NSC was increased to 35% which might be due presence uncooked biomass left during pyrolysis. But, the FC content was increased from 49.95% to 61.46% when NSC was increased from 5 to 25%. But the FC had shown slight decrease as the content of was raised to 35% (Figure 4b) [17]. According to this experimental result, better physicochemical properties were observed with 25% NSC and the optimum mass composition is 75% TH and 25% NSC.
The optimum impregnating chemical (activating agent), H3PO4, was evaluated with 40 g biomass (25% NSC) at 450°C pyrolysis temperature (Figure 4c). Both MC and VM were decreased with concentration of impregnating H3PO4. This is due to better dissolution of volatile molecules and pyrolysis of additional water absorbing biomasses with high concentration of H3PO4 but, the Ac had shown a slight increase (13.2% to 17.58%) as the concentration of H3PO4 was increased from 10%–50% due to dissolution of more minerals from additional surfaces (micro pore structures) developed from release of volatile substances at higher concentration of H3PO4. But, the FC content had increased from 51.57% to 61.46 % when the concentration of H3PO4 was increased from 10%–50% due to removal of all dissolvable contents during impregnation and activation [18]. On the other hand, the chemical activator, H3PO4, protects the internal carbon structure and prevents the product from excessive burn off. According to this experimental result, 50% H3PO4 was considered as optimum condition. Low MC, VM, and Ac with higher value of FC, indicates better quality of AC.
According to this experimental result, the optimized condition to prepare best quality of BWAC is 25% NSC, 50% H3PO4 and 450°C.

Figure 4: Effect of a) Temperature b) % of NSC and c) Impregnating concentration of H3PO4 % on the content of MC, AC, VM and FC in the prepared BWAC.
To compare the effect of NSC on the prepared BWAC, THAC (0% NSC) was taken as control and it was prepared by following the same procedure. The FC in THAC is lower in both Figures 5a and 5b as compared to (Figures 4a and 4c) which was prepared under same condition [19]. The proximate analysis result of THAC had shown similar trends as of BWAC with the variation of H3PO4 concentration and pyrolysis temperature. However, Figure 5 clearly shows lower MC, AC and VM as compared to THAC that was reported by but it shows lower FC content as compared to BWAC in the present study.

Figure 5: Proximate analysis of THAC as a function of A) impregnating concentration of H3PO4 and B) temperature.
The proximate analysis result of the BWAC and THAC which are prepared under optimum parameters were compared with previous reports (Table 1). The prepared BWAC had shown less VM, low MC and Ac and higher FC than reviewed report results.
| Adsorbent | Moisture content | Ash content | Volatile matter | Fixed carbon |
|---|---|---|---|---|
| Corncob | 4.19 | 2.38 | 82.58 | 10.85 |
| Dipterocarpus alatus fruit | 12.12 | 7.69 | 23.08 | 56.39 |
| THAC | 10.1 | 17.5 | 21.2 | 51.2 |
| Plantain fruit stem | 10.33 | 20 | 23.33 | - |
| Tea waste | 3.72 | 30.9 | 64.3 | - |
| BWAC | 1.32 | 17.58 | 19.64 | 61.46 |
| THAC | 3.02 | 19.66 | 23.52 | 53.8 |
Table 1: Comparison of proximate analysis of the prepared BWAC and THAC with various adsorbents.
BET analysis
The specific surface areas of the prepared adsorbent materials (BWAC and THAC) (prepared under optimized conditions) were 841.955 m2/g and 248.197 m2/g respectively (Figure 6). According to this experimental result, the BWAC has shown higher surface area as compared to THAC. This can be justified by different chemical nature of NSC that synergizes the properties of the prepared BWAC. As a result, addition of NSC with the right proportion helps to increase the surface area of the BWAC which might be due to formation of more cage like structure which might be a space occupied by fatty residue in NSC. Higher specific surface area increases adsorption efficiency by increasing active adsorption site. Hence, the addition of optimum amount of NSC with suitable activation condition could lead to the formation of large surface area through formation of more porous structure.

Figure 6: Specific surface areas of THAC (chanel 1) and BWAC (chanel 2).
X-ray diffraction XRD analysis
The XRD spectrum of the prepared BWAC (Figure 7) was obtained to investigate the amorphous and/or crystalline nature. The XRD spectrum of the prepared BWAC shows amorphous nature with a broad peak centered at about 2θ angle of 24.2°. The peak around 42.1° might be from crystalline carbon with expanded lattice. Similar XRD pattern is reported by Jawad, et al., for activated carbon produced from coconut leaf using H3PO4 activation.

Figure 7: XRD spectrum of optimized BWAC.
FTIR analysis
The surface chemistry of the activated carbon plays a key role in dye adsorption performance. An FTIR spectrum of BWAC and THAC was determined to study the surface chemistry of the adsorbent materials as shown in Figure 8. The band at 1563.89 cm-1 could be attributed to C=C alkene stretch which might be the result of formation of aromatic compounds in both cases. The band at 1160.88 cm-1 and 1036.12 cm-1 may correspond to C-O stretching of surface OH group and P+-O- in residual phosphate esters. This absorption is stronger in the THAC spectrum which might be due to adsorption of moisture and CO2 on the surface. The FTIR spectrum shows the presence of various active adsorption groups on both BWAC and THAC surfaces.

Figure 8: FTIR spectra of BWAC and THAC.
SEM image of BWAC and THAC
The surface morphology of the adsorbents (prepared under optimized conditions) was evaluated by using SEM images of the two products (Figure 9). This is because the surface roughness reflects the surface area of the adsorbents and may provide clue of internal porosity The morphology of BWAC (Figure 8a) shows rough structure while Figure 8b (image of THAC) displays relatively smooth surface which looks dough. The well-developed surface of BWAC would be due to evaporation of fatty compounds in the NSC that leave extra space which was previously occupied. This result is in agreement with BET analysis results and confirms the synergic effect of NSC on the current BWAC.

Figure 9: SEM image of (a) BWAC and (b) THAC.
PZC determination
The determination of the PZC of the adsorbent is important to identify the pH region in which a maximum adsorption can be occurred. In this experiment the PZC is 7.78 as shown in Figure 10. The wavelength at which strong absorption (λmax) was determined for BB 41 dye at laboratory condition and it was 606 nm (Figure 11).

Figure 10: The pH PZC determination of the adsorbent.

Figure 11: Determination of λmax from dilute solution of BB 41 dye.
Optimization of adsorption factors for removal of BB 41 dye on BWAC and THAC
A pH of solution affects adsorption process by modifying the chemical nature (surface charge and functional groups) of both adsorbate and adsorbents. The BB 41 dye removal efficiency and capacity of the BWAC at different pH was evaluated as shown in Figure 12a. The experimental result shows that the BB 41 dye removal efficiency and capacity of the adsorbent was increased as the pH value raised to 9 which might be due to de protonation of the adsorbent surface that facilitate adsorption of the cationic dye through strong electrostatic interaction. Further increase of pH value beyond 9, the adsorption efficiency and capacity was decreased back. The reduced adsorption efficiency and capacity at higher pH could be due to hydroxylation of active sites of adsorbent surface that decrease the electrostatic interaction of the cationic BB 41 dye. According to this experiment, the optimum pH value was 9 with 99.96%adsorption efficiency and 49.98% adsorption capacity for removal of BB 41 dye. For the pH of the solution higher than 7.78, the BB 41 removal efficiency was raised since at higher pH the adsorbent surface was deprotonated and electrostatic attraction become dominant. This indicates that BWAC adsorbs BB 41 dye in moderate basic regions.
During dose optimization experiment, the BB41 dye removal efficiency of BWAC was increased from 97.09% to 98.11% when the adsorbent dosage was raised from 0.1 g to 0.2 g. But, further increase of adsorbent dose, did not show significant change of adsorption efficiency and adsorption capacity (Figure 12b). Maximum removal efficiency was observed at the low adsorbent amount (0.1 g–0.2 g), which might be due to the availability of active sites for the adsorption of BB 41 that results more interaction between the dye and adsorbent. Because as the adsorbent dose was increased beyond 0.2 g, the adsorption efficiency was slightly decreased this might be due to overlapping of surfaces at high dose that can hinder adsorption of molecules. Therefore, the highest adsorption efficiency (98.11%) and adsorption capacity (97.09 mg/g) were obtained with 0.2 g adsorbent and it was considered as optimum dosage for this experiment.
Contact time optimization was done at pH 9 and with 0.2 g adsorbent dose in the time rage that was designed. In the first segment of the experiment (from 20 to 60 mins) (Figure 12c) fast adsorption was observed which might be due to availability of adsorption sites and high interaction frequency between the dye molecules and the adsorbent surface. As more time elapsed, the adsorption increment became very slight (60 mins-120 mins) until it get levelled (120 mins–140 mins). This is just by the decrease of adsorption cites and interaction frequency between the adsorbent and the dye molecule. The percentage removal was 98.02% and 98.26% at 60 and 140 mins respectively. Therefore, by considering time economy, 60 min was considered as optimum contact time for this study.
The effect of initial BB 41 concentration was evaluated to study the dependence of the adsorption process on concentration with a fixed binding active sites found on the adsorbent surface [20]. This experiment was conducted under optimized parameters (adsorbent dose=0.2 g, pH=9 and contact time=60 min). The removal efficiency of the adsorbent was at maximum with initial concentration but it was decreased with increasing concentration of the dye (Figure 12d). At lower concentrations, all adsorbate ions in the test solution could interact with the binding sites of the adsorbent and result relatively higher dye removal efficiency. However, the removal efficiency was decreased gradually as the initial concentration was raised. The percentage removal of BB 41 was decreased from 96.36% to 96.00% as the initial concentration varied from 25 mg/L to 50 mg/L. However, the percentage removal of BB 41 dye was decreased from 96.36 mg/g to 92.57 mg/g as the initial concentration was increased from 25 mg/L to 125 mg/L since active adsorption sites become saturated. As a result, the concentration of remaining BB 41 was increased with increasing initial concentration and become beyond environmentally recommended level. In this experiment 50 mg/L was taken as optimum initial concentration because the final remaining concentration was about 1.617 mg/L which is in the acceptable range.

Figure 12: Effect of a) pH, b) Adsorbent dosage, C) Contact time and d) Initial dye concentration on adsorption efficiency of BWAC for BB 41 removal.
Comparison of adsorption efficiency of the prepared BWAC, THAC and commercial AC under optimized conditions
An adsorption experiment was done using the prepared THAC (0% NSC), BWAC (25% NSC) and a commercial AC to compare their efficiency for the removal of BB 41 dye under optimized condition (50 mg/L BB41 dye, 0.2 g adsorbent dose, at pH 9 and 60 mins contact time). The adsorption efficiency of the prepared BWAC (96.77%) was better than both the commercial AC (93.35%) and THAC (90.72%) (Table 2) to remove BB41. The efficiency of the commercial AC was less than the adsorption efficiency of the prepared BWAC even though its surface area is relatively higher. This performance difference might be due to raw material difference and surface contamination of the commercial AC as it is not freshly prepared.
| Adsorbent | Final concentration mg L-1 | % Removal |
|---|---|---|
| 25% NSC, 50% H3PO4, 450°C | 1.617 ± 0.012 | 96.77 |
| 0% NSC, 30% H3PO4 @450°C | 4.638 ± 0.012 | 90.72 |
| Commercial AC | 2.326 ± 0.068 | 93.35 |
Table 2: The adsorption efficiency of commercial AC, BWAC and THAC (control) for the removal of BB 41 dye.
Langmuir isotherm model
The experimental data was evaluated against Langmuir and Freundlich isotherm models using correlation coefficient (R2) at equilibrium between adsorbate in the liquid and adsorbate adsorbed on surface of the adsorbent. The Langmuir isotherm model was applied for the data obtained from batch adsorption experiment at room temperature with different initial BB 41 dye concentration (25 mg/L to 125 mg/L) under optimized adsorption factors (pH 9, adsorbent dose 0.2 g, 60 mins contact time). The value of Langmuir constant was calculated from the slope and intercept of the linear equation of 1/qe versus 1/Ce. The equilibrium data was linearly fitted to Langmuir isotherm model with R2=0.997. This is an indication of the adsorbent surface homogeneity. This experimental result is similar to previously reported research result (Figure 13).

Figure 13: Langmuir linear isotherm data for BB 41 adsorption on BWAC under optimized adsorption conditions.
Freundlich isotherm model
Freundlich isotherm is a multilayer, non-uniform and heterogeneous adsorption of adsorbate to adsorbent. The linear form of Freundlich isotherm (Figure 14) best fits to the current experimental data compared to Langmuir model with R2=0.999. The Freundlich constants of Kf and n are obtained from the plot of lnqe versus lnCe that provided a regression line with a slope of 1/n and intercept of lnKf (Table 3). The value of n is 1.209 which is greater than 1, which means that the adsorption of BB 41 onto BWAC is favourable. As result, this experimental data best fits to the Freundlich isotherm model.

Figure 14: Freundlich isotherm for BB41 adsorption by BWAC at optimum condition.
| Langmuir model | Freundlich model | ||||
|---|---|---|---|---|---|
| KL (L/mg) | Qm (mg/g) | R2 | KF (mg/g) (L/mg) | N | R2 |
| 0.104 | 142.86 | 0.997 | 397.19 | 1.209 | 0.999 |
Table 3: Langmuir and Freundlich adsorption parameters for BB 41 adsorption on BWAC.
Adsorption kinetics
In this experiment, pseudo fist and pseudo second kinetic models were considered and compared using regression coefficient (R2) in the range of 20 to 100 min from batch experimental data obtained. The pseudo first order adsorption model parameters were determined from the regression line log (qe-qt) versus time (t) and the value of pseudo first order parameter constants are summarized. Here, the value of R2 is 0.923 (Figure 15).
During the pseudo second order kinetic model evaluation, the value of K2 and qe were calculated from the line t/qt versus t using the slope and intercept respectively (Table 4). When the two kinetic models compared, the pseudo second kinetic model is well fitted than the pseudo first kinetic model with R2=0.999 (Figure 15). This condition indicates that the adsorption of BB 41 dye onto BWAC is more controlled by chemisorption. As a result, the BB 41 adsorption kinetic could be better described by pseudo second order model which is controlled by the chemical reaction. Similar elaboration has been justified by Humelnicu, et al., for BB 41 adsorption onto natural zeolitic from aqueous solution.

Figure 15: a) Pseudo 1st order and b) Pseudo second order kinetic model evaluation for the data obtained at optimized adsorption conditions for the removal of BB 41 dye by BWAC.
| Kinetics model | Pseudo first order model | Pseudo second order model | ||||||
|---|---|---|---|---|---|---|---|---|
| Parameters | qe, exp (mg/g) | qe, cal (mg/g) | K1 (min-1) | R2 | qe, exp (mg/g) | qe, cal (mg/g) | K2 (g.m-1.min) | R2 |
| Values | 49.01 | 24.95 | 6.90E-05 | 0.923 | 49.01 | 25 | 0.16 | 0.999 |
Table 4: Comparison of the pseudo first and pseudo second order kinetics parameters for BWAC as adsorbent.
Adsorption thermodynamics
The thermodynamic parameters such as the Gibbs free energy (G°), Enthalpy (H°) and Entropy (S°) for the adsorption of BB 41 on BWAC were determined to investigate whether the adsorption process is endothermic or exothermic. The adsorption experimental data were obtained at four different temperatures and the linear plot of In Kc vs. 1/T was used to determine ΔH° and ΔS° thermodynamic parameters as of Senturk and Alzein (Figure 15).
When the temperature was increased from 298 K to 323 K, the ΔG° values were decreased from -6.77 kJ.mol-1 to -7.77 kJ.mol-1. The negative value of ΔG suggests that the adsorption of BB 41 dye onto BWAC is spontaneous which indicates that the adsorption is more favourable at high temperature.
The calculated value of ΔH° and ΔS° are positive (Table 5). This indicates that the adsorption process is endothermic due to the chemical interaction between adsorbate and adsorbent, while the positive value of ΔS° re lects the increase in randomness state at the solid/solution interface during the adsorption. This result is consistent and constructive to all indings discussed above.
| T (K) | ΔG° (kJ.mol-1) | ΔH° (kJ.mol-1) | ΔS° (J.mol-1.K-1) |
|---|---|---|---|
| 298 | -6.77 | 5.146 | 40 |
| 303 | -6.97 | ||
| 313 | -7.37 | ||
| 323 | -7.77 |
Table 5: Thermodynamics data for the adsorption of BB 41 onto BWAC.
Applicability and performance of the prepared BWAC for real sample treatment
To study the efficiency of the adsorbent for textile effluent treatment, batch adsorption experiments were conducted using real sample collected from KK Textile Industry. The concentration of BB 41 in the real textile effluent was determined computing from a calibration line obtained from freshly prepared BB 41 dye test solutions (5 mg/L–15 mg/L). The mean value of the concentration of BB 41 in the real sample was 9.709 mg/L before adsorption experiment. A ter adjustment of pH, adsorption experiment was conducted under optimized condition and the removal efficiency of BB 41 by BWAC was 98.04% (Table 6). This experiment con irms that the prepared adsorbent is effective to remove BB 41 and other pollutants having similar chemical nature from textile wastes.
| Initial concentration (mg/L) | Final concentration (mg/L) | % removal |
|---|---|---|
| 9.709 | 0.979 ± 0.0006 | 98.04 |
Table 6: Initial and final concentration of BB 41 from textile wastewater and removal efficiency of BWAC under optimized condition.
Comparison of adsorption capacity of BWAC with literature
The adsorption capacity of BWAC was compared with other bio waste adsorbents used for the removal of BB 41 dye, reported by other authors (Table 7). As it is displayed in the table, the BWAC has better adsorption capacity than most recent reported materials for BB41 dye adsorption. This better performance can be justified by its high surface area and surface chemical nature developed from mixed biomasses, optimized pyrolysis process and optimized adsorption condition. This experiment has resulted the expected product (BWAC) with better performance than THAC (control) and reference (commercial AC).
| Adsorbents | qm (mg/g) |
|---|---|
| Black tea leaves | 23.5 |
| Bituminous shale | 26 |
| Rice husk | 35.43 |
| Brick waste | 60-70 |
| Pistachio shell | 41.77 |
| Waste bricks | 32 |
| THAC | 47.57 |
| BWAC | 49.01 |
Table 7: Comparison of adsorption capacities of different adsorbents for the removal of BB 41 dye.
Conclusion
This study has investigated the preparation and characterization of BWAC from TH and NSC and evaluation of its performance for adsorption of BB 41 dye from laboratory sample and real sample. Different factors; temperature, composition of NSC and TH, impregnation chemical solution were optimised during preparation of BWAC and 450°C, 25% NSC and 50% H3PO4 were determined as optimum values. Proximate analysis of the prepared BWAC had shown good adsorbent properties. The SEM and BET analysis of the prepared THAC (control) and BWAC had shown good surface features and surface areas. The prepared THAC and BWAC were compared based on their adsorption efficiency and capacity for the removal of BB 41 from laboratory sample and BWAC was better than THAC. The FTIR spectra of the THAC and BWAC display almost similar surface chemistry. The XRD analysis of BWAC had shown the amorphous nature of the prepared adsorbents. The factors that affect adsorption efficiency of the adsorbent were optimized one by one and pH of 9, 0.2 g adsorbent dose, 60 min contact time and 50 mg/L initial concentration were determined as optimum values. The adsorption equilibrium data was tested against Langmuir and Freundlich adsorption models and the experimental data was well fitted by Freundlich adsorption model. The adsorption kinetics of the experiment was also studied and it was well described by the second order isotherm model and thermodynamics parameters indicate that the adsorption process is spontaneous and endothermic. In general, the prepared adsorbent is effective to remove BB 41 from textile waste with adsorption efficiency of 98.04% under optimized condition. So, mass production of BWAC from bio wastes is promising and feasible with economic and environmental advantages to supply for textile industries.
References
- Adane T, Haile D, Dessie A, Abebe Y, Dagne H (2020) Response surface methodology as a statistical tool for optimization of removal of chromium (VI) from aqueous solution by Teff (Eragrostis teff) husk activated carbon. Appl Water Sci 10:1-13
- Ahmad A, Khan N, Giri BS, Chowdhary P, Chaturvedi P (2020) Bioresource technology removal of methylene blue dye using rice husk, cow dung and sludge biochar: Characterization, application and kinetic studies. Bioresour Technol 306:123202
[Crossref] [Google Scholar] [PubMed]
- Amir M, Anwar-ul-Haq AS, Salma B, Gul R (2019) Basic blue dye adsorption from water using polyaniline/magnetite (Fe3O4) composites: Kinetic and thermodynamic. Materials 12:1764
[Crossref] [Google Scholar] [PubMed]
- Ashrafi SD, Kamani H, Arezomand HS, Yousefi N, Mahvi AH (2016) Optimization and modeling of process variables for adsorption of basic blue 41 on NaOH modified rice husk using response surface methodology. Desalination and Water Treat 57:14051–14059
- Babaei AA, Takdastan A, Hassani G, Shirmardi M, Esmaeili S, et al. (2017) Adsorption of basic blue 41 dye on modified tea waste: Optimization and kinetic studies. Int J Adv Biotechnol res 8:357–368
- Baseri JR, Palanisamy PN, Sivakumar P (2012) Preparation and characterization of activated carbon from Thevetia peruviana for the removal of dyes from textile waste water. Adv Appl Sci Res 3:377–383
- Bes-Pia A, Cuartas-Uribe B, Mendoza-Roca JA, Alcaina-Miranda MI (2010) Study of the behaviour of different NF membranes for the reclamation of a secondary textile effluent in rinsing processes. J Hazard Mater 178:341–348
[Crossref] [Google Scholar] [PubMed]
- Charola S, Patel H, Chandna S, Maiti S (2019) Optimization to prepare porous carbon from mustard husk using response surface methodology adopted with central composite design. J Clean Prod 223:969–979
- Chowdhury M, Hossain MB (2018) Removal of various textile dyes from aqueous solution using low cost biodegradable adsorbent. Eur Sci J 14:298–311
- Collin SMA, Wan GJ, Ashri M, Wan B (2015) Preparation and characterization of activated carbon from Typha orientalis leaves. Int J Ind Chem 6:9–21
- Ekpete OA, Marcus AC, Osi V (2017) Preparation and characterization of activated carbon obtained from plantain (Musa paradisiaca) fruit stem. J Chem 2:8635615
- Feng P, Li J, Wang H, Xu Z (2020) Biomass based activated carbon and activators: Preparation of activated carbon from corncob by chemical activation with biomass pyrolysis liquids. ACS Omega 5:24064–24072
[Crossref] [Google Scholar] [PubMed]
- Gosavi VD, Sharma S (2014) A general review on various treatment methods for textile wastewater. J Env Sci Comput Sci Eng Technol 3:29–39
- Hossain MA (2020) Kinetics and thermodynamics of adsorption of basic blue 41 on used black tea leaves. Int J Sci Eng 8:995-1002
- Humelnicu I, Baiceanu A, Ignat ME, Dulman V (2017) The removal of basic blue 41 textile dye from aqueous solution by adsorption onto natural zeolitic tuff: Kinetics and thermodynamics. Process Saf Environ Prot 105:274–287
- Islam MN, Sarker J, Khatton A, Hossain SMM, Sikder HA, et al. (2022) Synthesis and characterization of activated carbon prepared from jute stick charcoal for industrial uses. Sci Int J Mater Sci 5:33–39
- Jawad AH, Bardhan M, Islam MA, Islam MA, Syed-Hassan SSA, et al. (2020) Insights into the modeling, characterization and adsorption performance of mesoporous activated carbon from corn cob residue via microwave assisted H3PO4 activation. Surf Interfaces 21:100688
- Jawad AH, Rashid RA, Azlan M, Ishak M, Wilson LD, et al (2016) Adsorption of methylene blue onto activated carbon developed from biomass waste by H2SO4 activation: Kinetic, equilibrium and thermodynamic studies. Desalination Water Treat 57:25194-25206
- Jawad AH, Sabar S, Ishak MAM, Wilson LD, Ahmad Norrahma SS, et al. (2017) Microwave assisted preparation of mesoporous activated carbon from coconut (Cocos nucifera) leaf by H3PO4 activation for methylene blue adsorption. Chem Eng Commun 204:1143–1156
- Katheresan V, Kansedo J, Lau SY (2018) Efficiency of various recent wastewater dye removal methods: A review. J Environ Chem Eng 6:4676–4697
Open Access Journals
- Aquaculture & Veterinary Science
- Chemistry & Chemical Sciences
- Clinical Sciences
- Engineering
- General Science
- Genetics & Molecular Biology
- Health Care & Nursing
- Immunology & Microbiology
- Materials Science
- Mathematics & Physics
- Medical Sciences
- Neurology & Psychiatry
- Oncology & Cancer Science
- Pharmaceutical Sciences