ISSN : ISSN: 2576-1455
Journal of Heart and Cardiovascular Research
Is One Lead Registered Ecg Able to Reflect the Whole Picture of the Main Electrocardiographic Parameters Characteristic for Healthy Patients as well as for Myocardial Ischemia Ones?
Alexander Shmid, Maxim Novopashin and Andrey Berezin*
EC-leasing, Varshavskoye Shosse, Moscow, Russian Federation
- *Corresponding Author:
- Andrey Berezin
EC-leasing, Varshavskoye Shosse
Moscow 113405, Russian Federation
Tel: 89671280467
E-mail: artparis@mail.ru
Received Date: 28 October 2017; Accepted Date: 16 November 2017; Published Date: 27 November 2017
Citation: Shmid A, Novopashin M, Berezin A (2017) Is One Lead Registered ECG Able to Reflect the Whole Picture of the Main Electrocardiographic Parameters Characteristic for Healthy Patients As Well As for Myocardial Ischemia Ones? J Heart Cardiovasc Res. Vol. 1 No. 3: 110.
Copyright: © 2017 Shimid A, et al. This is an open-access article distributed under the terms of the creative Commons attribution License, which permits unrestricted use, distribution and reproduction in any medium, provided the original author and source are credited.
Abstract
Electrocardiograms (ECG) remain the main noninvasive tool that cardiologists use first for examining CAD in clinical practice. Since the invention of cardiograph, the cardiologists following the original Eindhoven construction traditionally have been using 12 lead electrodes kit for registering ECGs. However, together with development of telemedicine the one lead electrode ECG registering is in high demand. The heart, being a self-sustained oscillatory system could be possibly analyzed through studying the Fourier spectrum features of the ECG registered by any of the 12 conventional leads, which remind electricity consumer’s lines going from a central generating power station – the heart. So far, any lead as any electrical line may contain the overwhelming heart dynamic characteristics by analogy with the parameters of the central electric generator.
Keywords
Electrocardiogram; Cardiograph; Lorenz system; Fourier spectra
Introduction
A group of Chinese researches has suggested a new method for early detection of myocardial ischemia cardiodynamicsgram (CDG) [1,2] in which cardio signals received from 12 leads were converted into three signals and on their basis the attractors for healthy people ECGs as well as for patients with myocardial ischemia, undefinable by ECG pattern [3], were built.
As it was shown in the paper [4], the heart can be interpreted as a multi degrees of freedom dynamic system possessing with such modes of functioning as regular beatings, fibrillation, and special kind of dynamics in cases of ischemia. To cover these modes of functioning a simple mathematical model including non-linear resonance concept [5] has been elaborated. The model included two additively and parametrically coupled Van der Pol equations with a time lag. The work of the model resulted in generating the model ECG Fourier spectrum close to that of regular ECGs registered in 10 healthy patients and in 4 patients with post myocardial infarction ischemia as well. Since the heart represents an open thermodynamic system, another approach can be applied to its analysis, based on the Lorenz system [6], which the author suggested for the description of the perturbed flow dynamics. Accounting that the Van der Pol equation with a time lag is reduced to the Lorenz system of equations [7,8] we can use two additively and parametrically coupled Lorenz systems for describing the heart electrical activity, which look in the following way:
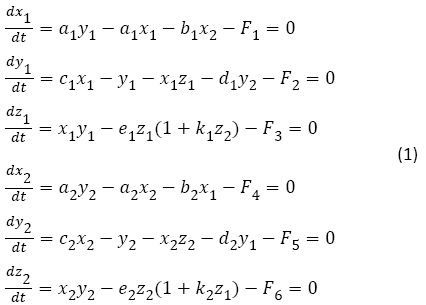
Where x1 is the magnitude proportional to the distortion of the ionic whole myocardium surface flowing current profile from linearity, x2 is the magnitude proportional to the ionic current flowing through the myocardium surface locality, y2 is the magnitude proportional to the electric potential difference between the external and internal surfaces of the myocardium locality, z2 is the magnitude proportional to the distortion of the ionic myocardium locality surface flowing current profile from linearity, a1,a2,b1,b2,c1,c2,d1,d2,e1,e2,k1,k2 constant coefficients, F1,F2,F3,F4,F5,F6 - random functions.
The computer study of the model (1) manifested solutions in a form of Fourier spectra close to real ECG Fourier spectra of healthy people (Figures 1 and 2). Worth emphasizing, that running the program in succession revealed its correspondence to the described earlier the FPU auto recurrence type of dynamics characterized for the ECG Fourier spectrum (Figures 3-7).

Figure 1: Fourier spectrum of the model electrocardiogram of a healthy patient. Note: Horizontal axis - frequency vertical axis - amplitude, conditional units.

Figure 2: 3D attractor image of model (1) solution reflecting the dynamics of electrical heart activity characteristic for healthy persons. Note: Axis x1+x2, y1+y2, z1+z2 conditional units.

Figure 3: Fourier spectrum of the model electrocardiogram of a patient with myocardial ischemia. Horiz.axis - frequency vert.axis - amplitude, conditional units.

Figure 4: 3D attractor image of model (1) solution reflecting the dynamics of electrical heart activity characteristic for patients with myocardial ischemia axis x1+x2, y1+y2, z1+z2 conditional units.

Figure 5: Fourier spectrum of model electrocardiogram corresponding to the state of fibrillation of the heart muscle. Horiz.axis – frequency, vert.axis - amplitude, conditional units.

Figure 6: 3D strange attractor image of model (1) solution reflecting the dynamics of electrical heart activity characteristic for fibrillation mode corresponding to the strange attractor solution of the Lorenz system. Axis x1+x2, y1+y2, z1+z2 conditional units.

Figure 7: 3D attractor image of model (1) solution reflecting stoppage of the dynamics of electrical heart activity in modeling asystole mode and turning 3D attractor into two dimensional one. Axis x1+x2, y1+y2, z1+z2 conditional units.
Discussion
The main result of the research is that it was proven through mathematical modeling and the computer study of real ECGs Fourier spectra of cardiological patients that the coupled Lorenz system is able to describe the 3D electrical dynamics of such attractor media as myocardial tissue manifesting different attractor pictures for healthy individuals and patients with myocardial ischemia as well as the fibrillation mode of heart corresponding to the strange attractor solution of the Lorenz system. The asystole mode was characterized by turning 3D attractor into two dimensional one. Using the proposed Lorenz approach allowed to come to conclusion that one lead electrical signal from the heart instead of conventionally used 12 leads may contain the overwhelming heart dynamic characteristics including the features of the ECG Fourier spectra and distinguish “healthy” attractors from “pathological” ones. Moreover, the Lorenz approach may reveal some small attractors, arising at the background of the main ECG attractor and being characteristic of other not only heart disorders.
Conclusion
The laws of thermos convection proved to be applicable to the description of the ionic current flowing in the myocardial tissue within the framework of the Lorenz system. Classical solution of the Lorenz system in the strange attractor form corresponded in the model to the heart fibrillation mode. It says in favor of universality of distributed dynamic systems possessing order to chaos mode of functioning. Together with that healthy and some pathological sates of heart may be possibly manifested in the attractor parameters of coupled Lorenz systems.
References
- Braunwald E (1997) Heart Disease: A textbook of cardiovascular medicine (5th edn.). W.B. Saunders Co., Philadelphia. pp: 108.
- Deng M, Tang M, Tang M, Wang MTC, Wang C, et al. (2017) Cardiodynamicsgram as a new diagnostic tool in coronary artery disease patients with nondiagnostic electrocardiograms. The Am J Cardiol 119: 698-704.
- Moyer VA (2012) Screening for coronary heart disease with electrocardiography: U.S. Preventive Services Task Force recommendation statement. Ann Intern Med 157: 512-518.
- Novopashin MA, Shmid AV,Berezin AA (2017) Forrester’s concept in modeling heart dynamics. IOSR J Comput Eng 19: 113-121.
- ChirikovBV (1971) Research concerning the theory of non-linear resonance and stochasticity. Nuclear PhysInst of Siberian section of Acad. Sci, USSR, No. 267.
- Lichtenberg AJ, Liberman MA (1992) Regular and chaotic dynamics. Applied Mathematical Sciences.
- Udovich VI (1977) Asymptotics of the Lorenz system limiting cycles under large Rayleigh numbers. Rostov State University, Russia.
- Novopashin MA, Shmid AV,Berezin AA (2017) Fermi-Pasta-Ulam auto recurrence in the description of the electrical activity of the heart. Med Hypotheses 101:12-16.

Open Access Journals
- Aquaculture & Veterinary Science
- Chemistry & Chemical Sciences
- Clinical Sciences
- Engineering
- General Science
- Genetics & Molecular Biology
- Health Care & Nursing
- Immunology & Microbiology
- Materials Science
- Mathematics & Physics
- Medical Sciences
- Neurology & Psychiatry
- Oncology & Cancer Science
- Pharmaceutical Sciences