ISSN : ISSN: 2576-1412
Journal of Applied Microbiology and Biochemistry
Identification of Ethanologenic Yeast Strains from Wild Habitats
1School of Life Sciences, University of Nottingham, Nottingham, United Kingdom
2School of Biosciences, University of Nottingham, Loughborough, United Kingdom
3University of Huddersfield, School of Applied Sciences, Huddersfield, United Kingdom
4Centre for Genetic Architecture of Complex Traits, University of Leicester, United Kingdom
- *Corresponding Author:
- Darren Greetham
School of Applied Sciences
University of Huddersfield, Queensgate
Huddersfield, HD1 3DH, UK.
Tel: 07772633907
E-mail: Darren.greetham@hud.ac.uk
Received date: June 16, 2018; Accepted date: July 04, 2018; Published date: July 11, 2018
Citation: Farooq AS, Greetham D, Somani A, Marvin ME, Louis EJ, et al. (2018) Identification of Ethanologenic Yeast Strains from Wild Habitats. J Appl Microbiol Biochem. Vol.2 No.3:9
DOI: 10.21767/2576-1412.100025
Abstract
Bioethanol generated from household, agricultural or forestry waste is currently being pursued as the second generation biofuel with wheat straw being highlighted as a promising lignocellulosic residue feedstock in the UK. Natural fermentative ecosystems such as agricultural manure and forest floors containing decomposing wood and leaf litter are potential sources of yeast strains with suitable phenotypic characteristics for improved production of bioethanol. Identifying yeast with innate fermentation capabilities could potentially contain a pool of genes that confer resistance to the chemical constituents of lignocellulosic biomass. Wild yeasts were analysed using a phenotypic microarray for utilization of xylose and tolerance to pre-treatment inhibitors. Assays identified yeast which had stress tolerant phenotypes and yeast with xylose utilization capabilities. Performance fermentations confirmed desirable phenotypes such as conversion of xylose into ethanol and inhibitor tolerance, making these yeasts of interest for further industrial exploration and exploitation.
Keywords
Bioethanol; Phenotypic microarrays; Wild yeast; Fermentative ecosystems; Manure heaps
Introduction
Biofuels, as an alternative liquid fuel, have environmental benefits over use of fossil fuels, being economically competitive and producible in sufficient quantities to impact on future energy requirements [1]. Lignocellulosic biomass (LCM) includes the organic fraction/part of forestry, agricultural products, related industries and municipal waste, including wood, straw, energy crops, agricultural waste, agro-industrial waste, plants and animal waste. The use of biomass offers great opportunities for the production of biofuels as it’s an abundant and renewable source [2].
Ethanol has been highlighted as an alternative fuel for the future, especially within the transport sector as a liquid fuel [3]. A typical conversion of lignocellulose to ethanol consists of: (i) pre-treatment of plant biomass to permit effective hydrolysis by enzymes; (ii) hydrolysis to yield sugars for fermentation; and finally (iii) fermentation of sugars into ethanol [4]. The main challenges in advanced bioethanol production are cheap and efficient technologies to release all fermentable sugars from lignocellulosic biomass and rapidly ferment mainly glucose and D-xylose[5,6]. Saccharomyces cerevisiae is considered as an ideal industrial organism [7] because it has high ethanol tolerance and can produce ethanol with high titre using hexose sugars, however wild S. cerevisiae is unable to utilise pentose sugars such as xylose. Efficient fermentation of xylose is required to develop economically viable processes for bioethanol production [8]. Extensive genetic modification has produced yeast strains with the capacity for converting xylose into ethanol through expression of xylose pathway enzymes [9], use of bacterial xylose isomerase [10,11] or through overexpression of the pentose phosphate pathway (PPP) [12].
The nature and concentrations of degradation products formed during pre-treatment are dependent on the type of biomass source material and the type of pre-treatment processes employed. Sugar degradation products such as furfural and hydroxymethylfurfural (HMF) are formed from pentose under auto-hydrothermal or acid-hydrothermal conditions at relatively high temperatures (180-220°C) [13]. Acetic acid is ubiquitous in hydrolysates where hemicellulose and components of the plant cell wall have acetyl groups which can undergo hydrolysis [13]. Formic acid may be formed as a by-product of sugar and lignin breakdown, whereas levulinic acid is generated from the degradation of HMF [13]. The lignin component of the plant material is particularly problematic because inhibitors are generated during cleavage and solubilisation of the aromatic subunits, producing phenolic compounds including, ferulic acid, syringaldehyde, vanillin and vanillic acid, all of which are potential inhibitors of the fermentation process [13].
There is a need for new yeast strains capable of fermenting various types of hydrolysates derived from biomass into bioethanol, as laboratory strains have been proven to be unsuitable without extensive genetic modification for industrial bioethanol production [14]. New yeasts may be found in ecosystems which are reservoirs of microorganisms that can be manipulated and utilized by biotechnology for industrial purposes. For example, following harvest, straw is often ploughed back into the land to decompose naturally as a soil conditioner, it is used as animal bedding where it is defecated upon, composted and returned to the fields as an organic fertilizer. Additionally, straw is often used as supplemental winter feed for ruminant livestock with digestive systems containing plant degrading micro flora that are passed through host faeces [15]. Bio-prospecting within these microbial communities will increase the available gene pool and may allow us to address the metabolic problems currently associated with industrial bioethanol production. Environments with rich agricultural activity are potential sources for isolating multiply resistant yeasts that are capable of withstanding number of fermentation-related stresses relevant to secondgeneration bioethanol production. For example, yeast isolated from the sugarcane juice from distillery in Brazil have been shown to possess the ability to ferment sugarcane juice, having high resistance to stress conditions, highlighting the rewards of strain identification associated with bio prospecting [16].
Camarasa et al. [11] described the phenotypic landscape of Saccharomyces cerevisiae strains have adapted to a broad range of ecological niches that have moulded their metabolic networks to generate specific phenotypes [17]. Considerable phenotypic variation indicates that S. cerevisiae engages diverse metabolic strategies to face environmental limitations. Strains can be distinguished on the basis of specific traits. The strains obtained from fruits were found to achieve fermentation because of their ability to grow in the presence of high sugar concentrations whereas yeast isolated from oak trees or plants were growing in poor sugar environments therefore cannot ferment. S. cerevisiae showed origin dependant properties that provide evidence for phenotypic evolution driven by either environmental constraints or human selection within S. cerevisiae populations. Tolerance to inhibitors has been reported in yeast isolated from Mexican ecosystems [18], within the Saccharomyces spp genus [19] and ethanol tolerance [20,21].
In this paper, we have screened yeast strains isolated from natural lignocellulosic wastes such as forest floors and manure heaps for their ability to convert xylose into ethanol and tolerance to inhibitory compounds.
Materials and Methods
Yeast isolation and growth conditions
Yeast samples were isolated from manure heaps and forest floor fermentative ecosystems (Nottingham, September, UK). Soil/leaf litter and manure samples were taken using a sterile scalpel or spatula and deposited in sterile 15 mL vials in the field. Collection vials were stored for up to 3 days at 4°C before enrichment culturing. Upon return to the laboratory, vials were filled with sterile liquid enrichment medium (3 g/L yeast extract; 5.7 g/L glucose; 24.7 g/L xylose ; 1.6 g/L arabinose; 1.1 g/L galactose; 0.6 g/L mannose; 5 g/L peptone; 76 mL/L ethanol; 1 mg/L chloramphenicol (to prevent bacterial growth) adjusted to pH to 6.5 with 2M HCl), capped and incubated for approximately 10 days at room temperature without shaking, and inspected for CO2 production. Vials which were effervescing vigorously or with visible white sediment on the bottom of the vial indicated proliferation of yeasts or other cells. A 10 μL aliquot from each of these liquid enrichment cultures was streaked onto YPD agar (10 g/L yeast extract, 20 g/L peptone, 20 g/L glucose, and 20 g/L agar) and incubated at 30°C for 3 days. Colonies from these plates were picked and re-streaked onto YPD agar to obtain single colonies, these colonies were then inoculated into liquid YPD medium (10 g/L yeast extract, 20 g/L peptone, 20 g/L glucose), grown to stationary phase and stored in 15% glycerol at -80°C pending species identification
Reference strains S. cerevisiae S288C and Scheffersomyces stipitis NCYC 1540 (National collection of Yeast Cultures, www.ncyc. co.uk) were also included in these studies.
Phylogeny of wild isolated Yeasts
Yeast isolates were incubated using a shaking incubator at 30°C for 7 days in 20 mL straw carbon ratio medium (100 g/L glucose, 44 g/L xylose , 3 g/L arabinose, 2 g/L galactose, 1 g/L mannose, and 0.67 g/L yeast nitrogen). After fermentation, the fermentation broth was centrifuged at 3,500 g and the supernatant was stored at -20°C until further processing.
DNA extraction
A single yeast colony was grown overnight in 5 mL YPD media, DNA was extracted using epicentre DNA extraction kit (MasterPure Yeast, DNA Purification kit,) after digestion of RNA by RNAse (RNAse from Bovine Pancreas Sigma R6513). The extracted DNA was stored at -20°C. The purity of DNA was analysed by running on a 1% (w/v) agarose gel in 1 X TBE (Trizma Base, Boric acid and EDTA) buffer stained with ethidium bromide and visualized under UV light. A 1000-bp DNA Ladder (Bioline Hyperladder IV, 100 Lanes, Lot No: H4-107K) marker was used as the size standard.
Restriction of amplified DNA
Amplification and sequencing of the ITS region: The fungus specific universal primers ITS1 (5’-TCCGTAGGTGAACCTGCGG-3) and ITS4 (5’-TCCTCCGCTTATTGATATG-3’) were used to amplify the ITS region. PCR was performed in a total reaction volume of 50 μL consisting of 50 mM MgCl2, 5X DNA loading Buffer (Bioline 5x DNA Loading Buffer) Taq DNA polymerase (Sigma, US), 0.8 mM deoxynucleoside triphosphates (0.2 mM each), 2 μL of DNA template. PCR was carried out on a using Singer Instruments Rotor HAD colony array robot the following conditions: initial denaturation at 94°C for 5min; 40 cycles of denaturation (92°C for 30 sec), annealing (54°C for 45 sec); extension step (72°C) and a final extension step (72°C for 5 min). A negative control was performed with each run by replacing the DNA with the sterile water in the PCR mixture. All amplicons were purified using the PCR Clean UP System (Qiagen, US). The D1/D2 region of the large-subunit RNA gene was sequenced for species confirmation and clarification. Primers NL1 (5’-GCATATCAATAAGCGGAG GAAAAG-3’) and NL4 (5’-GGTCCGTGTTTCAAGACGG-3’) were used to amplify this region. The protocol for PCR amplification, PCR product purification and sequencing of the PCR products were the same as described for the ITS region.
FASTA sequence identification
Sequence data derived from the ITS domains were compared using the FASTA nucleotide similarity search function (https:// www.ebi.ac.uk/Tools/sss/fasta/nucleotide.htmL).
Phenotypic microarray analysis
Biology growth medium was prepared using 0.67% (w/v) yeast nitrogen base (YNB) supplemented with 6% (w/v) glucose from an 80% filter sterilised stock, 2.6 μl of yeast nutrient supplement mixture (NSx48- 24 mM adenine-HCl, 4.8 mM L-histidine HCl monohydrate, 48 mM L-leucine, 24 mM L-lysine-HCl, 12 mM L-methionine, 12 mM L-tryptophan and 14.4 mM uracil), and 0.2 μL of dye D (Biolog, Hayward, CA, USA). Final volume was made up to 30 μL using reverse osmosis (RO) sterile distilled water and aliquoted to individual wells with varying concentrations of appropriate inhibitors. Stock solutions (1M) of aliphatic weak acids such as acetic and formic acids were prepared using RO sterile water, however, coumaric acid, ferulic acid, furfural and HMF were prepared in 100% ethanol. For assays with xylose , an 80% xylose stock was prepared and aliquoted as described for glucose to give a 6% final solution (w/v).
Strains were prepared as described in Greetham et al., 2014 [22]. The inhibitory mix for mimicking the conditions encountered during pre-treatment of wheat straw consists of 15 mM furfural, 0.79 mM HMF, 85 mM acetic acid, 28 mM formic acid, 0.06 mM coumaric acid and 0.5 mM ferulic acid [23].
The OmniLog reader photographed the PM plates at 15 min intervals, and converted the pixel density in each well to a signal value reflecting cell growth and dye conversion. The suspended cell count of yeast strains was adjusted to 62% transmittance using a Biolog turbidimeter. Dye reduction which reflects metabolic activity of cells has been defined here as the redox signal intensity. After completion of the run, the signal data was compiled and exported from the Biolog software using Microsoft® Excel. In all cases, a minimum of three replicate PM assay runs were conducted, and the mean signal values are presented.
Measurement of yeast growth
Yeast growth under identical growth conditions as for PM assays was monitored for 50 hours with a reading every 15 mins using a Tecan (Mannedorf, Switzerland) Infinite M200 Pro plate reader, at 30°C for 50 hrs at OD600 with no shaking. The assay was performed in triplicate and an average reading was plotted
Confirmation of phenotypic microarray results using mini fermentation vessels
Fermentations were conducted in 180 mL mini-fermentation vessels (FV) (Wheaton glass bottles, Sigma-Aldrich, US). Cryopreserved yeast colonies were streaked onto YPD plates and incubated at 30oC for 48 hrs. Colonies of yeast strains were used to inoculate 20 mL of YPD broth, and incubated in an orbital shaker at 30ºC for 24 hrs. These were then transferred to 200 mL of YPD and grown for 48 hrs in a 500 mL conical flask shaking at 30°C. Cells were harvested and washed three times with sterile reverse osmosis (RO) water and then re-suspended in 5 mL of RO water. Under control conditions, 1.5 × 10⁷ cells mL-1 were inoculated in 99.6 mL of medium containing 4% glucose, 2% peptone, 1% yeast extract with 0.4 mL RO water. Under inhibitor stress, 1.5 × 10⁷ cells/mL were incubated in 99.6mL of medium containing 4% glucose, 2% peptone, 1% yeast extract with 15 mM furfural, 0.79 mM HMF, 85 mM acetic acid, 28 mM formic acid, 0.06 mM coumaric acid and 0.5mM ferulic acid. Volumes of media were adjusted to account for the addition of the inhibitory compounds (~400 μL) to ensure that all fermentations began with the same glucose content.
Micro-aerophilic conditions were prepared using a sealed butyl plug (Fisher, Loughborough, UK) and aluminium caps (Fisher Scientific). A hypodermic needle attached with a Bunsen valve was pushed through the rubber septum to facilitate the release of CO2. All experiments were performed in triplicate and weight loss was measured at each time point. Mini-fermentations were conducted at 30ºC, with orbital shaking at 200 rpm. For assays with xylose , cells were prepared as above and pitched at 1.5 × 10⁷ cells/mL into 100 mL 4% xylose , 2% peptone, and 1% yeast extract. All experiments were carried out in triplicate.
Litre Fermentation
Propagation: A starter culture was obtained by inoculating a L. jadinii colony from a growth plate into 5 mL of YPD in a sterile universal tube. This culture was incubated at 200 rpm at 30°C for 48 hrs. This 5 mL starter culture was transferred into 100 mL of YPD in a sterile 250 mL flask and incubated at 200 rpm at 30°C for 48 hours. The 100 mL culture was transferred into 1 L of YPD in a sterile 2 L baffled flask. The mixture was incubated at 150 rpm at 30°C for 24 hours. YPD (2L) was aerated in a 2 L stirred laboratory fermenter with stirring (200 rpm). The fermentation media consists of 4% glucose in YPD, the fermentation vessel contained 1900 mL of YPD and 100 mL of either RO water or inhibitor mix as appropriate. All experiments were run in triplicate.
Fermentation: Yeast from the propagation vessel was harvested by centrifugation (3600 g, 5 mins at room temperature) and resuspended in RO water to obtain 50% (w/v) slurry. The slurry was stored at 4°C until required further. Fermentation vessels were pitched at a rate of 1.5 x 10⁷ viable cells/mL. The fermentation vessels contained 2L of oxygenated YPD and 3mL of 15% antifoam. Wort was oxygenated by sparging the wort with pure oxygen at a rate of 30mL/min with continuous stirring. Fermentations were performed for 24 hours in a stirred water bath at 30°C.
Fermentation sampling: Fermentation sample (~20 mL) was taken at 0, 4, 6, 8, 10, 18 and 24 hours respectively. The sample was divided to determine cell counts by haemocytometer or OD600 values and then the cells were pelleted by centrifuge at 3,000 g, 4 mins, room temperature and supernatant was frozen for further analysis by HPLC.
Cell density: Cell counting was performed in a Neubauer counter chamber (haemocytometer) at 40X magnitude. The total number of yeast cells per mL of yeast culture or fermentation broth was calculated by following equation.

Where: a=number of yeast cells in the upper area of the haemocytometer
b=number of yeast cells in the lower area of the haemocytometer
To eliminate the possibility of counting yeast cells twice, the counting technique was standardized. Cells touching or resting on the top and right boundary lines of the haemocytometer were not counted, whilst cells touching or resting on the bottom or left boundary lines were counted. Yeast cells that had budded (daughter cells) were counted as one cell if the bud was less than one-half the size of the mother cell and as two cells when the bud was equal or greater than one-half size of the mother cell. To obtain an accurate yeast cell count, no fewer than 75 cells on the entire (1 mm2) ruled area and no more than about 48 cells in one of the 25 squares were counted.
Viability: Methylene blue was dissolved in 2 % (w/v) sodium citrate solution to give a final concentration of 0.01% (w/v). Cells were resuspended in methylene blue and a cell count was performed using a haemocytometer. The cell suspension was diluted to a final concentration of 1 x 10⁷ cells per mL and mixed in a 1:1 ratio with citrate methylene blue. The cells were microscopically examined after 5min at 40X magnification. Dead cells stain blue, while the viable ones were colourless, as live cells exclude the stain. Viability counts were performed in triplicate and compared in the presence and absence of inhibitory compounds as appropriate [24].
Determination of OD: The cell numbers or OD600 of yeast strains in the fermentation media was measured by Spectrophotometer (Biowave S2100 diode array) to calculate the actively growing cells and determine the doubling time to draw comparison between control and stressed yeast cells.
Detection of sugars and ethanol from FV experiments via HPLC: Sugars and ethanol were quantified by HPLC. The HPLC system included a Jasco AS-2055 Intelligent auto sampler (Jasco, Tokyo, Japan) and a Jasco PU-1580 Intelligent pump (Jasco). The chromatographic separation was performed on a Rezex ROA H+ organic acid column, 5 μm, 7.8 mm x 300 mm, (Phenomenex, Macclesfield, UK) at ambient temperature. The mobile phase was 0.005N H2SO4 with a flow rate of 0.5 mL/min. For detection a Jasco RI-2031 Intelligent refractive index detector (Jasco) was employed. Data acquisition was via the Azur software (version 4.6.0.0, Datalys, St Martin D’heres, France) and concentrations were determined by peak area comparison with injections of authentic standards. The injected volume was 10 μL and analysis was completed in 28 minutes. All chemicals used were analytical grade (> 95% purity, Sigma-Aldrich, UK).
Results
Isolation and identification of yeast from natural habitats
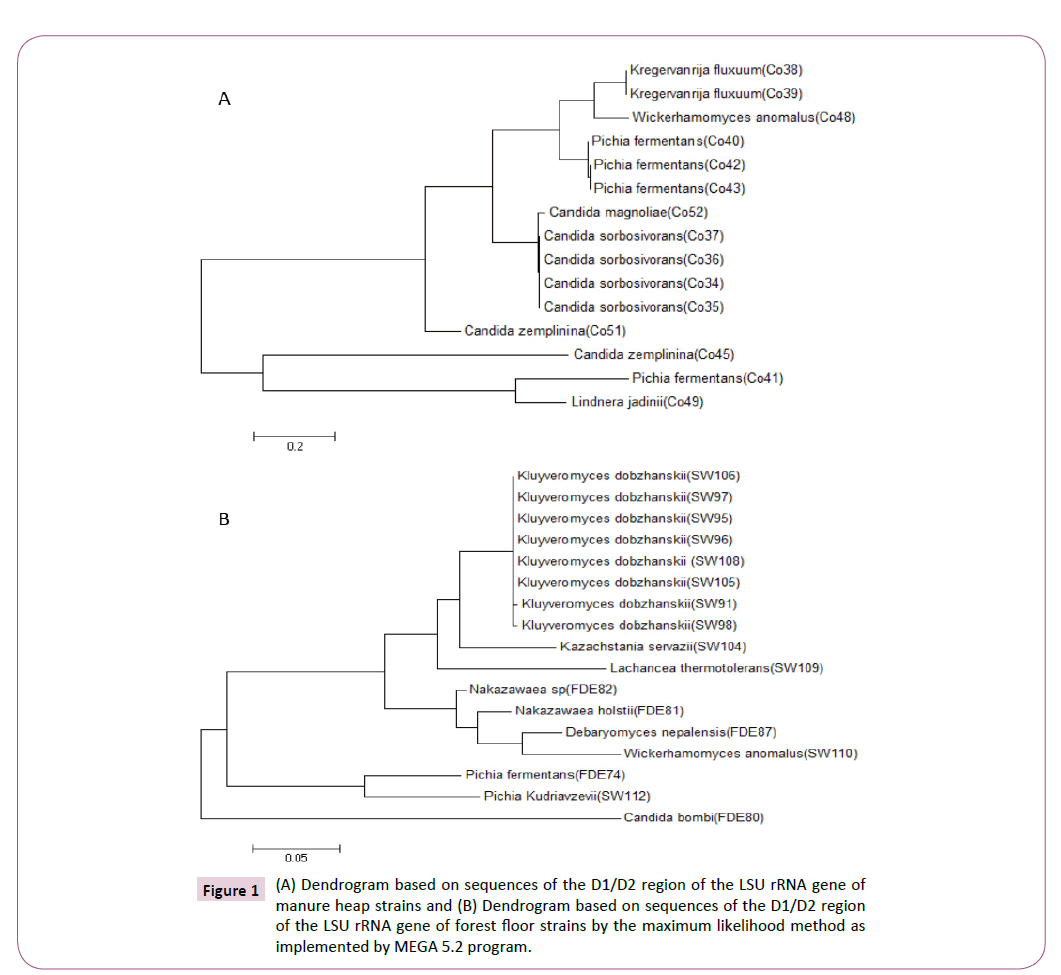
Yeasts were isolated from manure heap and forest floor fermentative ecosystems and assessed for their capacity for utilizing either glucose and/or xylose (data not shown). Sequencing of the internal transcribed spacers (ITS) regions and D1/D2 domain of the large subunit rRNA gene [25] revealed that there were 7 species from 5 genera isolated from manure heaps (Figure 1A) and 10 species from 8 genera isolated from forest floors (Figure 1B). Interestingly, the strains isolated from the two fermentative ecosystems were completely different, indicating how different ecosystems possess a great degree of genetic and phenotypic diversity, of the 32 isolates identified, 23 could produce ethanol (data not shown).
Identifying xylose utilizing yeast strains using a phenotypic microarray
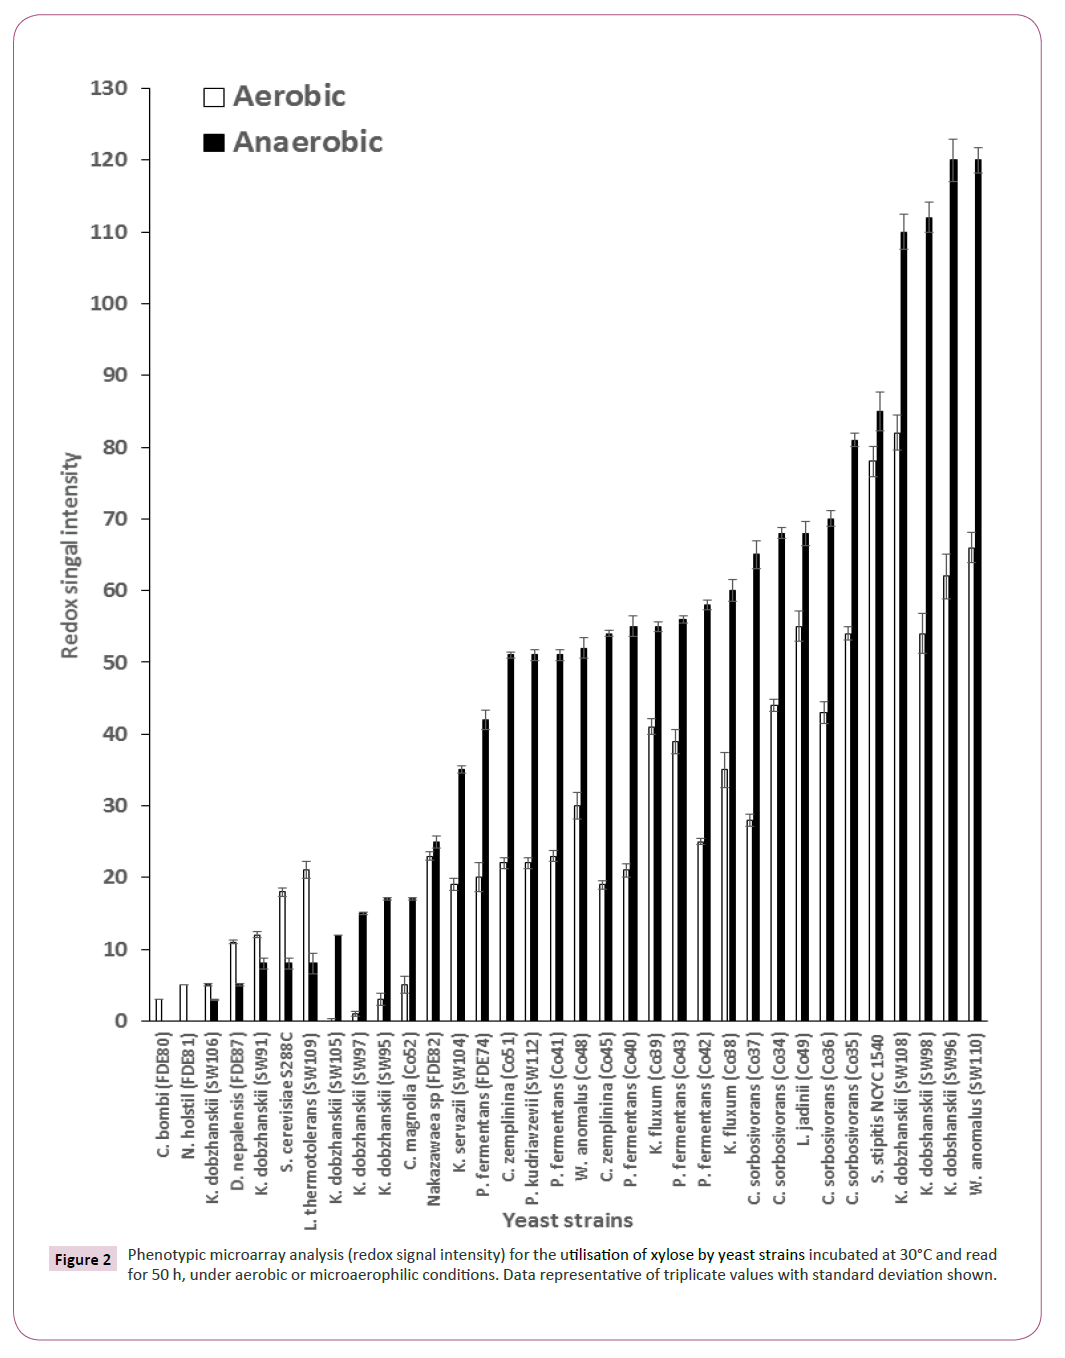
Twenty-five strains (the 23 strains which could produce ethanol and two reference strains (S. cerevisiae S288C and S. stipitis NCYC 1540)) were tested for the utilisation of xylose under aerobic and microaerophilic conditions. In an aerobic environment, Kluyveromyces dobzhanskii (SW96) was identified as the best xylose utiliser whereas under microaerophilic conditions Wickerhamomyces anomalus SW110, Kluyveromyces dobzhanskii SW96 and Kluyveromyces dobzhanskii SW98 were identified as the best xylose utilisers outperforming S. stipitis NCYC1541, a yeast strain which has been shown previously to have xylose utilising capabilities (Figure 2) [22].
Yeasts isolated from natural ecosystems display xylose fermentative capabilities
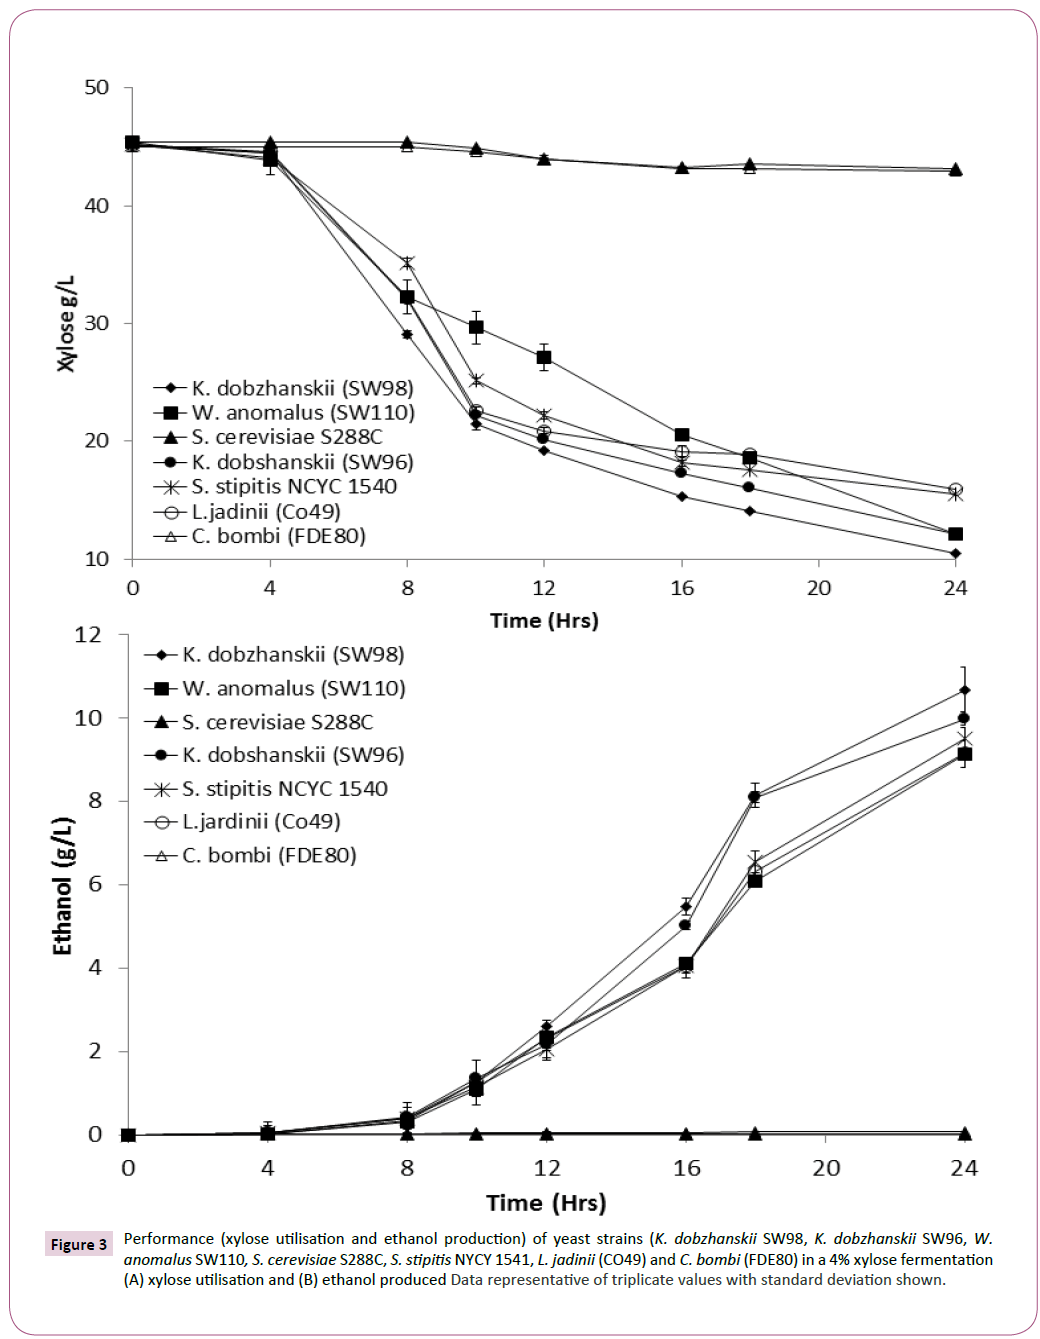
Yeasts isolated with the best xylose utilisation capabilities, along with S. cerevisiae S288C a strain unable to use xylose [26] were assessed for xylose conversion into ethanol production. Results confirmed that S. cerevisiae S288C or Candida bombi (FDE80) did not utilise any xylose or produce any ethanol (Figures 3A and 3B). However, yeast strains identified as xylose utilisers, correlated with excellent xylose utilisation and ethanol production (Figures 3A and 3B). Assessing for conversion of approximately 40 g of xylose into ethanol, it was revealed that K. dobzhanskii SW98, K. dobzhanskii SW96, W. anomalus SW110, and S. stipitis NYCY 1541 and L. jadinii (CO49) produced 11.08 ± 0.2, 11.08 ± 0.3, 10.15 ± 0.29, 10.15 ± 0.3 respectively. Determining ethanol yields on consumed xylose revealed that the yeast with the capacity for utilising xylose produced between 0.25 and 0.36 g/g (Table 1). Fermentations using a mixture of sugars (glucose and xylose ) revealed that all these yeast had a preference for glucose ahead of xylose (data not shown).
Table 1: Fermentation efficiency of conversion of xylose into ethanol (g/g).
| Yeast | Ethanol produced (g/g xylose) |
|---|---|
| Kluyveromyces dobzhanskii (SW98) | 0.320 ± 0.007 |
| Wickerhamomyces anomalus (SW110) | 0.305 ± 0.008 |
| S. cerevisiae S288C | 0.047 ± 0.019 |
| K. dobshanskii (SW96) | 0.334 ± 0.009 |
| S. stipitis NCYC 1541 | 0.334 ± 0.011 |
| Lindnera jadinii (Co49) | 0.362 ± 0.012 |
| Candida bombi (FDE80) | 0.078 ± 0.017 |
Figure 3: Performance (xylose utilisation and ethanol production) of yeast strains (K. dobzhanskii SW98, K. dobzhanskii SW96, W. anomalus SW110, S. cerevisiae S288C, S. stipitis NYCY 1541, L. jadinii (CO49) and C. bombi (FDE80) in a 4% xylose fermentation (A) xylose utilisation and (B) ethanol produced Data representative of triplicate values with standard deviation shown.
Identifying inhibitor tolerant yeast strains present in natural ecosystems
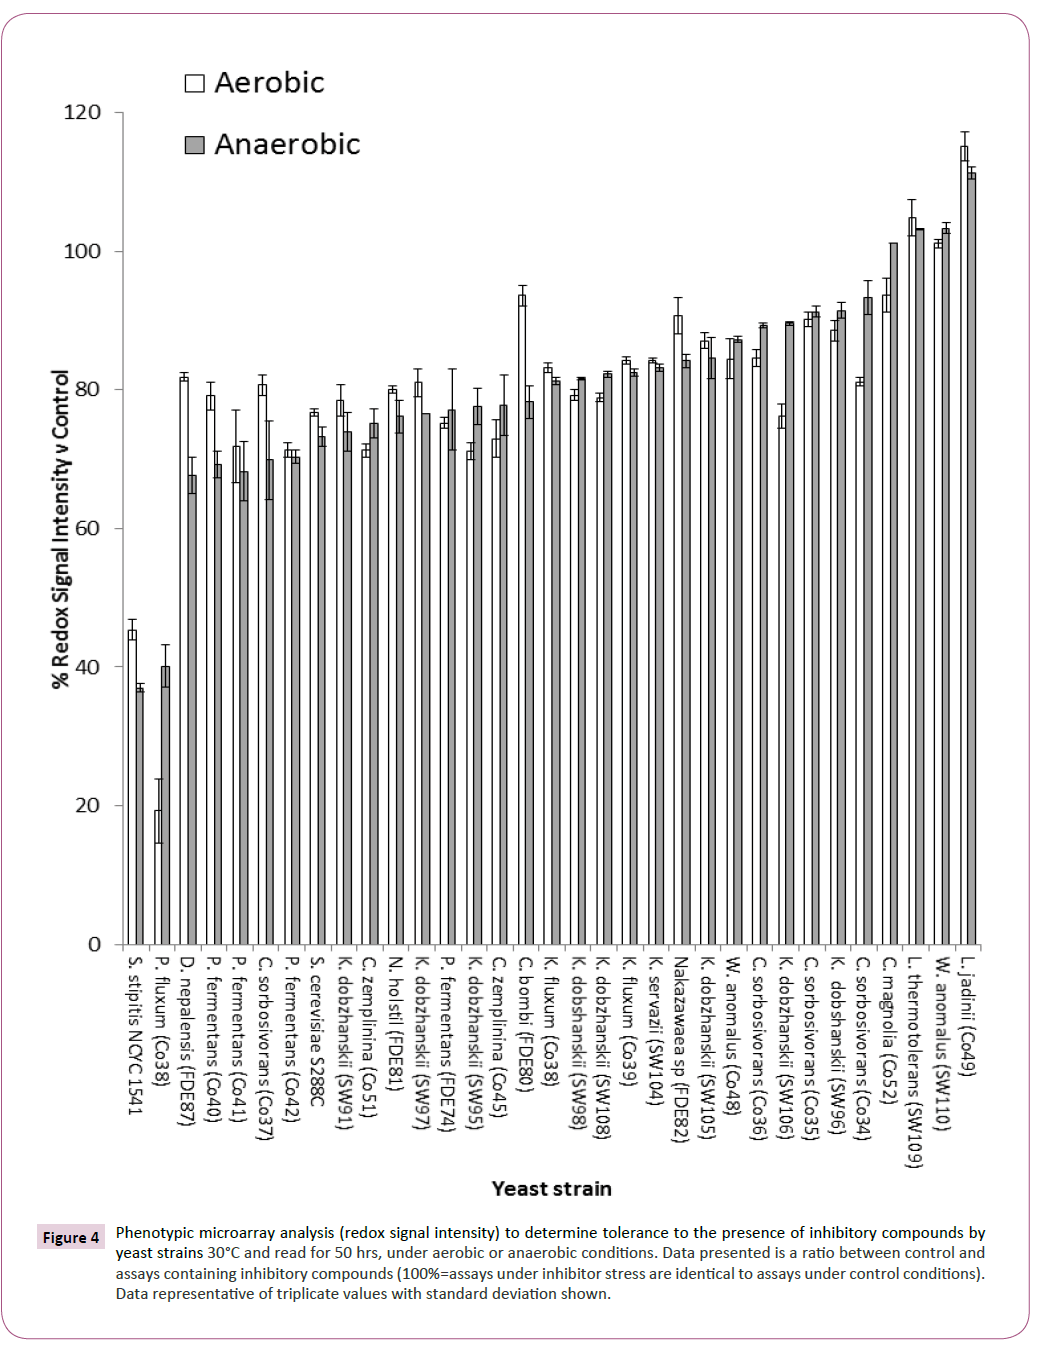
Alongside pentose utilisation, a screen for the tolerance of these yeasts to the presence of inhibitory compounds was undertaken and the data were presented as a percentage of inhibition in the presence of inhibitory compounds when compared with control conditions. Percentage of inhibition was determined by comparing redox signal intensity after 24 hours from control and in the presence of inhibitory compound and the effect of the inhibitors calculated against control conditions. Assays revealed that Candida magnolia (CO52), W. anomalus (SW110), Lachancea thermotolerans (SW109) and Lindnera jadinii (CO49) were tolerant against stress imposed by the presence of a mixture of inhibitory compounds when compared with S. cerevisiae S288C and S. stipitis NCYC 1541 (Figure 4).
Figure 4: Phenotypic microarray analysis (redox signal intensity) to determine tolerance to the presence of inhibitory compounds by yeast strains 30°C and read for 50 hrs, under aerobic or anaerobic conditions. Data presented is a ratio between control and assays containing inhibitory compounds (100%=assays under inhibitor stress are identical to assays under control conditions). Data representative of triplicate values with standard deviation shown.
S. cerevisiae S288C has previously been identified as sensitive to the presence of inhibitory compounds (Wimalasena, et al. 2014) and S. stipitis has been shown to be sensitive to the presence of weak acids when compared with S. cerevisiae strains [22]. In this study, it was observed that L. jadinii was the most tolerant to the presence of inhibitory compounds when compared with control conditions (Figure 4). Redox signal intensities of over 100% was observed indicating that the presence of the inhibitory compounds promoted yeast respiration above that observed under control conditions, this effect has been observed previously [19] but the exact rationale for this phenomenon is not understood.
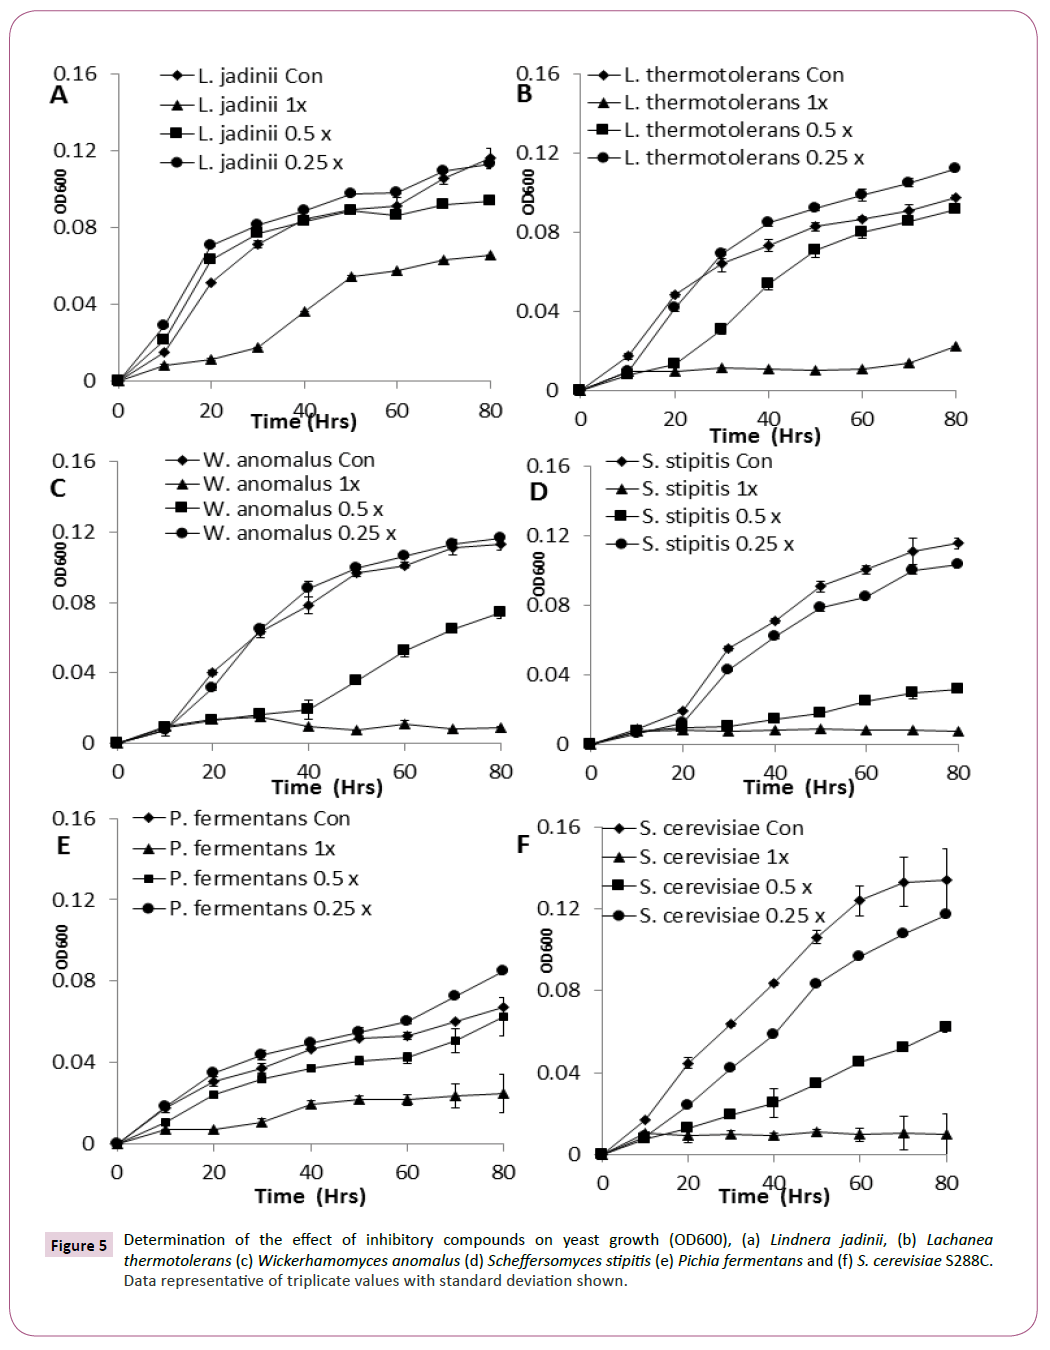
Conversion of metabolic output into growth was also reduced by the presence of inhibitory compounds [22] L. jadinii, L. thermotolerans, W. anomalus, and Pichia. fermentans all displayed excellent growth when compared with other yeast strains in this study (Figures 5A-5F). L. jadinii displayed the best growth under 1 x inhibitory stress when compared with the other strains assayed in this study and was observed as the most tolerant strain against inhibitor stress (Figure 5A), confirming the findings from the phenotypic microarray analysis.
Figure 5: Determination of the effect of inhibitory compounds on yeast growth (OD600), (a) Lindnera jadinii, (b) Lachanea thermotolerans (c) Wickerhamomyces anomalus (d) Scheffersomyces stipitis (e) Pichia fermentans and (f) S. cerevisiae S288C. Data representative of triplicate values with standard deviation shown.
Phenotypic variation was observed between sampling points
The phenotypic variation between the two ecosystems was explored and data analysed focusing principally on response under micro-aerophilic conditions. Statistical analysis revealed that there was a significant difference in xylose utilization between the two ecosystems with yeast isolated from forest fall being significantly better at utilizing xylose than those isolated from a manure heap (Figure 6A and 6B) P>0.0001. There were no significant differences between response to inhibitory compounds between the two populations of yeast (P>0.012) (Figure 6C and 6D). Strains of Pichia fermentans were isolated from each ecosystem, PCA analysis revealed that P. fermentans FDE74 clustered separately from the three P. fermentans strains isolated from a manure heap (Figure 6E).
L. jadinii converted available sugars to ethanol in a fermentation in the presence of inhibitory compounds
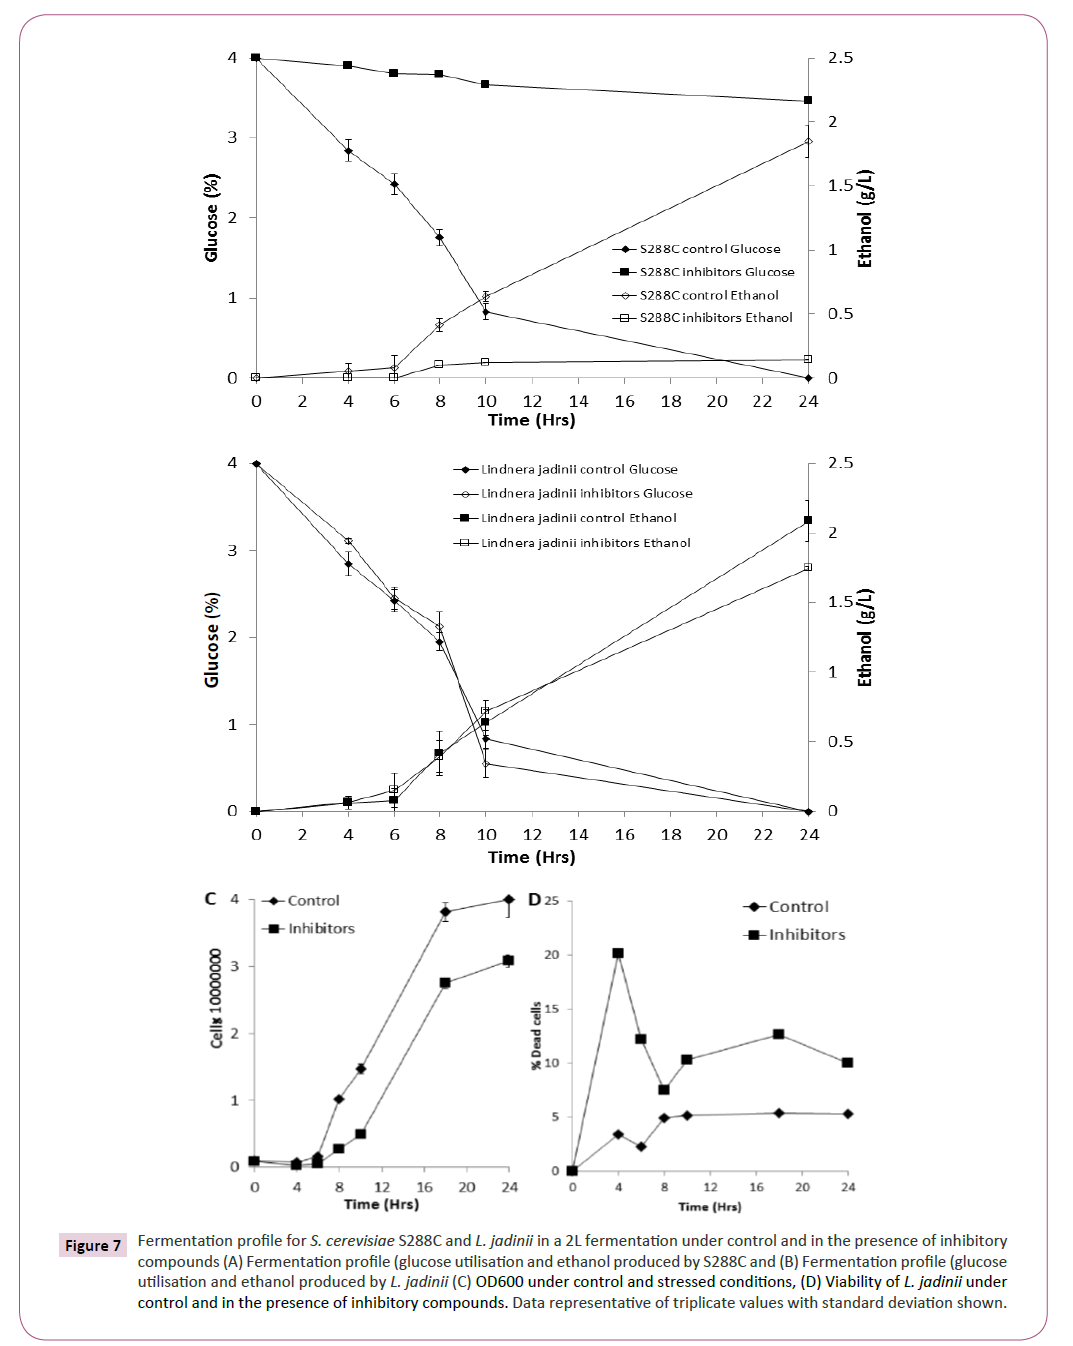
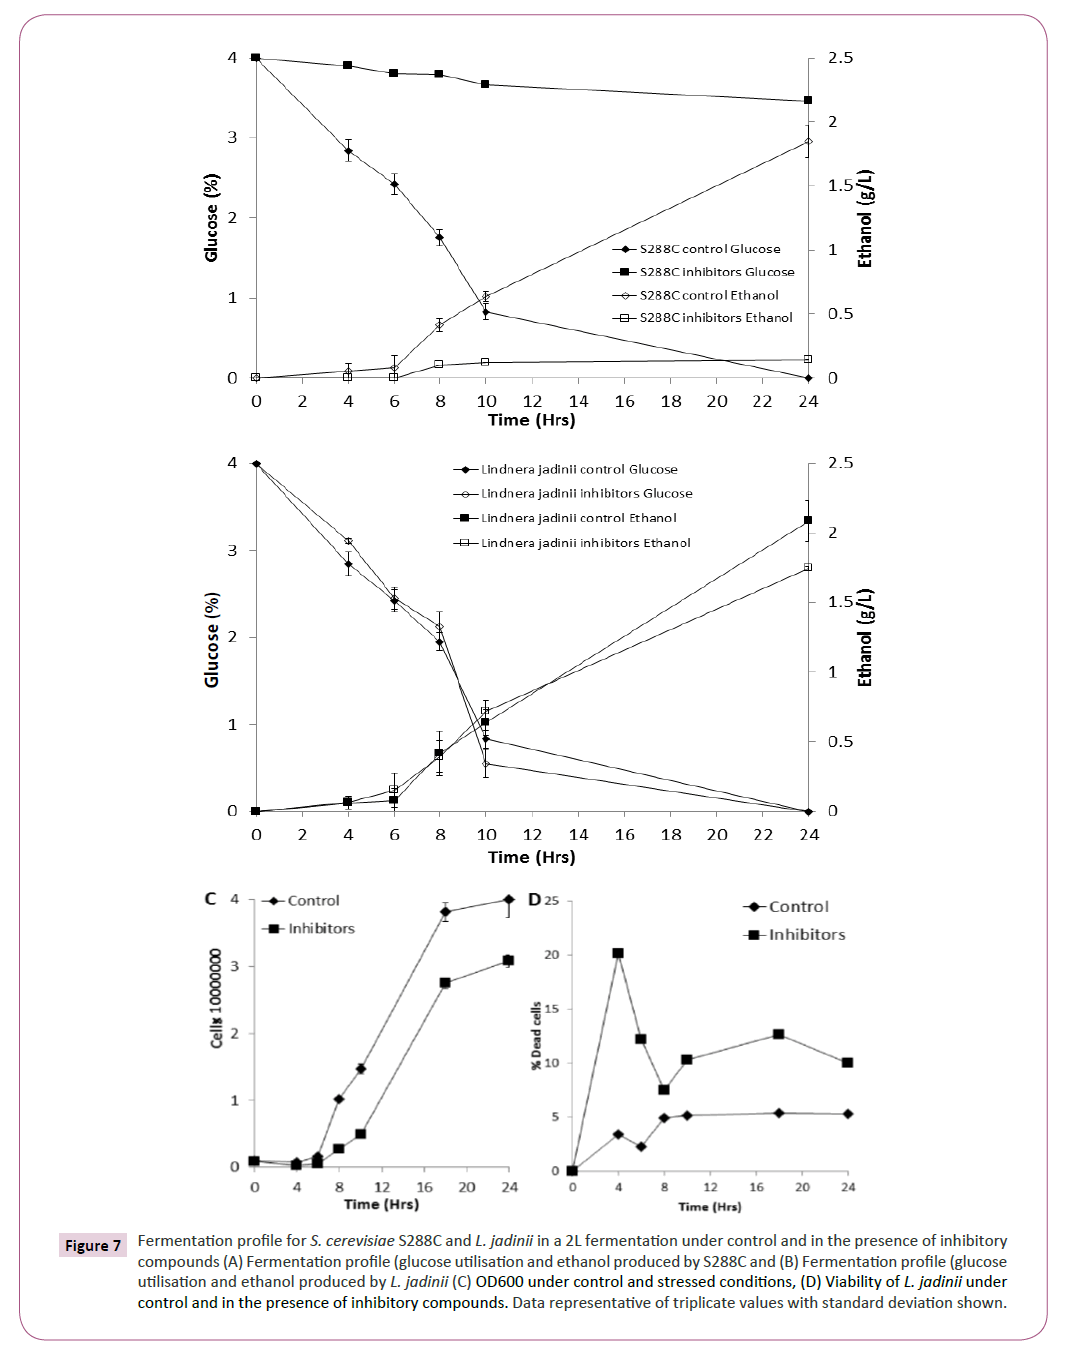
Based on the phenotypic microarray results for xylose utilisation (Figure 2) and inhibitor tolerance (Figure 4), L. jadinii was further studied in a bioreactor (2L) under control and stress conditions. We observed that L. jadinii fermentation in the presence of inhibitory compounds was not significantly delayed by the presence of inhibitory compounds compared with control conditions (Figure 7B). Fermentations with S288C in the presence of inhibitory compounds was characterized by virtually no glucose utilization or ethanol production (Figure 7A). Determining yeast growth revealed that there was a longer exit from lag phase in the presence of inhibitory compounds for L. jadinii when compared with control conditions (Figure 7C) Assessment of viability for L. jadinii during fermentation revealed that there was an initial increase in non-viable cells in the presence of inhibitory compounds when compared with controls (Figure 7C). L. jadinii achieved a maxima conversion of 0.41 g/g under control conditions and 0.46 g/g under inhibitory stress.
Figure 7: Fermentation profile for S. cerevisiae S288C and L. jadinii in a 2L fermentation under control and in the presence of inhibitory compounds (A) Fermentation profile (glucose utilisation and ethanol produced by S288C and (B) Fermentation profile (glucose utilisation and ethanol produced by L. jadinii (C) OD600 under control and stressed conditions, (D) Viability of L. jadinii under control and in the presence of inhibitory compounds. Data representative of triplicate values with standard deviation shown.
Discussion and Conclusion
The environmental and economic concerns over many decades have focused on renewable sources to replace the dependency on fossil fuels. Abundant lignocellulose biomass conversion to biofuels has potential for reducing greenhouse gas emissions and improving energy security. A pre-treatment step is important to make cellulose accessible for further conversion [27], cellulosic ethanol and green ethanol from numerous biomass resources reduces greenhouse gas emissions by 86% [28]. Lignocellulosic biomass including agricultural and forest floors residues could be an ideal source for fermentation substrates for employment in transportation fuels. The structure of cellulose and presence of lignin and hemicellulose render LCM resistant to hydrolysis, making pre-treatment necessary to increase susceptibility of lignocellulose biomass to hydrolysis and further fermentation process [29]. Therefore pre-treatment is important for biofuel production and efficient manipulation of this step ensures better yields of bioethanol.
During pre-treatment and hydrolysis, by-products are formed that are inhibitory for most microorganisms, these inhibitors slow down or even stop fermentation [19]. The level of inhibitors present in a particular hydrolysate depends on the source of the raw material and the hydrolysis and pre-treatment method used [30]. Research has been carried out to identify inhibitor tolerant strains, however, most of these strains could only tolerate individual inhibitory compounds and there is need for strains that can tolerate a combination of inhibitors. Studying the interactive effects of inhibitors helps the development of more tolerant strains for fermentation of lignocellulosic hydrolysates.
Isolating strains from natural and industrial habitats is a suitable technique for searching novel strains with specific properties [31]. The wine industry has an increasing demand for new yeast strains that resulted into development of yeast improvement programs [32]. Exploiting the genetic diversity of natural ecosystems could lead to the generation of novel yeast strains with desirable phenotypes for improved bioethanol production. Identifying yeast with innate fermentation capabilities could potentially identify genes that could confer resistance to the chemical constituents of lignocellulosic biomass. Previous studies have indicated that wild yeasts respond in a different manner to ethanol when compared to laboratory strains [33].
Wild yeast isolates from an agricultural manure heap and forest floors were isolated and identified using molecular microbiological techniques. Some of the species identified in this paper have been described previously to co-participate in natural fruit fermentations along with S. cerevisiae [34]. Here we identified efficient inhibitor tolerant strains and ethanol producers, which have the potential to be used in the second generation biofuel industry. Our data demonstrate that natural fermentative ecosystems can be utilized to help develop strategies for industry and sustainable future. Several isolates such as Candida sorbosivorans, Pichia fermentans, Candida zemplinina, Wickerhamomyces anomalus and Lindnera jadinii are ethanol producers from both glucose and xylose, making them candidates for future analysis and manipulation.
These findings confirm that natural fermentative ecosystems are excellent sources of industrially relevant microbes which can be used for the conversion of agricultural or waste residues into value added chemicals.
Funding
The research reported here was supported (in full or in part) by the Biotechnology and Biological Sciences Research Council (BBSRC) Sustainable Bioenergy Centre (BSBEC), under the programme for ‘Lignocellulosic Conversion to Ethanol’ (LACE) [grant ref. BB/G01616X/1].
Ethical Approval and Consent to participate - NA
Consent for publication - All authors have given consent for publication
Availability of supporting data – All supporting data is available
Competing Interests
The authors declare that they have no competing interests
Authors' contributions -
ASF and MM–performed the experiments, made contributions to experimental design, helped write the manuscript and has given final approval for this manuscript.
EJL and CD–designed the experiments and wrote the manuscript and have given final approval for this manuscript.
DG–designed the experiments, performed the experiments, wrote the manuscript and has given final approval for this manuscript. All authors have read and approved the final manuscript.
References
- Meng X, Yang J, Xu X, Zhang L, Nie Q, et al. (2009) Biodiesel production from oleaginous microorganisms. Renewable energy 34: 1-5.
- Pensupa N, Jin M, Kokolski M, Archer DB, Du C (2013) A solid state fungal fermentation-based strategy for the hydrolysis of wheat straw. Bioresource Technol 149: 261-267.
- Taha M, Foda M, Shahsavan E, Aburto-Medina A, Adetutu E, et al. (2016) Commercial feasibility of lignocellulose biodegradation: possibilities and challenges. Curr Opin Biotechnol 38: 190-197.
- Antoni D, Zverlov VV, Schwarz WH (2007) Biofuels from microbes. Appl Microbiol Biotechnol 77: 23-35.
- Schubert C (2006) Can biofuels finally take center stage? Nat Biotechnol 24: 777-784.
- Weber C, Farwick A, Benisch F, Brat D, Dietz H, et al. (2010) Trends and challenges in the microbial production of lignocellulosic bioalcohol fuels. Appl Microbiol Biotechnol 87: 1303-1315.
- Lin Y, Tanaka S (2006) Ethanol fermentation from biomass resources: current state and prospects. Appl Microbiol Biotechnol 69: 627-642.
- Jeffries TW (2006) Engineering yeasts for xylose metabolism. Curr Opin Biotechnol 17: 320-326.
- Jeffries TW, Jin YS (2004) Metabolic engineering for improved fermentation of pentoses by yeasts. Appl Microbiol Biotechnol 63: 495-509.
- Harhangi HR, Akhmanova AS, Emmens R, van der Drift C, de Laat WT, et al. (2003) Xylose metabolism in the anaerobic fungus Piromyces sp. strain E2 follows the bacterial pathway. Arch Microbiol 180: 134-141.
- Hou J, Shen Y, Jiao C, Ge R, Zhang X, et al. (2016) Characterization and evolution of xylose isomerase screened from the bovine rumen metagenome in Saccharomyces cerevisiae. J Biosci Bioeng 121: 160-165.
- Hasunuma T, Sanda T, Yamada R, Yoshimura K, Ishii J, et al. (2011) Metabolic pathway engineering based on metabolomics confers acetic and formic acid tolerance to a recombinant xylose-fermenting strain of Saccharomyces cerevisiae. Microb Cell Fact 10: 2.
- Taherzadeh MJ, Karimi K (2008) Pretreatment of lignocellulosic wastes to improve ethanol and biogas production: a review. Int J Mol Sci 9: 1621-1651.
- Westman J, Taherzadeh MJ, Franzen CJ (2012) Inhibitor tolerance and flocculation of a yeast strain suitable for second generation bioethanol production. Electronic J of Biotechnol 15.
- Cheng H, Edwards RL, Broecker WS, Denton GH, Kong X, et al. (2009) Ice age terminations. Science 326: 248-252.
- Martiniano SE, Chandel AK, Soares LC, Pagnoccca FC, da Silva SS (2013) Evaluation of novel xylose-fermenting yeast strains from Brazilian forests for hemicellulosic ethanol production from sugarcane bagasse. 3Biotech 3: 345-352.
- Camarasa C, Sanchez I, Brial P, Bigey F, Deguin S (2011) Phenotypic landscape of Saccharomyces cerevisiae during wine fermentation: evidence for origin-dependent metabolic traits. PLoS One 6: e25147.
- López-Moreno A, Lappe P, Le Borgne S (2010) Study of fermentation inhibitors tolerance of yeasts isolated from mexican ecosystems Interdisciplinaria de Biotecnología.
- Wimalasena TT, Greetham D, Marvin ME, Liti G, Chandelia Y, et al. (2014) Phenotypic characterisation of Saccharomyces spp yeast for tolerance to stresses encountered during fermentation of lignocellulosic residues to produce bioethanol. Microb Cell Fact 13: 47.
- Belloch C, Orlic S, Barrio E, Querol A (2008) Fermentative stress adaptation of hybrids within the Saccharomyces sensu stricto complex. Int J Food Microbiol 122: 188-195.
- Arroyo-Lopez FN, Salvado Z, Tronchoni J, Guillamon JM, Barrio E, et al. (2010) Susceptibility and resistance to ethanol in Saccharomyces strains isolated from wild and fermentative environments. Yeast 27: 1005-1015.
- Greetham D, Wimalasena T, Kerruish DW, Brindley S, Ibbett RN, et al. (2014) Development of a phenotypic assay for characterisation of ethanologenic yeast strain sensitivity to inhibitors released from lignocellulosic feedstocks. J Ind Microbiol Biotechnol 41: 931-945.
- Tomas-Pejo E, Oliva JM, Ballesteros M, Olsson L (2008) Comparison of SHF and SSF processes from steam-exploded wheat straw for ethanol production by xylose-fermenting and robust glucose-fermenting Saccharomyces cerevisiae strains. Biotechnol Bioeng 100: 1122-1131.
- Sami M, Ikeda M, Yabuuchi S (1994) Evaluation of the alkaline methylene blue staining method for yeast activity determination. J Ferment Bioeng 78: 212-216.
- Horton TR, Bruns TD (2001) The molecular revolution in ectomycorrhizal ecology: peeking into the black-box. Mol Ecol 10: 1855-1871.
- Wenger JW, Schwartz K, Sherlock G (2010) Bulk segregant analysis by high-throughput sequencing reveals a novel xylose utilization gene from Saccharomyces cerevisiae. PLoS Genet 6: e1000942.30. Ferreira AD, Mussatto SI, Cadete RM, Rosa CA, Silva SS (2011) Ethanol production by a new pentose-fermenting yeast strain, Scheffersomyces stipitis UFMG-IMH 43.2 isolated from the Brazilian forest. Yeast 28: 547-554.
- Wyman C (1999) Biomass ethanol: technocal progress, opportunities and commercial challenges. Annu Rev Energy EnViron 24: 189-226.
- Wu M, Wang M, Liu J, Huo H (2008) Assessment of potential life-cycle energy and greenhouse gas emission effects from using corn-based butanol as a transportation fuel. Biotechnol Prog 24: 1204-1214.
- Kumar P, Barrett DM, Delwiche MJ, Stroeve P (2009) Methods for Pretreatment of Lignocellulosic Biomass for Efficient Hydrolysis and Biofuel Production. Ind Eng Chem Res 48: 3713-3729.
- Klinke HB, Thomsen AB, Ahring BK (2004) Inhibition of ethanol-producing yeast and bacteria by degradation products produced during pre-treatment of biomass. Appl Microbiol Biotechnol 66: 10-26.
- Ferreira AD, Mussatto SI, Cadete RM, Rosa CA, Silva SS (2011) Ethanol production by a new pentose-fermenting yeast strain, Scheffersomyces stipitis UFMG-IMH 43.2 isolated from the Brazilian forest. Yeast 28: 547-554.
- Vestrepen K, Chambers P, Pretorius I (2006) The development of superior yeast strains for the food and beverage industries: challenges, opportunities and potential benefits.
- Lewis JA, Elkon IM, McGee MA, Higbee AJ, Gasch AP (2010) Exploiting natural variation in Saccharomyces cerevisiae to identify genes for increased ethanol resistance. Genetics 186: 1197-1205.
- Li Z, Vizeacoumar FJ, Bahr S, Li J, Warringer J, et al. (2011) Systematic exploration of essential yeast gene function with temperature-sensitive mutants. Nat Biotechnol 29: 361-367.
Open Access Journals
- Aquaculture & Veterinary Science
- Chemistry & Chemical Sciences
- Clinical Sciences
- Engineering
- General Science
- Genetics & Molecular Biology
- Health Care & Nursing
- Immunology & Microbiology
- Materials Science
- Mathematics & Physics
- Medical Sciences
- Neurology & Psychiatry
- Oncology & Cancer Science
- Pharmaceutical Sciences
