ISSN : 0976 - 8688
Der Pharmacia Sinica
Estimation of Sofosbuvir with Validated Ultra High Performance Liquid Chromatographic (UHPLC) Method in its bulk and Formulations
Shaik John Saida1,2, Muniappan M1, Manikanta Kumar A1, Muralidaran Kaliyaperumal1, Ramulu Y2 and S Venkat Rao2*
1Bharath University, Selaiyur, Chennai, Tamil Nadu, 600073, India
Abstract
In this work, a stability indicating and validated UPLC method has been developed for estimation of Sofosbuvir (API) in bulk and its formulations (Sovaldi®). The chromatographic separation was achieved on a Waters BEH C18 column (2.1 × 100 mm, 1.7 μm) in an isocratic elution mode with flow rate 0.4 mL/min, the mobile phase of Acetonitrile and Water (30:70) in 0.1% formic acid (pH ~2-3). The optimized method is linear over the concentration range of 20-120 ppm; the Limit of Quantification (LOQ) and Limit of detection are 0.063 and 0.03 μg/mL respectively.
Keywords
Sofosbuvir, Method development, Validation, Precision, Linearity, Regular pharmaceutical analysis add UPLC
Research Background
In pharmaceutical industry the product (Active pharmaceutical ingredient) development research involves several phases like feasibility, design of experiments or optimization, Reproducibility of the process with freezed process, scale up and process validation. To achieve this process the synthetic research and development should keep more than 300-500 experiments as a part of process development. It indicates that approximately 150 experiments need to test in-process analysis and 300 experiments intermediate analysis. Over all 1000-1500 samples can be done its analysis and for this testing on an average 150 g directly or indirectly it is consuming for analysis with other available methods.
The expensive products like Sofosbuvir, it is highly difficult to provide such huge material for analysis because the raw materials of SBR it’s self very costly. Therefore the author decided to develop robust and sensitive method for testing Sofosbuvir (API) rather than other available analysis techniques.
If aiming to reduce the pharmaceutical daily or regular analysis cost of the corresponding drug substance or an intermediate. The first and fore most things are to reduce the sample consumption quantity for its analysis and which is reciprocating the cost of the targeted drug substance or intermediate. Keeping this view in mind the author developed a validated and sensitive method for analysis of Sofosbuvir.
Introduction
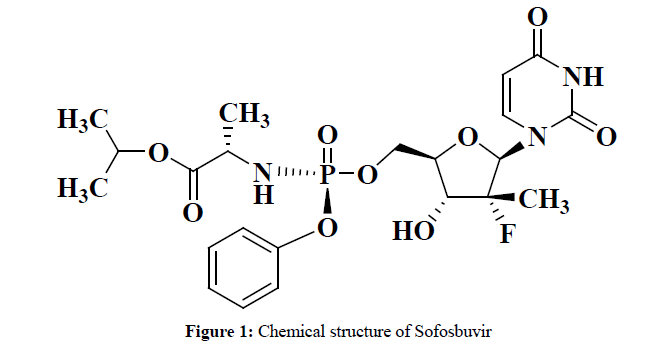
The chemical name of Sofosbuvir is Isopropyl (2S)-2-[[[(2R,3R,4R,5R)-5-(2,4-dioxopyrimidin-1-yl)-4-fluoro-3- hydroxy-4-methyl-tetrahydrofuran-2-yl]methoxy-phenoxy-phos-phoryl]amino] propionate, its chemical structure (Figure 1) and this drug substance basically constructed with phosphor di-ester linkage of a sugar moiety, which is interconnecting with nucleic base and α-amino acid.
An infection caused by virus which influences on Liver function [1] and experience the Inflammation in Liver and the virus is known as Hepatitis C (HCV). It can say there is no vaccine [2,3] for Hepatitis C for prevention of this disease.
This chronic infection can be cured more than 90% by medications Sofosbuvir or Simiprevir [4].
After reveals all the available related literature from the research data base and reputed journals, it is understand that no one has reported simple UPLC validated method for its regular analysis of Sofosbuvir. Most of the literatures available on RP-HPLC [5] and UPLC-MS/MS [6] plasma studies which are almost related to bioequivalence studies and few of are available on combination of drugs analysis or simultaneous estimations by HPLC. But no one reported Sofosbuvir API analysis in bulk and its formulations. Hence, the author attempts to develop a sensitive method with UPLC technique. The main reason to take up this research on UPLC is here in analysis the sample, solvent and time consumption is very less compare to HPLC or other conventional methods [7].
Materials and Methods
Sofosbuvir (API) sample was gifted and its formulation Sovaldi 400 mg was purchased from Anupama medical house, Hyderabad. The other materials like Formic acid, Acetonitrile, HPLC grade were purchased from Sigma-Aldrich. The instrumentation used for this research is Milli-Q Water, Milli-pore filtration membrane with 0.25 μ, Waters Acquity UHPLC coupled with PDA detector and Acquity BEH C18 column, (2.1 × 50 mm, 1.7 μ).
Chromatographic conditions
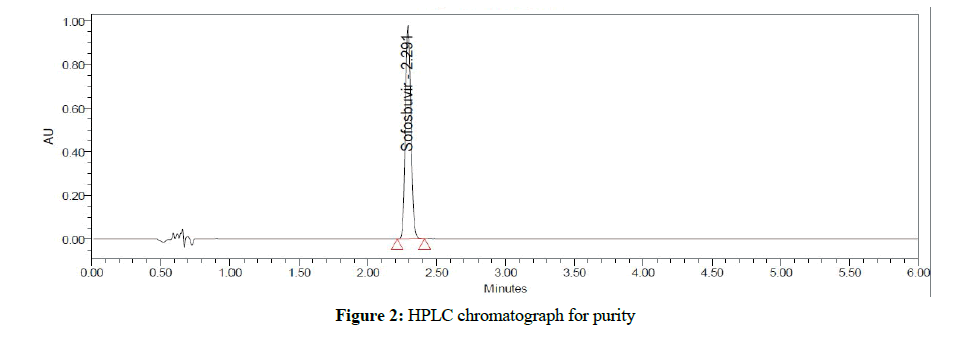
Chromatographic analysis was performed on Waters Acquity UHPLC coupled with PDA detector Chromatographic separation was performed on an Acquity UPLC BEH C18 column (2.1 × 50 mm), 1.7 μ; maintained column temp at 50°C and the compounds elution was obtained through a Isocratic method, mobile phases A (0.1% of formic acid in water, pH at 2.3 and B (ACN) at flow rate of 0.4 mL/min and a time run of 6 min (Figure 2). Auto-sampler was settled at 10°C and the Data processing and system control was managed with the waters Empower 3 data software [8-10].
Preparation of standard solution
20 mg of Sofosbuvir pure sample was weighed accurately and transferred into 100 mL clean and dry volumetric flask, and then added 50 mL of diluent. The solution was sonicated for 20 min and made up to the final volume with diluent. From the above stock solution, 1 mL was pipetted out in to a 10 ml clean dry Volumetric flask and then made up to the final volume with Diluent [11].
Preparation of sample solution
60 mg sample of Sofosbuvir (equivalent weight of Sovaldi) was weighed accurately and transferred into a 100 mL volumetric flask, 50 mL of diluents was added, sonicated for 45 min, and made up to the final volume with diluents and filtered. From the filtered solution 1 ml was pipetted out into a 10 ml clean dry volumetric flask and made up the volume up to 10 mL with diluents. Similar preparations were followed to achieve desired concentrations to perform for the validation of Sofosbuvir [12].
Results and Discussion
System suitability
Chromatographic condition was achieved after several trials, retention time, and response area. Theoretical plate count and tailing factor were found within the acceptable range when the results were analyzed in terms of standard deviation and percentage of relative standard deviation (Table 1).
| Sample Name | Retention Time (min) | Area | USP Plate Count | Tailing Factor |
|---|---|---|---|---|
| Safosbuvir-1 | 2.291 | 2723448 | 14931 | 1.1 |
| Safosbuvir-2 | 2.296 | 2720240 | 14995 | 1.1 |
| Safosbuvir-3 | 2.311 | 2726579 | 14923 | 1.09 |
| Safosbuvir-4 | 2.321 | 2725110 | 14893 | 1.1 |
| Safosbuvir-5 | 2.313 | 2724778 | 15001 | 1.1 |
| Safosbuvir-6 | 2.31 | 2728944 | 14986 | 1.1 |
| Mean | 2.307 | 2724850 | 14955 | 1.098 |
| SD | 0.01977 | 2933.965 | 44.99 | 0.00237 |
| %RSD | 0.85696 | 0.10767 | 0.3008 | 0.2158 |
Table 1: System suitability
Precision
The precision of an analytical procedure expresses the closeness of agreement (degree of scatter) between a series of measurements obtained from multiple sampling of the same homogeneous sample under the prescribed conditions [13-15]. Precision may be considered at three levels: Repeatability, intermediate precision and reproducibility. Precision should be investigated using homogeneous, authentic samples. However, if it is not possible to obtain a homogeneous sample it may be investigated using artificially prepared samples or a sample solution. The precision of an analytical procedure is usually expressed as the variance, standard deviation or coefficient of variation of a series of measurements.
Repeatability
Repeatability expresses the precision under the same operating conditions over a short interval of time. Repeatability is also termed intra-assay precision (Table 2).
| No. of Injection | Retention time | Peak Area |
|---|---|---|
| 1 | 2.266 | 2723448 |
| 2 | 2.296 | 2720240 |
| 3 | 2.311 | 2726579 |
| 4 | 2.321 | 2725110 |
| 5 | 2.313 | 2724778 |
| 6 | 2.310 | 2728944 |
| Mean | 2.302833333 | 2724849.833 |
| SD | 0.019772877 | 2933.9654 |
| %RSD | 0.859 | 0.108 |
Table 2: Intra-day precision (Set-1)
Intermediate precision
Intermediate precision expresses within-laboratories variations: different days, different analysts, different equipment, etc. (Table 3).
| No. of Injection | Retention time | Peak Area |
|---|---|---|
| 1 | 2.292 | 2758576 |
| 2 | 2.291 | 2753316 |
| 3 | 2.314 | 2756003 |
| 4 | 2.302 | 2755915 |
| 5 | 2.271 | 2759908 |
| 6 | 2.250 | 2773146 |
| Mean | 2.286666667 | 2759477.333 |
| SD | 0.022888134 | 7078.892051 |
| %RSD | 1.001 | 0.257 |
Table 3: Inter-day precision (Set-2)
Reproducibility
Reproducibility expresses the precision between laboratories (collaborative studies, usually applied to standardization of methodology).
Accuracy
The accuracy of an analytical procedure expresses the closeness of agreement between the value which is accepted either as a conventional true value or an accepted reference value and the value found. This is sometimes termed trueness (Table 4).
| S. No. | Recovery at 80% | Recovery at 100% | Recovery at 120% | |||
|---|---|---|---|---|---|---|
| Standard | Sample | Standard | Sample | Standard | Sample | |
| 1 | 2134824 | 2148847 | 2713454 | 2711378 | 3223549 | 3226448 |
| 2 | 2140950 | 2148818 | 2728957 | 2713903 | 3223482 | 3223680 |
| 3 | 2139365 | 2149655 | 2749142 | 2711406 | 3229585 | 3224994 |
| Mean | 2138379.667 | 2149106.667 | 2730517.67 | 2712229 | 3225538.67 | 3225040.667 |
| S.D | 3179.643114 | 475.0919209 | 17895.1138 | 1449.79412 | 3504.38758 | 1384.589951 |
| %RSD | 0.14869404 | 0.022106484 | 0.6553744 | 0.05345397 | 0.10864503 | 0.04293248 |
| % of Recovery | 100.23 | 99.02 | 99.71 | |||
| Average % Recovery | 99.65 | |||||
Table 4: Accuracy and recovery studies
Linearity
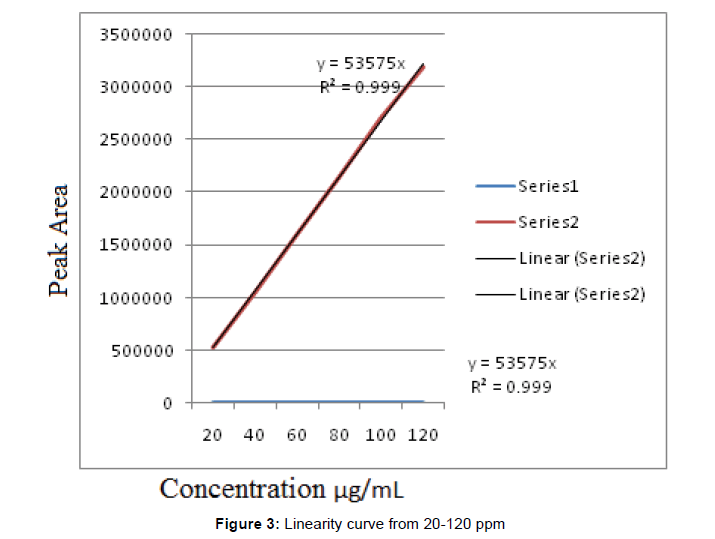
The linearity of an analytical procedure is its ability (within a given range) to obtain test results which are directly proportional to the concentration (amount) of analyte in the sample (Figure 3 and Table 5).
| Concentration of Drug μg/mL | Retention time (min) | Peak Area |
|---|---|---|
| 20 | 2.260 | 534406 |
| 40 | 2.259 | 1060515 |
| 60 | 2.239 | 1608791 |
| 80 | 2.236 | 2142065 |
| 100 | 2.238 | 2711184 |
| 120 | 2.236 | 3191349 |
Table 5: Linearity from 20-120 ppm
Detection Limit (LOD)
The detection limit of an individual analytical procedure is the lowest amount of analyte in a sample which can be detected but not necessarily quantitated as an exact value.
Quantification Limit (LOQ)
The quantitation limit of an individual analytical procedure is the lowest amount of analyte in a sample which can be quantitatively determined with suitable precision and accuracy [16,17]. The quantitation limit is a parameter of quantitative assays for low levels of compounds in sample matrices, and is used particularly for the determination of impurities and/or degradation products.
Robustness
The robustness of an analytical procedure is a measure of its capacity to remain unaffected by small, but deliberate variations in method parameters and provides an indication of its reliability during normal usage.
Conclusion
The validated method, developed for Sofosbuvir API as per ICH guidelines [18] protocol is reproducible and economic way of approach to analyze the drug in house usage for regular complies part. The obtained values of LOD, LOQ levels and Regression co-efficient (0.999) were concluded as the process developed is robust, sensitive and economically viable to analyze Sofosbuvir (API) in bulk and its formulations.
Acknowledgement
We are very thankful to Bharath University for giving this opportunity and our extended gratitude’s to Dr. M. Muniyappan, Dr. A. Manikanta Kumar, Dr. Muralidaran Kaliyaperumal and Dr. S. Venkat Rao for their continuous support to this entire research.
References
- Ryan, KJ., Ray, CG., McGraw Hill, USA, 2004. p. 551-552.
- Hepatitis, C., CDC, 2016.
- Daniel, P., et al. The Lancet, 2015. 385(9973): p. 1124-1135.
- https://www.who.int/mediacentre/factsheets/fs164/en/
- Bakht, Zaman., Faisal, Siddique., Waseem, Hassan., Chromatographia, 2016. 79(1): p. 1605-1613.
- Rezk, MR., Basalious, EB., Amin, ME., Biomedical Chromatography, 2016. 30(9): p. 1354-1362.
- Goodman, LS., Gilman, AG., The Pharmacological Basis of Therapeutics (9th Edn.), 1996.
- https://www.who.int/mediacentre/factsheets/fs164/en/
- William, OF., Varghese Bombay, 1989.
- David, GW., Harcourt Publishers, 1999.
- Roger, ES., CRC Press, 1990.
- https://www.fda.gov/ohrms/dockets/98fr/001424gl.pdf
- Beckett, AH., Stenlake, JB., CBS Publishers, 1986.
- Lloyyd, R., Snyder, JJ., Glajch, JL., Wiley, 2012.
- Snyder, LR., Kirckland, JJ., Wiley Interscience, 1979.
- Miller, JC., Miller, JN., Ellis Horwood, 1992.
- Demuth, JE., New York, Marcel Dekker, 1999.
- https://www.pharmacopoeia.com/
Open Access Journals
- Aquaculture & Veterinary Science
- Chemistry & Chemical Sciences
- Clinical Sciences
- Engineering
- General Science
- Genetics & Molecular Biology
- Health Care & Nursing
- Immunology & Microbiology
- Materials Science
- Mathematics & Physics
- Medical Sciences
- Neurology & Psychiatry
- Oncology & Cancer Science
- Pharmaceutical Sciences


