Effect of Waste Water Flow on Ground Water Quality in Parts of Belagavi City
Mohamed Zameerulla1*, BK Purandara2 and AV Shivapur3
1Faculty, Department of Civil Engineering, Government Polytechnic College, Belagavi, Karnataka, India
2Scientist, NIH, HRRC, Visvesvarayanagar, Belagavi, Karnataka, India
3Department of Water and Land Management, VTU, Belagavi, Karnataka, India
- *Corresponding Author:
- Mohamed Zameerulla
Faculty, Department of Civil Engineering, Government Polytechnic College, Belagavi, Karnataka, India
Tel: +91- 9448145445
Email: mzgptbmg@gmail.com
Received Date: October 19, 2018; Accepted Date: November 21, 2018; Published Date: November 26, 2018
Citation: Zameerulla M, Purandara BK, Shivapur AV (2018) Effect of Waste Water Flow on Ground Water Quality in Parts of Belagavi City. J Water Pollut Control. Vol.1 No.2:7.
Copyright: © 2018 Zameerulla M, et al. This is an open-access article distributed under the terms of the Creative Commons Attribution License, which permits unrestricted use, distribution, and reproduction in any medium, provided the original author and source are credited.
Abstract
Belagavi is a two-tier city in Karnataka and is one of the fastgrowing cities of India. Belagavi city is also one of the cities selected under Smart city program of the government of India. However, to cop up with the escalating population, the infrastructure facility need to be addressed on priority basis. One of the most important issues which need immediate attention is with regard to liquid and solid waste disposal. Presently, the entire sewage water of the city is linked through gutters and sewer lines to a stream locally known as Bellary nala. The Bellary nala is a part of Deccan planes and lies between longitude 74o30’E and 74o40’E and latitude 15o45’N to 15o55’N in the Belagavi district of Karnataka State, India. The nala which was once a perennial stream carrying fresh water has now turned into a sewer drain due to the discharge of large quantities of effluent into the stream. It is observed that the discharged waste waters are derived from domestic wastes, small-scale industries and also from the improper dumping of sewage wastes. Further, it is noticed that the flow of wastewater is much beyond the self-purification capacity of the stream and is found to be responsible for polluting the adjoining catchment waters. This nala passes through a highly fertile black cotton soil, which is underlain, by very good aquifers. An Aquifer is an underground layer of water bearing permeable rock, rock fractures or unconsolidated materials (gravels, sand or silt). Groundwater can be extracted using water well. Farmers along this nala pump out this wastewater for irrigating sugarcane, paddy, vegetables etc., and it is reported that such utilization of wastewater for irrigation resulted in worsening the water quality conditions in the riparian belts. Therefore, to understand the extent of pollution on surface and groundwater quality, detailed hydrochemical analysis have been carried out by sampling groundwater samples from selected locations of Belagavi City.
Keywords
Hydrochemical; Ground water; Waste water; Sewage
Introduction
In most of the growing urban cities, one of the major issues is with regard to the discharge Any form of liquid wastes which is primarily generated by domestic activities, industries, agriculture and commercial establishments This water contains different quantities of pollutants which contaminates water and makes it unfit for any productive or domestic use. Therefore, it is necessary to understand the impact of unscientific management of wastewater on the existing surface and groundwater bodies in the vicinity of major cities of India. In this context, a two-tier city of Northern Karnataka (Belagavi) has been identified and studied for hydro-geochemical parameters.
Belagavi City is one of the fast-growing City in Karnataka due to its geographic location and pleasant climate. Due to the acute shortage of water problem, the city corporation has started supplying groundwater from selected wells in the city. The city generates a sizable amount of liquid and solid waste. The solid waste amounts to about 180 to 200 tons per day. There are 2 waste disposal sites in Belagavi City. The solid waste is directly dumped into these depots located within the Corporation limits. The most damaging waste in the Belagavi city is in the form of sewage. The city uses about 20 mgd of both surface and groundwater and considering 20% loss about 16 mgd of sewage is generated in the area. There are no sewage treatment plants and recycling facilities within the City area. The entire sewage is directed to Bellary nala which is linked through gutters and sewer lines. Bellary nala once a perennial stream carrying fresh water has now turned into a sewer drain all along its course of about 30 km. This nala passes through a highly fertile black cotton soil which is underlain by a very good aquifer, probably by now, this freshwater aquifer might have been contaminated with the influx of sewage. The farmers along this nala pump out the sewage water for irrigating sugarcane, paddy, vegetable etc., thereby passing the toxic contaminants into the food chain. With the growth of Belagavi City the contribution of surface runoff to this nala has decreased many folds and every year the vast stretch of fertile land on either side is flooded for several weeks during the rainy season. This causes enormous damage to the standing crops on this fertile land thereby depriving the farmers of their fruits of labor and investments.
Study Area
Belagavi city is located between longitude 74o30′E and latitude 15o57′N (Figure 1). The city area is divided into 3 river catchments namely Bellary nala (53.35%), Markandeya river catchment (31.65%) and Mongetri Nala catchment (14.98%). Belgaum municipality was established in the year 1951 and in 1977 it was given the status of Municipal Corporation. In the later years Kudchi, Kanabargi, Alarwad, and Yamunapur were merged with the corporation of the city of Belgaum. The population of the city is more than 5 lakhs including cantonment population. The city gets its water supply from Rakkaskop barrage across Markandeya River located about 25 km west of Belagavi city (Figure 1). The area falls under the semi-arid climate with an average annual normal rainfall of 1324 mm. nearly 95% of the annual rainfall is received during the period June to October through the south-west monsoon.

Figure 1: Study Area map of Belagavi City and adjoining area.
In the last few decades a number of studies was carried out with regard to wastewater quality and characteristics. Schneider and Tanwar [1,2] observed high chloride content in groundwater due to the discharge of industrial effluents and domestic sewerage based on their studies carried out in the US and Netherlands respectively. Wastewater quality studies carried out for Bhopal city, reported the high concentration of BOD and COD due to the impact of sewage [3]. Suresh [4] also made similar observations for groundwater, in and around Belagavi City. According to the study, the concentrations of sodium and chloride ions are higher than the permissible limits indicating the salinity problems in most of the areas of Belagavi City. Gogte Institute of Technology [5], Belagavi conducted groundwater quality studies in Belagavi City observed the high concentration of nitrate in various parts of the study area. It is also noticed that there is a considerable increase in nitrate concentration as revealed from the available data (1995 to 2001). Studies carried out by Rangaraj et al, Reddy et al and Nemade and Shrivastava [6-8] showed high nitrate concentration in ground waters and attributed this to domestic waste flowing from septic tanks and sewage lines. In the recent days, water Quality studies were carried out by Idris et al., Agrawal et al., Sharholy et al., Moghdam et al., Hoornweg et al., Saboji et al., Neha et al., and Sapna and Gadag [9-16].
Materials and Methods
Manual sampling with a plastic container in compliance with established standard norms was adopted. Labels were used to prevent sample misidentification. Sample preservation was done in tune with Ground Water Board guidelines with the minimum possible time lapse between collection and analysis.
Water samples were drawn from both open and bore wells during the pre-monsoon season of 2016. The physical parameters such as temperature, pH and electrical conductivity were determined in the field at the time of sample collection using portable thermometer, pH meter, and water testing kit. Other major anions and cations were determined by using standard methods as suggested by APHA [17].
Results and Discussion
Table 1 shows the average groundwater quality parameters observed in Belagavi city. The temperature of the water is one of the most important characteristics, which determine the trends and tendencies of changes in its quality. The shifting of various dynamic equilibrium of parameters such as the concentration of carbonates, sulfides and degree of alkalinity or electrical conductivity is affected by temperature changes. In the present study temperature of the samples varied from 25.6°C to 27.6°C. The pH value showed wide variations ranging between 4.1 and 7.34. Low pH was observed in some of the shallow open wells (near Narthaki talkies and Kapileshwari temple). This kind of highly acidic water could be due to the mixing of industrial wastes with shallow groundwater. Maximum pH was noticed at Jyothirling Galli and Kanbargi open wells relatively deeper than Narthaki and Kapileshwari wells).
Table 1. Descriptive statistics of observed groundwater quality parameters.
| Parameters | Max | Min | Standard deviation |
|---|---|---|---|
| pH | 7.34 | 4.1 | 2.29 |
| EC | 3445 | 60 | 1199.12 |
| TDS | 2360 | 40 | 738.83 |
| HCO3 | 900 | 22 | 213.23 |
| Tot Alk | 900 | 22 | 214.17 |
| Chlorides | 2268 | 18 | 554.21 |
| Sulphate | 67 | 11 | 16.05 |
| TH | 776 | 12 | 261.73 |
| Ca | 490 | 4.2 | 116.91 |
| Mg | 84 | 0.98 | 26.59 |
| Na | 187 | 9 | 64.77 |
| K | 24 | 2 | 6.49 |
| E. Coli | 300 | 12 | 65.17 |
Electrical Conductivity varies between 60 mmhos/cm and 3445 mmhos/cm. Minimum is observed at Mangalwarpeth, Tilakwadi and maximum is observed in Kanbargi (near main road bus stop). There is a marked variation in the Electrical conductivity in the rural area. It is found that the electrical conductivity of the rural areas is higher in the villages close to Bellary nala whereas it is considerably less in wells away from the nala. Total dissolved solids showed a good correlation with the concentration of electrical conductivity. Higher concentration of TDS is seen towards the Kanbargi (near main road bus stop). In the case of residential area, higher TDS was observed in the northeastern part of Belagavi i.e. in Annapurneshwari Nagar, Vadagoan. The TDS content varies from 40 mg/l to 2360 mg/l. The maximum TDS is noted in the wells in the irrigated lands.
Total alkalinity represents the combined concentration of both carbonates and bicarbonates. This is found to be minimum (22 mg/l) at Mangalwarpeth, Tilakwadi and maximum (900 mg/l) at Adarsh Vidyalaya Road, Hindwadi. Wide variations in the alkalinity values were observed in areas outside the city. Chloride concentration varies from 18 mg/l to 2268 mg/l. in the city area. The minimum is observed at Hanuman Nagar and Hindwadi and maximum at Kanbargi (near main bus stop). The main reason for such a high value of chloride in Kanbargi is because of the continuous use of Bellary nala water for irrigation during the non-monsoon season. It is also observed that the chloride concentration is increasing towards the southeastern side. It is important to note the declination of chloride concentration away from Bellary nala.
Fluoride derived from fluorite and the minerals apatite and mica, is generally present in only low concentration in groundwater. Volcanic and fumarolic gases can contain fluoride, and in some areas may be the source of fluoride in groundwater. The concentration of fluoride in drinking water range from 0.1-1.15 mg/l. The median range of fluoride is 0.8 mg/l. Very high content fluorides could be due to the agricultural activities as wells geogenic reasons.
The sulfate content in the present study area varies from 11 mg/l to 67 mg/l. Very low sulfate is found in a well near Old P.B. Road (well close to Manikbag automobiles and adjoining areas). Maximum sulfate concentration of 67 mg/l was found in Kanbargi(near main road bus stop). This indicates that no such atmospheric pollution exists in the city. But many places show the sulfate concentration below the detectable limit.
Nitrogen is very minor constituents of rocks but is a major constituent of the atmosphere. The concentration of nitrate in the present study varies between 0.29 ppm to 29.2. It is well within the permissible limit. This clearly indicates that the groundwater is getting polluted in and around Belagavi city due to manmade reasons.
The distribution of alkaline earth metals like Calcium and Magnesium are found to be high in irrigated lands. Highest concentrations of Ca (490 mg/l) were noted in a well near Kanbargi (near the bus stop) and 235 mg/l is observed in Gayathri nagar. Both these locations are close to the Bellary nala. It is observed that the concentration decreases towards the western part of the study area. In the outskirts of the city, the concentration of calcium is comparatively lower than the city area. A similar trend is seen in the case of distribution of Magnesium. Maximum concentration is noticed at Kanbargi (58.56 mg/l) and a minimum of 0.98 mg/l is observed at Jeonibhavi, Kanbargi. In general, both calcium and magnesium are comparatively lower in the western part of the Belagavi city.
Sodium concentration ranges from 9 mg/l to 187 mg/l. Minimum concentration was found in Jeoni Bhavi, Kanbargi and the maximum was noticed at Kanbargi (near the old bus stop). In the extension and rural areas, the variation of sodium was between 11 mg/l and 149 mg/l. The minimum is observed at Mangalwarpeth, Tilakwadi and maximum at Annapurneshwarinagar, Vadagaon. Similar to the distribution of other ions, sodium also found to be higher in the irrigated lands. Further, the concentration showed an increasing nature towards north-eastern part of the city. In general, the distribution of sodium showed an increase in the rural areas as compared to the city area. A similar trend is seen in the case of potassium. The highest concentration of potassium is also found in Kanbargi (near the old bus stop).
Iron is one of the major constituents of rocks. Usually iron in groundwater, in the form of ferric hydroxide is less than 0.3 ppm. Present observation does not highlight many concentrations of iron in the majority of the locations both in irrigated and non-irrigated areas. However, at Halga, Kamkarhatti and Santibastwad iron concentration observed is 0.2 mg/l. The contour maps of iron in irrigated and residential area.
Diagrammatic representation of geochemical data
Geochemical studies often involve synthesis and interpretation of a mass of analytical data. The objective of interpretation may be to aid in the classification of waters of different geochemical characteristics for utilization purposes, solving problems of saline water intrusion, or ascertaining various factors on which the chemical characteristics of waters depend. The examination of tabular statements of geochemical data of a large number of samples is not only a tedious and irksome process but fails to bring out geochemical aspects. The dominant ions, Ca, Mg, Na+K, HCO3+CO3, SO4 and Cl in a water sample can be represented in several ways. For these representations, the epm values are most commonly used. Progressive changes in the geochemical characters of a large number of samples can best be studied by plotting selected constituents on bilinear and trilinear diagrams. Thus, on a twocoordinate field, the relation between the concentrations of calcium, magnesium, sodium, bicarbonate, sulfate, chloride, etc. and total dissolved solids can be studied.
Piper’s diagram
The chemical relationship of the samples of groundwater in Piper’s trilinear diagram (Figure 2) shows that the cations and anions are concentrated at the right-hand corner of the triangular fields [18]. This indicates that the quality of groundwater is dominated by non-carbonate alkali (which exceeds 50%), i.e. chemical properties are dominated by alkalies and strong acids indicating the dominance of sodium and chloride ions.

Figure 2: Pipers Diagram of different sampling stations.
Based on Piper’s diagram, (Figure 2), the Belagavi city water can be classified basically under four major categories. However, the samples mainly exhibit a type dominated by chloride type or Cl-SO4-HCO3 type representing strong acids exceed weak acids which represent non-carbonate alkali exceed 50%. In the case of cations, it is noticed that the water is dominated by calcium concentration in the majority of the samples.
Sodium adsorption ratio
Sodium concentration is an important criterion in irrigationwater classification because sodium reacts with the soil to create sodium hazards by replacing other cations. The extent of this replacement is estimated by Sodium Adsorption Ratio (SAR). The SAR is calculated using the formula:
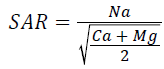
The classification is made based on the ranges shown below (Table 2).
• 1 to 5.00 is Low; 5.00 to 10.00 is Moderate; 10.00 to 20.00 is High; > 20, V. High
Table 2. Sodium adsorption ratio observed for Belgaum city.
| Sl. No. | Sampling Stations | SAR | Category |
|---|---|---|---|
| 1 | Yellur U/S | 4.05 | Low |
| 2 | Yellur D/S | 2.55 | Low |
| 3 | Anand nagar, Vadagaon | 4.18 | Low |
| 4 | KLE Hospital, Yellur Road | 2.4 | Low |
| 5 | Annapurneshwari nagar, Vadagaon | 13.07 | High |
| 6 | Manickbag | 16.39 | High |
| 7 | Patil galli | 4.68 | Low |
| 8 | Old PB Road Khasbhag | 4.58 | Low |
| 9 | Gayathri nagar | 11.29 | High |
| 10 | Near Narthaki, Talkies, Kapileshwari temple | 16.56 | High |
| 11 | Indal Road, Kanbargi | 3.39 | Low |
| 12 | Jyothirling galli, Indal road, Kanbargi | 21.25 | Very High |
| 13 | Kanbergi Bus stop | 18.86 | High |
| 14 | Jeoni bhavi | 2.41 | Low |
| 15 | Jyothirling galli, Kanbargi | 8.21 | Moderate |
| 16 | Adarsh Vidyalay, Hindwadi | 6.52 | Moderate |
| 17 | Hanuman nagar, Hindwadi | 4.57 | Low |
| 18 | Mangalwarpeth, Tilakwadi | 6.28 | Moderate |
| 19 | Somwarpeth, Tilakwadi | 3.74 | Low |
| 20 | Somawarpeth, Tilakwadi | 5.96 | Moderate |
The SAR ratio varies from 2.4 to 21.25. The minimum was noticed at KLE Hospital, Yellur Road (2.4) and maximum at Jyothirling galli, Indal Road, Kanbargi (21.25).
Conclusions
The presented study showed that c higher concentration of sodium in many places could be attributed to the sodium-rich source rocks. Sodium rich clays were reported in parts of Belagavi, which may release sodium ions during the exchange reaction that lead to sodium enrichment. Meanwhile, the increase of chloride and nitrate is a clear indication of the mixing of sewage water with groundwater. In addition to this, the excessive irrigation, taking place in the extension areas of Belagavi City also contributes to groundwater salinization, especially areas where the sewage water is used for irrigation. Nitrate concentration observed in various parts of the Belagavi City showed an increasing trend indicating the impact of urbanization on groundwater quality over a period of time. An analysis of the data collected, followed by field investigations and discussions held with various scientists working in this area revealed that groundwater is getting contaminated, especially, due to waste disposals without any precautions. It is reported that the constituents from the waste sites are being added to the groundwater region. However, away from the dump site the concentration diminished to an acceptable level. This observation also supports the fact that, it is necessary to go for sewage treatment plants so that the pollution due to use of the water by farmers and the mixing of sewage with groundwater can be minimized.
References
- Schneider WJ (1970) Hydrobiologic implications of solid waste disposal USGC, Circular 601-E, Department of interior USA.
- Tanwar BS (1981) Groundwater pollution and its protection in Haryana, India Proc Int Symp on groundwater quality. Netherlands, pp: 1097-1100.
- Saxena S, Shrivastava P (2002) Groundwater quality of a typical urban settlement: a case study of the impact of Town Planning, Poll Res 21: 223-226.
- Suresh G (1996) Studies on conjunctive utilization of surface and groundwater for achieving sustainable drinking water supplies in Belagavi City, Karnataka. M. Sc dissertation submitted to the University of Goa (unpublished).
- Gogte Institute of Technology, (1996) Groundwater quality studies of deep aquifers of City Corporation of Belagavi. BE Project Report, Department of Civil Engineering (GIT, Belagavi), Karnataka University, Dharwar.
- Rangaraj SV, Murgeram Elango L, Elampooran T (1996) Nitrate in groundwater of suburban regions of Madras city. Ind J Env Prot 16: 573-576.
- Reddy UVB, Reddy KP, Sundarsham V, Rajeshwar Reddy B (1995) Hydrochemistry of Musi river and groundwater of Hyderabad city. Ind J Env Prot 15: 440-446.
- Nemade PN, Shrivastava VS (1997) Nitrate (NO3-N) status in groundwater in the tribal belt of Satpura valley. Ind. J Env Prot 16: 430-433.
- Idris A, Inane B, Hassan MN (2004) Overview of waste disposal and landfills/dumps in Asian countries. Material cycles and waste management 16, pp: 104-110.
- Agarwal A, Singhmar A, Kulshrestha M, Mittal AK (2005) Municipal solid waste recycling and associated markets in Delhi, India. J Resour Conserv Recycl 44: 73-90.
- Sharholy M, Ahmed K, Vaishya R, Gupta R (2007) Municipal solid waste characteristics and management in Allhabad. India Waste Management 27: 490-496.
- Moghadam MA, Mokhtarani N, Mokhtarani B (2009) Municipal solid waste management in Rasht City, Iran. Waste Management 29: 485-489.
- Hoornweg, D, Bhada P-Tata (2012) What a Waste: A global review of solid waste management. Elsevier.
- Mayor Saboji, RB Gadag (2014) Effect of turmuri solid waste landfill on soil and groundwater, all India conference on waste management and pollution control. The Institution of Engineers local Center, Belagavi, pp: 206-210.
- Neha Gupta, Vinit Kumar (2015) A review on current status of municipal solid waste management in India. J Enviro Sci 37: 206-217.
- Sapna Upadhyay, Ravikiran BG (2017) Solid waste disposal site selection for Belgaum city-a case study, International conference on hydraulic and environmental systems, KLE Dr. MS Sheshgiri college of engineering and technology, Belagavi, Karnataka, India, pp: 220-226.
- APHA A (1989) WPCF American Public Health Association. Water Pollution Control Federation. Standard Methods of Examination of Water and Wastewater, 17th ed., Washington, DC.
- Piper AM (1944) A Graphic procedure in the geochemical interpretation of water analysis. Am Geophys Union Trans 25: 914-923.
Open Access Journals
- Aquaculture & Veterinary Science
- Chemistry & Chemical Sciences
- Clinical Sciences
- Engineering
- General Science
- Genetics & Molecular Biology
- Health Care & Nursing
- Immunology & Microbiology
- Materials Science
- Mathematics & Physics
- Medical Sciences
- Neurology & Psychiatry
- Oncology & Cancer Science
- Pharmaceutical Sciences