Are Burn Unit Admissions Increased during Weekends and Certain Holidays?
Trehan K1,2*, Healy J2, Gregg SC1, Glasgow K1, Crombie RE1, Cholewczynski WM1, Atweh N1 and Savetamal A1
1 Connecticut Burn Center, Bridgeport Hospital, Bridgeport, Connecticut, USA
2 Department of Surgery, Yale New Haven Hospital, Yale School of Medicine, New Haven, Connecticut, USA
- *Corresponding Author:
- Kanika Trehan
Connecticut Burn center, Bridgeport Hospital
267 Grant Street Bridgeport, CT 06610, USA.
Tel: 203-384-3728
E-mail: Kanika.Trehan@yale.edu
Received Date: November 28, 2017; Accepted Date: December 15, 2017; Published Date: December 19, 2017
Citation: Trehan K, Healy J, Gregg SC, Glasgow K, Crombie RE, et al. (2017) Are Burn Unit Admissions Increased during Weekends and Certain Holidays? J Emerg Trauma Care. Vol.2 No.2:6
Abstract
Background: Anecdotal evidence suggests an increased incidence of burn admissions during weekends and certain times of the year, particularly the summer holidays. We formally analyzed the timing of admissions to our burn unit as well as severity of injury by date to investigate more precisely the temporal patterns of burn injuries throughout the year.
Materials and methods: A retrospective chart review was performed of all patients admitted to our burn center from 2006-2015. Date, day of the week, month, and season of admission were collected and analyzed. Type of burn injury and total body surface area (TBSA) were also noted for each admission from 2013-2015.
Results: The majority of admissions occurred on Sundays (39 ± 4 compared to 30 ± 6, p=0.0009), the second most occurred on Mondays (36 ± 6, p=0.038), while the least occurred on Thursdays (24 ± 4, p=0.0169). Most admissions occurred in July compared to other months (22 ± 5 compared to 17 ± 2, p=0.017). Analysis by season revealed that most admissions occurred in the summer (60 ± 11 compared to 50 ± 3, p=0.0125). Scald injuries were most likely to occur in November (10 ± 9 compared to 7 ± 8, p=0.0055) and least likely to occur in February (4 ± 8, p=0.0388). Injuries occurring in July had the smallest total body surface area compared to other months (4 ± 2.5 compared to 8 ± 2.1, p<0.0001), and injuries in November were second smallest (5 ± 5.4, p=0.0147). Injuries occurring on Wednesdays were smaller than the other days of the week (2 ± 9 compared to 7 ± 3, p=0.0006).
Conclusion: Burn unit admissions are more likely to occur on the Sundays and Mondays and least likely to occur on Thursdays. July and the summer also tend to have higher rates of admissions than the rest of the year. Scald injuries are most likely to occur in November and least likely to occur in February. Admissions occurring during July, November, and on Wednesdays are associated with overall smaller-size injuries.
Keywords
Burn; Fire; Emergency; Admissions
Abbreviations
ED: Emergency Department; TBSA: Total Body Surface Area
Introduction
Each year 500,000 burn injuries and 50,000 burn admissions occur across the United States. Of these, 20,000 meet specific criteria for transfer to a dedicated unit that specializes in the multidisciplinary care of burn patients [1]. Burn centers are typically staffed by surgeons specially trained in trauma and burn care as well as specialized nurses, physical therapists, respiratory therapists, nutritionists, psychologists, pharmacists, and social workers. Burn centers must also have specialized operating room availability with specially trained staff equipped to perform unique burn surgical procedures. Finally, hospital emergency departments (EDs) as well as regional referring facilities also play a significant role in triaging burn victims and the availability of these emergency medical services is critical. Delay in care due to understaffing at any level, or overall poor preparedness of the burn center, can lead to avoidable complications [2].
Research designed to help optimally staff EDs has revealed consistent temporal and seasonal trends in overall visits to EDs across the country. Day of week, climate, and certain public holidays have all been shown to affect incidence of ED visits with higher number often noted on Mondays and in the summer and autumn, while most public holidays are associated with fewer ED visits [3,4]. Major trauma visits, on the other hand, tend to occur more commonly in the afternoon and evenings, on weekends, and also have a tendency to occur in the summer and autumn [5,6].
Trends in the timing of burn unit admissions are less well understood. Chemical burns have been reported to occur more typically in the spring [7] while pediatric burn injuries have been shown to be more common on weekends and between 4:00 and 6:00 PM [8]. There is also evidence to suggest that incidence of burn injury has correlated with various public health policies; for example, decreased burn admissions have been observed following the enforcement of smoke detector laws and firework regulations [9,10]. Our anecdotal experience suggests that weekends and holidays such as the Fourth of July and Thanksgiving are associated with a higher incidence of burn injuries; to our knowledge, however, there is no published data clearly documenting temporal and seasonal trends of burn center admissions. This information may be useful to burn centers in ensuring preparedness, especially because hospitals may be understaffed during certain holidays and weekends, with implications for possible under-preparedness in the event of a burn disaster during these times.
Methods
After obtaining IRB approval, we retrospectively analyzed all admissions to our burn center from 2006-2015. We also analyzed the total body surface area (TBSA) and type of burn injury for all admissions between 2013-2015, the time period after our institution adopted an electronic medical record system from which we could extract the details of each burn injury. For each patient, the date, day of week, month, and season of admission were documented. Winter was defined as January-March, spring as April-June, summer as July-September, and autumn as October-December. Burn injuries were categorized as flame, scald, contact, or other (including chemical, electrical, and frostbite). For each date, we calculated the average TBSA of all admissions. Statistical analyses were performed using SPSS v. 22.0 (IBM Corp., Armonk, NY) and GraphPad Prism version 6.0. For all analyses, p-values <0.05 were considered significant.
Results
Timing and incidence of admissions (2006-2015)
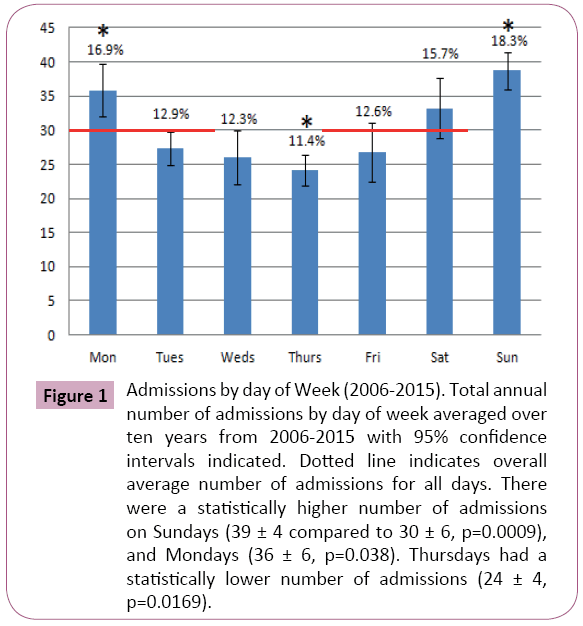
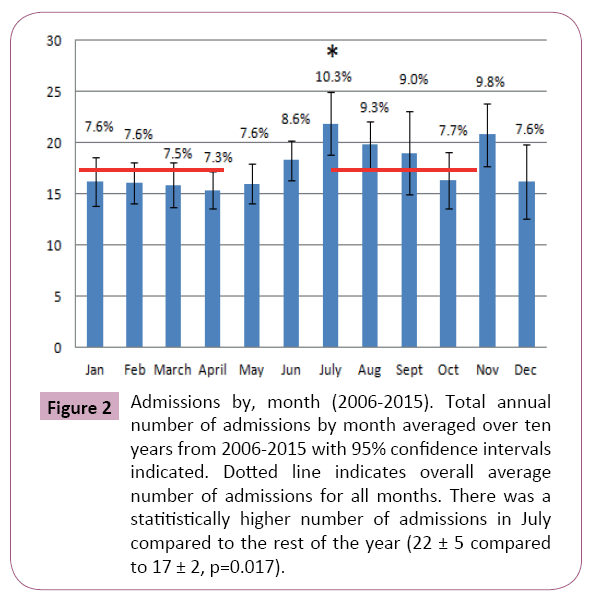
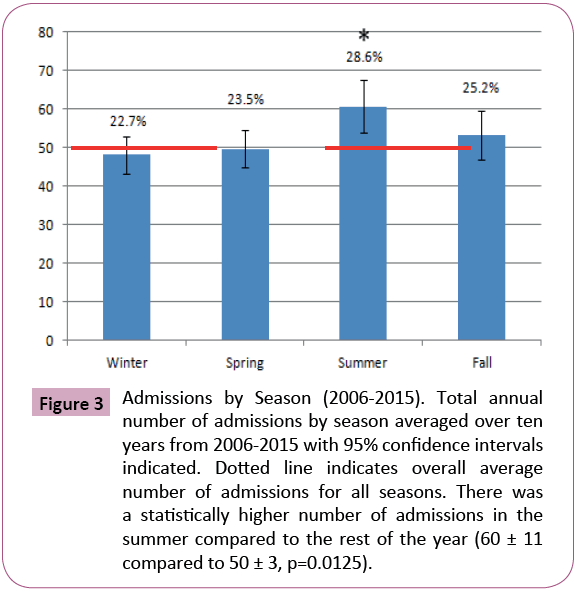
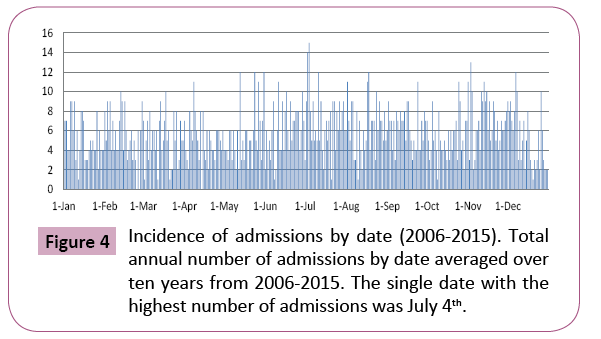
Over 10 years, 2119 patients were admitted to the burn unit. The overall average number of admissions for all days was 30 ± 6. There were a statistically higher number of admissions on Sundays (39 ± 4, p=0.0009), as well as on Mondays (36 ± 6, p=0.0380). Thursdays had a statistically lower number of admissions (24 ± 4, p=0.0169) (Figure 1). The overall average number of admissions for all months was 17 ± 2. There was a statistically higher number of admissions in July (22 ± 5, p=0.017) (Figure 2). The overall average number of admissions for all seasons was 50 ± 3. There was a statistically higher number of admissions in the summer (60 ± 11, p=0.0125) (Figure 3). Finally, when we analyzed admissions by date, we observed that the single date with the highest number of admissions was July 4th (Figure 4).
Figure 1: Admissions by day of Week (2006-2015). Total annual number of admissions by day of week averaged over ten years from 2006-2015 with 95% confidence intervals indicated. Dotted line indicates overall average number of admissions for all days. There were a statistically higher number of admissions on Sundays (39 ± 4 compared to 30 ± 6, p=0.0009), and Mondays (36 ± 6, p=0.038). Thursdays had a statistically lower number of admissions (24 ± 4, p=0.0169).
Figure 2: Admissions by, month (2006-2015). Total annual number of admissions by month averaged over ten years from 2006-2015 with 95% confidence intervals indicated. Dotted line indicates overall average number of admissions for all months. There was a statitistically higher number of admissions in July compared to the rest of the year (22 ± 5 compared to 17 ± 2, p=0.017).
Figure 3: Admissions by Season (2006-2015). Total annual number of admissions by season averaged over ten years from 2006-2015 with 95% confidence intervals indicated. Dotted line indicates overall average number of admissions for all seasons. There was a statistically higher number of admissions in the summer compared to the rest of the year (60 ± 11 compared to 50 ± 3, p=0.0125).
Timing and type of burn injuries (2013-2015)
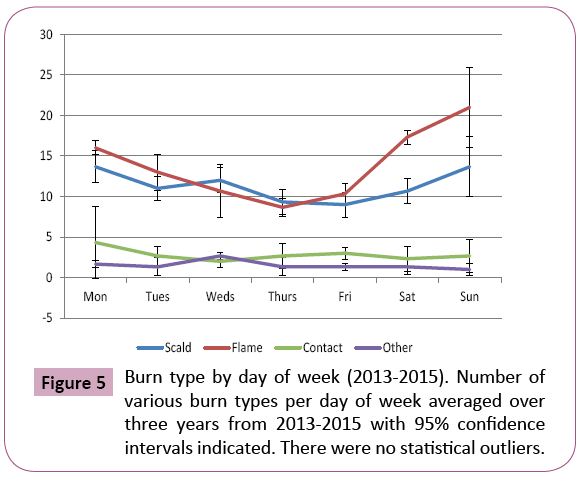
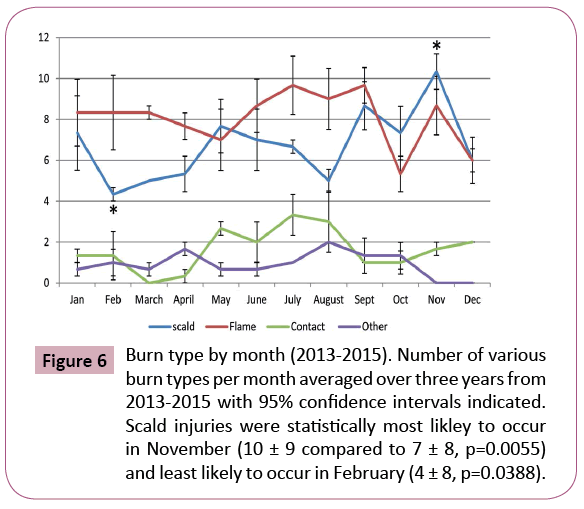
There were no statistical outliers when we analyzed the incidence of various types of burn injuries by day of week (Figure 5). When we analyzed various types of burn injuries by month we found that on average there were 7 ± 2 scald injuries per month. There was a statistically higher number of scalds in November (10 ± 9, p=0.0055) and a statistically lower number of scalds in February (4 ± 8, p=0.0388) (Figure 6).
Figure 6: Burn type by month (2013-2015). Number of various burn types per month averaged over three years from 2013-2015 with 95% confidence intervals indicated. Scald injuries were statistically most likley to occur in November (10 ± 9 compared to 7 ± 8, p=0.0055) and least likely to occur in February (4 ± 8, p=0.0388).
Timing and severity of burn injuries (2013-2015)
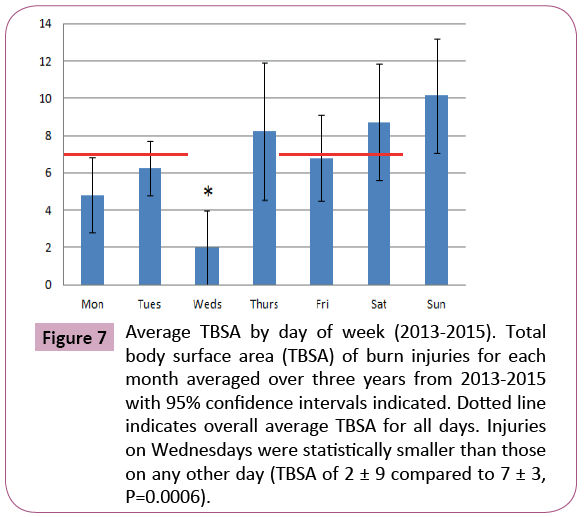
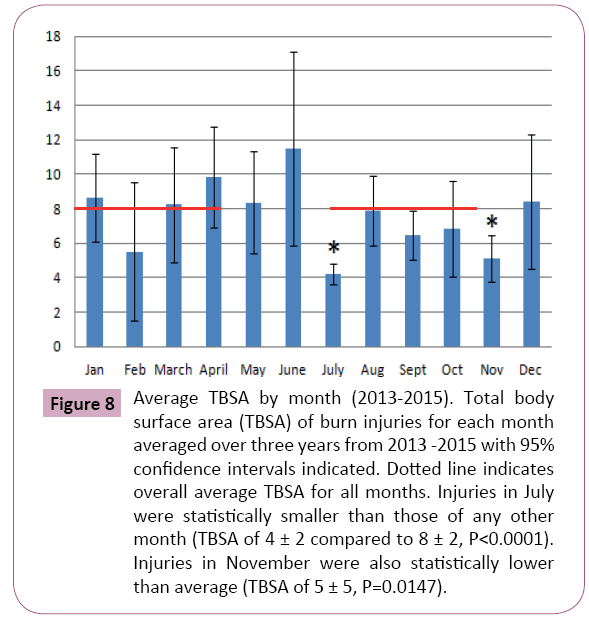
The overall average TBSA for all days was 7 ± 3. Injuries on Wednesdays were statistically smaller than this (TBSA of 2 ± 9, P=0.0006) (Figure 7). The overall average TBSA for all months was 8 ± 2. Injuries in July were statistically smaller than this (TBSA of 4 ± 2, P<0.0001), as were injuries in November (TBSA of 5 ± 5, P=0.0147) (Figure 8).
Figure 7: Average TBSA by day of week (2013-2015). Total body surface area (TBSA) of burn injuries for each month averaged over three years from 2013-2015 with 95% confidence intervals indicated. Dotted line indicates overall average TBSA for all days. Injuries on Wednesdays were statistically smaller than those on any other day (TBSA of 2 ± 9 compared to 7 ± 3, P=0.0006).
Figure 8: Average TBSA by month (2013-2015). Total body surface area (TBSA) of burn injuries for each month averaged over three years from 2013 -2015 with 95% confidence intervals indicated. Dotted line indicates overall average TBSA for all months. Injuries in July were statistically smaller than those of any other month (TBSA of 4 ± 2 compared to 8 ± 2, P<0.0001). Injuries in November were also statistically lower than average (TBSA of 5 ± 5, P=0.0147).
Discussion
Our work demonstrates that there are statistically higher numbers of burn unit admissions on Sundays and Mondays than any other days of the week. Furthermore, there is a clear trend towards fewer injuries in the middle of the week, with the statistically lowest number of admissions on Thursdays. This was not fully in line with our hypothesis that more burn injuries would occur on Fridays and Saturdays, when people are more socially active and thus more likely to engage in higher-risk behaviors. One possible explanation is that people who sustain injuries on Fridays and Saturdays may postpone seeking out medical care until Sunday or Monday, possibly to initially circumvent medical attention. Fewer admissions during the weekdays is likely explained by more people being engaged in safer, regulated activities in the workplace.
Another finding was that there are statistically more burn unit admissions in July than any other month, while November had the second highest average number of admissions although this was not statistically significant according to our data. This corroborated our hypothesis that celebrations associated with holidays such as The Fourth of July and Thanksgiving are significant risk factors for sustaining burn injuries as they involve contact with fire and heat. The high number of admissions seen in July was mirrored by the fact that the summertime showed a statistically higher rate of burn unit admissions than any other season. While July 4th had a clear peak in total admissions compared to any other date, there was no specific peak date in November, which we surmise is a reflection of the fact that Thanksgiving falls on a different calendar date each year. Interestingly, we also did see that the overall number of scald injuries are highest in November. Given that a large proportion of scald injuries are related to cooking- related accidents and that Thanksgiving falls in November, this is in keeping with our hypothesis that this particular holiday may actually be a significant risk factor for burn injuries.
Given that an increased incidence of burn injuries correlates with the timing of high-risk social events such as the Fourth of July and Thanksgiving celebrations, we sought to investigate whether these events also correlate with the severity of burn injury. We were somewhat surprised to find that the average TBSA during these high-risk time periods are actually significantly smaller than during the rest of the year; specifically, July and November had the overall smallest average TBSA injuries. One possible explanation is that although fireworks and cooking expose people to thermal injury, they are presumably conducted within reasonable limits of safety, with adequate access to social, medical, and infrastructural help. In fact, legislation in the 1980s-1990s on indoor smoking alarms and firework safety likely play a large role in limiting the scope of potential injury in these settings [9,10]. As a result, perhaps it is not surprising that we see so many injuries but such a small average TBSA during times of predictable, and thus, preventable injury compared to other times of the year. Additionally, we did note that June was associated with the overall largest TBSA injuries. This is possibly attributable to the fact that the overall incidence of trauma is greater during the summer months and June, a summer month that unlike July is not associated with numerous smaller injuries related to fire-works, may perhaps more accurately reflect this tendency towards larger and more serious burns with greater high-risk behaviors and traumas.
Finally, it is interesting that Wednesdays were associated with the smallest TBSA compared to other days of the week. This is likely best explained by the fact that, unlike the weekends, Wednesdays are not typically associated with high-risk behaviors or celebrations. Also, most people work on Wednesdays, and work-related burn injuries are known to be fewer and less severe due to increased fire safety regulations mandated in the workplace by law [11]. There is no clear explanation, however, why we would see smaller injuries on Wednesdays compared to other weekdays.
While our study does point to certain interesting trends in the incidence and epidemiology of burn unit admissions, there are several limitations of this work. A major limitation is that this is a single institutional database and will therefore reflect trends only in our immediate geographical vicinity and will therefore fail to account for different cultural norms in other parts of the country and the world where other holidays and religious events may be more likely to influence burn unit admissions. Another major limiting factor is that our data only accounts for those patients who were formally admitted to our burn unit, and does not take into account patients who were seen on an outpatient basis as our current medical record system does not readily grant access to these patients’ information. Finally, this is a retrospective study and is limited by the medical record data, with access to type of burn injury and TBSA available only after 2013 when our institution adopted an electronic medical record system.
Conclusion
Burn unit admissions are statistically more likely to occur on Sundays and Mondays and less likely to occur during during weekdays, particularly on Thursdays. We also saw statistically higher numbers of admissions during July and the summertime, with a possible contributing factor being celebrations related to The Fourth of July. November is associated with a statistically higher number of scald injuries than any other month, with a possible contributing factor being celebrations related to Thanksgiving. Interestingly, injuries occurring during the months of these holidays tend to be smaller in size than the average injury. Reasons for this are unclear, however, one possible explanation is that certain celebratory events as well as the workplace in general have already been targeted by social policies and legislation that aim to limit the severity of possible injury that can occur in these settings. These findings reinforce the importance of appropriate readiness, and suggest that preparedness should extend to hospitals and specifically to burn units to maximize the ability of healthcare systems to care for burn patients, particularly during times of peak admission.
References
- Blaisdell LL, Chace R, Hallagan LD, Clark DE(2012) A half-century of burn epidemiology and burn care in a rural state. J Burn Care Res 33:347-353.
- Vercruysse GA, Ingram WL, Feliciano DV (2011) The demographics of modern burn care: Should most burns be cared for by non-burn surgeons? Am J Surg 201:91-96.
- Castner J, Yin Y, Loomis D, Hewner S (2016) Medical Mondays: ED utilization for medicaid recipients depends on the day of the week, season, and holidays. J EmergNurs42:317-324.
- Shepherd SL, LaFleur BJ (1996) The increased incidence on Mondays of work-related sprains and strains. J Occup Environ Med 38:681-688.
- Kieffer WK, Michalik DV, Gallagher K, McFadyen I, Bernard J, et al. (2016) Temporal variation in major trauma admissions. Ann R Coll SurgEngl98:128-137.
- Loder RT, Abrams S (2011) Temporal variation in childhood injury from common recreational activities. Injury 42:945-957.
- Ruckart PZ, Orr MF, Centers for Disease Control and Prevention (2015) Temporal trends of acute chemical incidents and injuries-hazardous substances emergency events surveillance, nine states, 1999-2008. MMWR Suppl64:10-17.
- Verey F, Lyttle MD, Lawson Z, Greenwood R, Young A (2014) When do children get burnt? Burns40:1322-1328.
- Myers J, Lehna C (2016) Effect of fireworks laws on pediatric fireworks-related burn injuries. J Burn Care Res 38: e79-e82.
- Gorman RL, Charney E, Holtzman NA, Roberts KB (1985) A successful city-wide smoke detector giveaway program. Pediatrics 75:14-18.
- Clouatre E, Gomez M, Banfield JM, Jeschke MG (2013)Work-relatedburninjuries in Ontario, Canada: A follow-up10-yearretrospectivestudy. Burns39:1091-1095.
Open Access Journals
- Aquaculture & Veterinary Science
- Chemistry & Chemical Sciences
- Clinical Sciences
- Engineering
- General Science
- Genetics & Molecular Biology
- Health Care & Nursing
- Immunology & Microbiology
- Materials Science
- Mathematics & Physics
- Medical Sciences
- Neurology & Psychiatry
- Oncology & Cancer Science
- Pharmaceutical Sciences
