ISSN : 2349-3917
American Journal of Computer Science and Information Technology
An Efficient Classification Model for Unstructured Text Document
Mowafy M1*, Rezk A2 and El-bakry HM2
1Department of Information Systems, Faculty of Computers and Information, Kafrelsheikh University, 33512, Egypt
2Department of Information Systems, Faculty of Computers and Information, Mansoura University, Mansoura, 35516, Egypt
- *Corresponding Author:
- Mowafy M
Department of Information Systems, Faculty of Computers and Information, Kafrelsheikh University, 33512, Egypt
E-mail: mm_is_85@yahoo.com
Received date: January 22, 2018; Accepted date: February 16, 2018; Published date: February 20, 2018
Citation: Mowafy M, Rezk A, El-bakry HM (2018) An Efficient Classification Model for Unstructured Text Document. Am J Compt Sci Inform Technol Vol.6 No.1:16. doi: 10.21767/2349-3917.100016
Copyright: © 2018 Mowafy M, et al. This is an open-access article distributed under the terms of the Creative Commons Attribution License, which permits unrestricted use, distribution, and reproduction in any medium, provided the original author and source are credited.
Abstract
Document classification has become an important field of research due to the increase of unstructured text documents available in digital form. It is considered one of the key techniques used for organizing the digital data by automatically assigning a set of documents into predefined categories based on their content. Document classification is a process that consists of a set of phases, each phase can be accomplished using various techniques. Selecting the proper technique that should be used in each phase affects the efficiency of the text classification performance. The aim of this paper is to present a classification model that supports both the generality and the efficiency. It supports the generality through following the logical sequence of the process of classifying the unstructured text documents step by step; and supports the efficiency through proposing a compatible combination of the embedded techniques for achieving better performance. The experimental results over 20-Newgroups dataset have been validated using statistical measures of precision, recall, and f-score. The results have proven the capability of the proposed model to significantly improve the performance.
Keywords
Text classification; Document classification model; Unstructured document classification process; Multinomial naive bayes classifier; TF-IDF
Introduction
The day by day rapid growth of the amount of text data and the need for a well-defined methodology to analyze and classify these voluminous data has drawn many communities' attention to this kind of data which is known as unstructured data. This phenomenon has made the importance of text classification begins to spring up. Text document classification (TC) is the process of assigning the text documents to one or more proper category based on their content by building model through a training data. This process is considered a supervised classification technique, since a set of predefined labeled documents is provided as training set.
There have been various issues in proper classification of texts. The size of datasets presents a big challenge. High Dimensionality, that is, a large number of attributes which presents the problem of poor classifier performance since many attributes are irrelevant. This problem can be handled through the feature selection phase, which is considered a major research area. Another issue is how to represent the features of documents which can be done by different methods, such as a binary representation (presence/absence), frequency of occurrences, normalized frequency and many more, which also is one of the research areas.
Among the various machine learning techniques used for text classification, the naive bayes has always been the most popular for many years. Because of its simplicity as well as its speed and effectiveness in the classification task. Naive bayes belongs to the family of simple probabilistic classifier based on the impendent assumption that the value of one feature is different always from the other feature values. With this background, text document classifiers based on naive bayes technique have been studied extensively by many researchers. In their naive bayes classifiers, documents are presented as a binary feature vector according to whether each word is present or absent.
This paper proposes a model that presents the logical sequence of text document classification phases step by step, as well as discusses the possibility of using the multinomial naive bayes with Term Frequency-Inverse document frequency (TFIDF) method for text classification. TF-IDF is a numerical statistic method which calculates the weight for each term in each document. This method evaluates the importance of terms in document collections.
This paper is organized as follows: related work for text classification techniques, especially the naive bayes and its importance in section 2. Section 3 discusses the problem statement. Section 4 presents the proposed model through explaining the general architecture and explaining its major phases. Section 5 provides the experimental analysis of the proposed model. Section 6 concludes the work. Section 7 presents future trends in which the proposed work can exceed.
Related Work
Text document classification studies have become an emerging field in the text mining research area. Consequently, an abundance of approaches has been developed for such purpose, including support vector machines (SVM) [1], K-nearest neighbor (KNN) classification [2], Naive Bayes classification [3], Decision tree (DT) [4], Neural Network (NN) [5], and maximum entropy [6]. In regard to these approaches, Multinomial Naive Bayes test classifier has been vastly used due to its simplicity in training and classifying phases [3]. Many researchers proved its effectiveness in classifying the unstructured text documents in various domains.
Dalal and Zaveri [7] have presented a generic strategy for automatic text classification, which includes phases such as preprocessing, feature selection, using semantic or statistical techniques, and selecting the appropriate machine learning techniques (Naive bayes, Decision tree, hybrid techniques, Support vector machines). They have also discussed some of the key issues involved in text classification such as handling a large number of features, working with unstructured text, dealing with missing metadata, and selecting a suitable machine learning technique for training a text classifier.
Bolaj and Govilkar [8] have presented a survey of text categorization techniques for Indian regional languages and have proved that the naive bayes, k-nearest neighbor, and support vector machines are the most suitable techniques for achieving better document classification results for Indian regional languages. Jain and Saini [9] used a statistical approach to classify Punjabi text. In this paper Naive bayes classifier has been successfully implemented and tested. The classifier has achieved satisfactory results in classifying the documents.
Tilve and Jain [10] used three text classification algorithms (Naive Bayes, VSM for text classification, and the new implemented Use of Stanford Tagger for text classification) for text classification on two different datasets (20 Newsgroups and New news dataset for five categories). Comparing with the above classification strategies, Naïve Bayes is potentially good at serving as a text classification model due to its simplicity. Gogoi and Sarma [11] has highlighted the performance of employing Naive bayes technique in document classification.
In this paper, a classification model has been built on and evaluated according to a small dataset of four categories and 200 documents for training and testing. The result has been validated using statistical measures of precision, recall and their combination F-measure. Results showed that Naïve Bayes is a good classifier. This study can be extended by applying Naive Bayes classification on larger datasets. Rajeswari R, et al. [12] focused on text classification using Naive bayes and K-nearest neighbor classifiers and to confirm on performance and accuracy of these approaches. The result showed that Naive bayes classifier is a good classifier with an accuracy of 66.67 as opposed to KNN classifier with 38.89.
One closely related research paper to our research was of Trstenjak B, et al. [13] that has proposed a text categorization framework based on using KNN technique with TF-IDF method.Both KNN and TF-IDF embedded together gave good results and confirmed the initial expectations. The framework has been tested on several categories of text Documents. During testing, classification gave accurate results due to KNN algorithm. This combination gives better results and needs to upgrade and improve the framework for better and high accuracy results.
The Proposed Model
The proposed model is expected to achieve more efficiency in the text classification performance. Hence, the proposed model has been presented in [13] depends on using KNN with TF-IDF. Our work used the multinomial naive bayes technique according to its popularity and efficiency in text classification nowadays as discussed earlier. Especially, its superior performance than Knearest neighbor as [12] has been illustrated. The proposed model presents combining multinomial naive bayes as a selected machine learning technique for classification, and TF-IDF as a vector space model for text extraction, and chi2 technique for feature selection for more accurate text classification with better performance in comparison to the testing result to of [13] framework.
The general steps for building Classification model as presented in Figure 1 are: Preprocessing for all labeled and unlabeled documents. Training, in which the classifier is constructed from the labeled training prepared instances. Then, the testing that is responsible for testing the model by testing prepared samples whose class labels are known but not used for training model. Finally, usage phase, since the model is prepared to be used for classification of new prepared data whose class label is unknown.

Figure 1: Model Architecture
Pre-processing
This phase is applied on the input documents, either on the labeled data for training and testing phase or on the unlabeled for the usage phase. This phase is used to present the text documents in a clear word format. The output documents are prepared for next phases in text classification. Commonly the steps taken are:
Tokenization: A document is treated as a string, and then partitioned into a list of tokens.
Removing stop words: Stop words such as “the”, “a”, “and”, etc. are frequently occurring, so the insignificant words need to be removed.
Stemming word: Applying the stemming algorithm that converts different word forms into a similar canonical form. This step is the process of conflating tokens to their root form, e.g. connection to connect, computing to compute.
Training phase
vA set of labeled text documents, which is already prepared in the Preprocessing phase,is used as input to this phase. This phase is responsible for learning the classifier model. The output of this phase is a trained classifier which is ready for testing and classifying. Figure 2 illustrates the training phase.

Figure 2: Training Phase
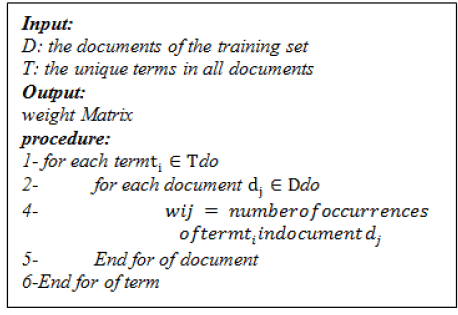
Text document representation: Document representation is the process of presenting the words and their number of occurrences in each document. The two main approaches for this process are Bag of words (BOW)and Vector Space. BOW, in which each word is represented as a separate variable having numeric such as term binary, term frequency or term frequencyinverse document frequency [14]. Vector Space, which is used in the text documents as vectors of identifiers [15]. Our model uses the BOW for representing the text documents using the term frequency weighting schema; while Vector Space will be used in a separate phase. Term Frequency computes the number of occurrences of a term ti in the document j.
tij=fij=frequency of term in document j → (1)
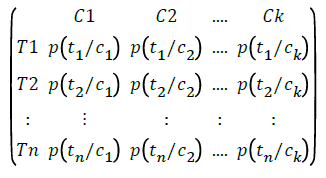
This phase should be finished by creating weigh matrix
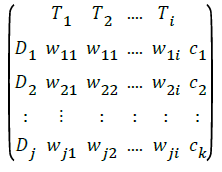
Where each entry Wij represents the weight of term i in the document j. There are several ways of determining the weight Wij. The selected one of our model is Tij which is implemented according to the following pseudo code:
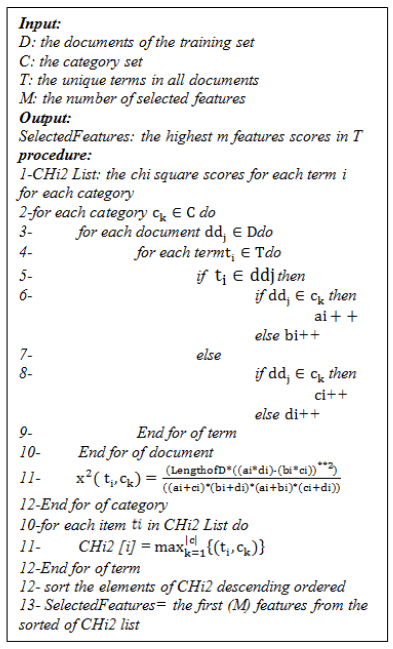
Feature selection: Despite removing the stop words and replacing each term by its stem in the preprocessing phase, the number of words in a weight matrix created in the text representation phase is still very large. Therefore, the feature selection phase is applied for reducing the dimensionality of the feature set by removing the irrelevant features. The goal of this phase is improving the efficiency of classification accuracy as well as reducing the computational requirements. Feature selection is performed by keeping the features with highest score according to the features' importance [16]. The most commonly used methods for features' evaluation include Information Gain, Mutual Information, Chi square statistic, and latent semantic analysis. The proposed model uses Chi square statistic method to be applied in this phase based on the term frequency weight matrix created during the previous phase. Chi square is the selected technique used to measure the correlation between term ti and class Ck [17].
Let a be the number of documents with term and belong to a category ck, b be the number of documents with term and do not belong to the category, c be the number of documents without term and belong to the category, d be the number of documents without term and do not belong to the category. Thus, N is the number of documents in the training set, N=a+b+c +d.
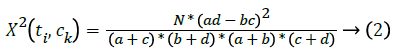
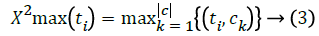
If X2(ti,ck)=0, the term ti and category ck are independent; therefore, the term i doesn't contain any category information. Otherwise, the greater the value of the X2(ti,ck), the more contained category information of the term ti. The score of term ti in the text collection is obtained by maximizing the categoryspecific scores.
The following pseudo code present Chi square test:
Constructing vector space model: Once the feature selection phase has been done and the best M features have been selected, the vector space model will be constructed. That vector space represents each document as a vector with M dimensions, which is the number of selected features set that has been produced in the previous phase, each vector can be written as:
Vd=[W1d,W2d,……..,Wmd]
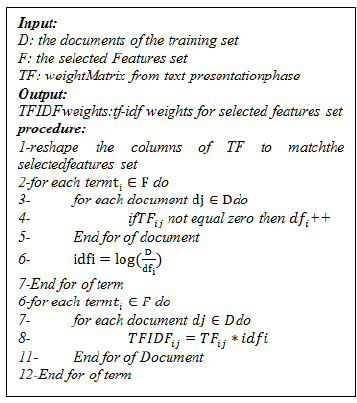
where Wid is a weight for measuring the importance of the term i in document j. There are various methods that can be used for weighting the terms as we mentioned in text presentation phase. Our model uses TF-IDF, which stands for Term Frequency-Inverse Document Frequency. TF-IDF can be calculated as [17]:
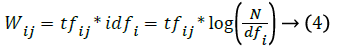
Where Wij is the weight of term i in document j, N is the number of all documents in the training set, tfij is the term frequency for term i in document j, dfi is the document frequency of term i in the documents of the training set. The following pseudo code present TF-IDF vector space model:
Training classifier: Training classifier is the key component of the text classification process. The role of this phase is to build a classifier or generate model by training it using predefined documents that will be used to classify unlabelled documents. The Multinomial naive bayes classifier is selected to build the classifier in our model.
The following probability calculations should be done during this phase:
A. For each term or feature in the selected feature set, calculate the probability of that feature (term) to each class. Assume that a set of classes is denoted by C, where C={c1,c2.......,ck} is the set of class labels, and N is the length of the selected features set {t1,t2,…..tN} according to the use of term frequencies to estimate the class-conditional probabilities in the multinomial model [18]:
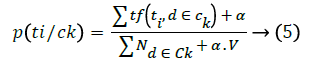
it can be adapted for using with tf-idf for our model, as the following equation:
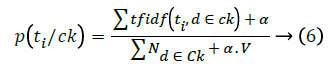
Where:
• ti: A word from the feature vector t of a particular sample.
•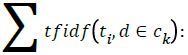 The sum of raw tf-idf of word ti from all documents in the training sample that belong to a class ck.
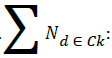 The sum of all tf-idf in the training dataset for class ck
• α: An additive smoothing parameter (α:=1 for Laplace smoothing).
• V: The size of the vocabulary (number of different words in the training set).
The pseudo code for this calculation step is:
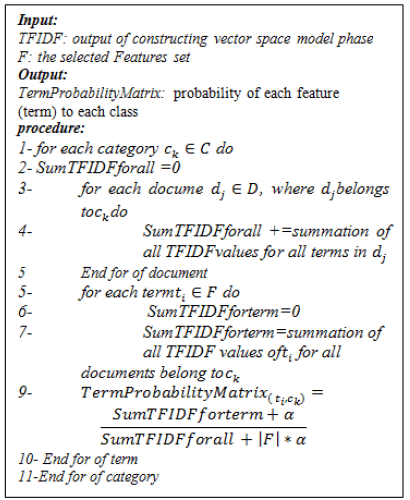
The output of this pseudo code should be in the following form:
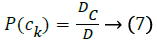
B. Calculate the prior probability for each class. Let Dc, be the number of documents in each class, D be the total number of documents in the training set. P(ck) is calculated using the equation:
Testing phase
This phase is responsible for testing the performance of the trained classifier and evaluating its capability for the usage. The Main inputs of this phase are the trained classifier from the previous phase and labeled testing documents; these documents are divided into:
• Unlabeled documents which were prepared during the preprocessing phase as input for the classification step.
• Their associated class labels which were used as input for the evaluation step. Figure 3 shows the details of the testing phase.

Figure 3: Testing Phase
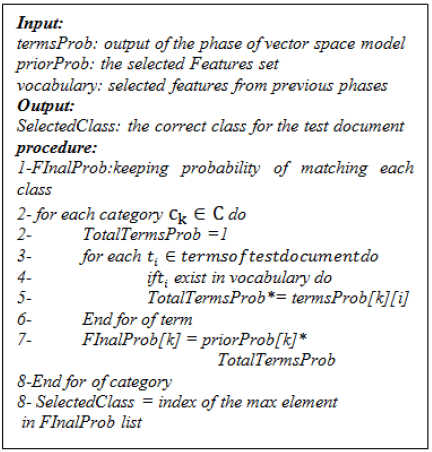
Classification: This step is responsible for assigning an unlabeled document to the correct class of that document. For determining which class that the document d is assigned to, it's required to calculate the probability of assigning that document to each class. Then the class whose highest probability is the correct one. The probability of the document d in class ck is calculated according to [19] using the equation:
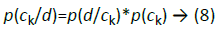
where p(ck) is the prior probability, which is calculated by equation (7). The document d is split through the preprocessing phase into a set of terms {t1,t2,…,tn}.

where p(ti/ck) is calculated using equation (6)

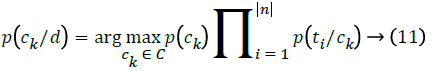
Comparing each unique term in the terms of the test document with the terms' probability calculated in the training phase, then calculating the probability of the document d in each class using equation (11); the one with the highest probability is the correct match. The pseudo code for selecting the correct associated class is shown below:
Evaluation: This step is responsible for evaluating the performance of the classifier. The input of this step is the predicted class labels of the testing documents from the classification step and the actual associated class labels. The performance of a classifier is evaluated according to the results of comparing the predicted class labels with the actual labels.
Usage phase
The classifier in this phase is successfully trained, tested and evaluated and ready for classification of new data whose class labels are unknown as shown in Figure 4.

Figure 4: Usage Phase
Experiment Results
Dataset and setup considerations
The experiment is carried out using (20-Newgroups) collected by Ken Lang. It has become one of the standard corpora for text classification. 20 newsgroups dataset is a collection of 19,997 newsgroup document which are taken from Usenet news, partitioned across 20 different categories. The training dataset consists of 11998 samples, 60% of which is training, the rest 40% is used for testing the classifier. Table 1 presents the used environment properties. Experimental Environment characteristics are shown in Table 1.
| OS | Windows 7 |
| CPU | Core(TM) I7-3630 |
| RAM | 8.00 GB |
| Language | Python |
Table 1: Experimental environment
Superiority of using the multinomial naive bayes MNB with TFIDF than KNN: In this section, we have investigated the compatibility's effectiveness of our choice of combining the TFIDF weight with multinomial naive bayes (MNB) and compare it with combining the same weight algorithm with KNN [13] for classifying the unstructured text documents. Performance is evaluated in terms of Accuracy, Precision, Recall and F-score for all the documents as shown in Table 2 and Figure 5. Run time for both MNB and KNN with TFIDF is presented in Figure 6. Accuracy, Precision, Recall and F-score for each category in both techniques are illustrated in Table 3.
| Results | MNB-TFIDF | KNN-TFIDF |
|---|---|---|
| Accuracy | 0.87 | 0.71 |
| Precision | 0.88 | 0.72 |
| Recall | 0.87 | 0.71 |
| F1-Score | 0.87 | 0.71 |
| Time | 0.44 (ms) | 18.99 (ms) |
Table 2: Accuracy, precision, recall and F-measure of both approaches

Figure 5: Comparison of performance results for using both KNN and Multinomial Naive bayes(MNB)with TF-IDF

Figure 6: Runtime for both KNN and MNB with TFIDF
| Cat | No. of docs | Precision | Recall | F1-score | |||
|---|---|---|---|---|---|---|---|
| KNN | MNB | KNN | MNB | KNN | MNB | ||
| Cat.0 | 278 | 0.59 | 0.66 | 0.81 | 0.94 | 0.68 | 0.78 |
| Cat.1 | 287 | 0.53 | 0.88 | 0.57 | 0.76 | 0.55 | 0.81 |
| Cat.2 | 305 | 0.58 | 0.90 | 0.71 | 0.93 | 0.64 | 0.91 |
| Cat.3 | 320 | 0.60 | 0.85 | 0.54 | 0.87 | 0.57 | 0.86 |
| Cat.4 | 288 | 0.63 | 0.88 | 0.63 | 0.92 | 0.63 | 0.90 |
| Cat.5 | 315 | 0.79 | 0.98 | 0.62 | 0.82 | 0.69 | 0.89 |
| Cat.6 | 297 | 0.58 | 0.93 | 0.52 | 0.79 | 0.55 | 0.86 |
| Cat.7 | 322 | 0.74 | 0.93 | 0.70 | 0.89 | 0.72 | 0.91 |
| Cat.8 | 298 | 0.85 | 0.96 | 0.79 | 0.94 | 0.82 | 0.95 |
| Cat.9 | 278 | 0.74 | 0.95 | 0.78 | 0.96 | 0.76 | 0.95 |
| Cat.10 | 287 | 0.77 | 0.91 | 0.83 | 0.98 | 0.80 | 0.94 |
| Cat.11 | 308 | 0.82 | 0.93 | 0.86 | 0.96 | 0.84 | 0.95 |
| Cat.12 | 288 | 0.71 | 0.58 | 0.60 | 0.86 | 0.65 | 0.86 |
| Cat.14 | 318 | 0.85 | 0.97 | 0.67 | 0.83 | 0.75 | 0.90 |
| Cat.15 | 286 | 0.82 | 0.90 | 0.80 | 0.98 | 0.81 | 0.94 |
| Cat.16 | 282 | 0.94 | 0.77 | 0.97 | 1 | 0.96 | 0.87 |
| Cat.17 | 308 | 0.73 | 0.78 | 0.79 | 0.95 | 0.76 | 0.86 |
| Cat.18 | 312 | 0.83 | 0.94 | 0.90 | 0.95 | 0.87 | 0.95 |
| Cat.19 | 304 | 0.64 | 0.78 | 0.70 | 0.81 | 0.67 | 0.79 |
| Cat.20 | 319 | 0.62 | 0.80 | 0.51 | 0.36 | 0.56 | 0.50 |
Table 3: performance measures for each category in the testing data set for both KNN and Multinomial Naive bayes (MNB) with TF-IDF
The compatibility of selecting the previous evaluated choice (MNB-TFIDF) with the Chi square as the selected technique for feature selection phase in the proposed model
This section measures the selecting of the CHi-square (χ2) technique for applying in feature selection phase, through illustrating its capability for improving the performance of the previous evaluated MNB-TFIDF technique as shown in table 4 and Figure 7 that present Accuracy, Precision, Recall and F-score for all the documents before and after χ2 and the associated runtimes in Figure 8.
| Results | MNB-TFIDF | MNB-TFIDF+χ2 |
|---|---|---|
| Accuracy | 0.87 | 0.91 |
| Precision | 0.88 | 0.92 |
| Recall | 0.87 | 0.91 |
| F1-Score | 0.87 | 0.92 |
| Time | 0.46 (ms) | 0.02 (ms) |
Table 4: Accuracy, precision, recall and F-measure of both approaches

Figure 7: Comparison of performance results for using (MNBTFIDF) with x2 using the proposed model

Figure 8: Runtime comparison for MNB-TFIDF with/without Chi
The evaluation of the proposed model: Evaluating the whole model through the precision, recall, f1-score performance measures for each category in the testing data set as shown in Table 5.
| No. of docs | Precision | Recall | F1-score | |
|---|---|---|---|---|
| Cat. 0 | 278 | 0.69 | 0.79 | 0.73 |
| Cat. 1 | 287 | 0.92 | 0.91 | 0.91 |
| Cat. 2 | 305 | 0.94 | 0.96 | 0.95 |
| Cat. 3 | 320 | 0.86 | 0.95 | 0.90 |
| Cat. 4 | 288 | 0.96 | 0.95 | 0.96 |
| Cat. 5 | 315 | 0.94 | 0.90 | 0.92 |
| Cat. 6 | 297 | 0.98 | 0.97 | 0.97 |
| Cat. 7 | 322 | 0.96 | 0.97 | 0.96 |
| Cat. 8 | 298 | 1 | 0.96 | 0.98 |
| Cat. 9 | 278 | 1 | 0.97 | 0.99 |
| Cat. 10 | 287 | 0.98 | 0.99 | 0.99 |
| Cat. 11 | 308 | 0.98 | 0.96 | 0.97 |
| Cat. 12 | 288 | 0.94 | 0.90 | 0.92 |
| Cat. 13 | 318 | 0.93 | 0.96 | 0.95 |
| Cat. 14 | 286 | 0.98 | 0.99 | 0.99 |
| Cat. 15 | 282 | 0.97 | 1 | 0.98 |
| Cat. 16 | 308 | 0.81 | 0.97 | 0.88 |
| Cat. 17 | 312 | 0.92 | 0.92 | 0.92 |
| Cat. 18 | 304 | 0.84 | 0.70 | 0.77 |
| Cat. 19 | 319 | 0.72 | 0.59 | 0.65 |
Table 5: performance measures for each category in the testing data set
Capability of the model to work with other techniques: This part of the evaluation proves the capability of the model for improving the quality of other classification techniques as in Tables 6 and 7 and Figures 9 and 10.
| Results | KNN-TFIDF | KNN-TFIDF using the model |
|---|---|---|
| Accuracy | 0.71 | 0.89 |
| Precision | 0.72 | 0.89 |
| Recall | 0.71 | 0.89 |
| F1-Score | 0.71 | 0.89 |
| Time | 0:00:33.681047 | 0:00:10.93001 |
Table 6: Accuracy, Precision, Recall and F-measure of both approaches.
| Cat | No. of docs | Precision | Recall | F1-score | |||
|---|---|---|---|---|---|---|---|
| with | without | with | without | with | without | ||
| Cat.0 | 278 | 0.64 | 0.59 | 0.80 | 0.81 | 0.71 | 0.68 |
| Cat.1 | 287 | 0.89 | 0.53 | 0.89 | 0.57 | 0.89 | 0.55 |
| Cat.2 | 305 | 0.92 | 0.58 | 0.95 | 0.71 | 0.93 | 0.64 |
| Cat.3 | 320 | 0.90 | 0.60 | 0.96 | 0.54 | 0.93 | 0.57 |
| Cat.4 | 288 | 0.96 | 0.63 | 0.94 | 0.63 | 0.95 | 0.63 |
| Cat.5 | 315 | 0.94 | 0.79 | 0.88 | 0.62 | 0.91 | 0.69 |
| Cat.6 | 297 | 0.95 | 0.58 | 0.95 | 0.52 | 0.95 | 0.55 |
| Cat.7 | 322 | 0.93 | 0.74 | 0.95 | 0.70 | 0.94 | 0.72 |
| Cat.8 | 298 | 0.99 | 0.85 | 0.92 | 0.79 | 0.95 | 0.82 |
| Cat.9 | 278 | 0.91 | 0.74 | 0.94 | 0.78 | 0.92 | 0.76 |
| Cat.10 | 287 | 0.97 | 0.77 | 0.97 | 0.83 | 0.97 | 0.80 |
| Cat.11 | 308 | 0.96 | 0.82 | 0.90 | 0.86 | 0.93 | 0.84 |
| Cat.12 | 288 | 0.90 | 0.71 | 0.91 | 0.60 | 0.91 | 0.65 |
| Cat.14 | 318 | 0.89 | 0.85 | 0.91 | 0.67 | 0.90 | 0.75 |
| Cat.15 | 286 | 0.96 | 0.82 | 0.95 | 0.80 | 0.96 | 0.81 |
| Cat.16 | 282 | 0.97 | 0.94 | 0.99 | 0.97 | 0.98 | 0.96 |
| Cat.17 | 308 | 0.82 | 0.73 | 0.86 | 0.79 | 0.84 | 0.76 |
| Cat.18 | 312 | 0.94 | 0.83 | 0.89 | 0.90 | 0.92 | 0.87 |
| Cat.19 | 304 | 0.72 | 0.64 | 0.72 | 0.70 | 0.72 | 0.67 |
| Cat.20 | 319 | 0.68 | 0.62 | 0.58 | 0.51 | 0.63 | 0.56 |
Table 7: Performance measures for each category in the testing data set for both KNN-TFIDF with and without the proposed model

Figure 9: Comparison of performance results for using another technique with and without the proposed model

Figure 10: Runtime Comparison for KNN with and without the model
Conclusions
In this paper, we present a model for text classification that depicts the stream of phases through building automatic text document classifier and presenting the relationship between them. Evaluation of the proposed model was performed on 20- Newgroups dataset. The experiment results confirmed that firstly, superiority of using the Multinomial Naive bayes with TFIDF than K-nearest neighbour as an approach for text document classification. The proposed model demonstrates that the proposed choice of embedded techniques in the model gave better results, improved the classification process performance, and confirmed our concept of the compatibility between the selected techniques of various phases. Finally, despite the proposed model performance is better, according to the selected embedded techniques, it can improve the performance of other techniques as shown in the last section of the experimental results, since the accuracy of KNN-TFIDF [13] could be improved using the proposed model from 71% to 76%. Therefore, our model is extendable for using by other approaches.
Future work
The proposed model provides the ability to upgrade through studying many further compatible combinations of classification techniques with different term weighting schemas and feature selection techniques for better performance.
References
- Chakrabarti S, Roy S, Soundalgekar MV (2011) Fast and accurate text classification via multiple linear discriminant projection. Int J Software Engineering and Its Applications 5: 46.
- Han EH, Karypis G, Kumar V (1999) Text categorization using weight adjusted k-nearest neighbour classification, Department of Computer Science and Engineering. Army HPC Research Center, University of Minnesota.
- McCallum A, Nigam K (2003) A comparison of event models for naive Bayes text classification. J Machine Learning Res 3: 1265-1287.
- Quinlan JR (1993) C4.5: programs for machine learning, Morgan Kaufmann Publishers Inc, San Francisco.
- Wermter S (2004) Neural network agents for learning semantic text classification. Information Retrieval 3: 87-103.
- Nigam K, Lafferty J, McCallum A (1999) Using maximum entropy for text classification. In Proceedings: IJCAI-99 Workshop on Machine Learning for Information Filtering 61-67.
- Dalal MK, Zaveri MA (2011) Automatic Text Classification: A Technical Review. Int J Comp App 28: 0975-8887.
- Bolaj P, Govilkar S (2016) A Survey on Text Categorization Techniques for Indian Regional Languages. Int J Comp Sci Inform Technol 7: 480-483.
- Jain U, Saini K (2015) Punjabi Text Classification using Naive Bayes Algorithm. Int J Curr Engineering Technol 5.
- Tilve AKS, Jain SN (2017) Text Classification using Naive Bayes, VSM and POS Tagger. Int J Ethics in Engineering & Management Education 4: 1.
- Gogoi M, Sharma SK (2015) Document Classification of Assamese Text Using Naïve Bayes Approach. Int J Comp Trends Technol 30: 4.
- Rajeswari RP, Juliet K, Aradhana (2017) Text Classification for Student Data Set using Naive Bayes Classifier and KNN Classifier. Int J Comp Trends Technol 43: 1.
- Trstenjak B, Mikac S, Donko D (2014) KNN with TF-IDF based Framework for Text Categorization. Procedia Engineering 69: 1356-1364.
- Grobelnik M, Mladenic D (2004) Text-Mining Tutorial in the Proceeding of Learning methods for Text Understanding and Mining. pp: 26-29.
- Vector space method (2017) Available at: en.wikipedia.org/wiki/Vector_space.
- Thaoroijam K (2014) A Study on Document Classification using Machine Learning Techniques. Int J Comp Sci Issues 11: 1.
- Wang D, Zhang H, Liu R, Lv W, Wang D (2014) t-Test feature selection approach based on term frequency for text categorization. Pattern Recognition Letters 45: 1-10.
- Raschka S (2014) Naive Bayes and Text Classification I-Introduction and Theory.
- Pop L (2006) An approach of the Naïve Bayes classifier for the document classification. General Mathematics 14: 135-138.


Open Access Journals
- Aquaculture & Veterinary Science
- Chemistry & Chemical Sciences
- Clinical Sciences
- Engineering
- General Science
- Genetics & Molecular Biology
- Health Care & Nursing
- Immunology & Microbiology
- Materials Science
- Mathematics & Physics
- Medical Sciences
- Neurology & Psychiatry
- Oncology & Cancer Science
- Pharmaceutical Sciences