ISSN : 2393-8862
American Journal of Pharmacology and Pharmacotherapeutics
A NEW RP-HPLC METHOD DEVELOPMENT AND VALIDATION OF ENSITRELVIR IN ITS PURE AND FORMULATION
1Department of Pharmaceutics, Surabhi Dayakar Rao College of Pharmacy, Rimmanaguda, Telangana, India.
2Bpharmacy Student,Surabhi Dayakar Rao College of Pharmacy, Rimmanaguda, Telangana, India
- Corresponding Author:
- Archana Terala
Department of Pharmaceutics
Surabhi Dayakar Rao College of Pharmacy
Rimmanaguda, Telangana, India
E-mail: archanaellendula359@gmail.com
Received: 30 May, 2026, Manuscript No. ipapp-26-21149; Editor assigned: 01 June, 2026, PreQC No. P-21149; Reviewed: 15 June, 2026, QC No. Q-21149; Revised: 26 June, 2026, Manuscript No. R-21149; Published: 04 July, 2026, DOI: 10.36648/2393-8862.12.3.125
Citation: Terala A, Bandi Shravani B, Bhuvana N, Sowjanya Ch, Begum S. (2026) A New Rp-Hplc Method Development and Validation Of Ensitrelvir In Its Pure And Formulation. Am J Pharmacol PharmacotherVol. 12 No. 3: 125
Copyright: © 2026 Terala A, et al. This is an open-access article distributed under the terms of the Creative Commons Attribution License, which permits unrestricted use, distribution, and reproduction in any medium, provided the original author and source are credited.
Abstract
For the quantitative analysis of Ensitrelvir in bulk and pharmaceutical formulations, a simple, accurate, and dependable reverse-phase high-performance liquid chromatography (RP-HPLC) technique was effectively created and validated. Retention time was around 9.6 minutes using a chromatographic separation with a PLATISIL C18-EP column and a mobile phase of acetonitrile and triethylamine buffer (pH 4.0) in a 60:40 ratio. The approach showed appropriate system appropriateness criteria, including a tailing factor of 1.28 and a theoretical plate count of ~4883, therefore verifying effective separation and peak symmetry. Performed in compliance to ICH criteria, validation investigations revealed great linearity (20â??100 µg/mL, R² = 0.999), high precision (RSD < 2%), and accuracy with recovery levels ranging from 98â??102%. Sensitivity was demonstrated with LOD and LOQ levels of 0.1 µg/mL and 0.38 µg/mL, respectively. Robustness studies showed that small changes in chromatographic settings had little impact on method performance. All in all, the created RP-HPLC technique is appropriate for routine quality control analysis of Ensitrelvir in bulk and pharmaceutical formulations since it is accurate, exact, sensitive, strong, and reproducible.
Keywords
Ensitrelvir, RP-HPLC, Method development, Validation, ICH guidelines, Quality control, Sensitivity, Robustness
Introduction
The creation, quality control, and regulatory approval of therapeutic substances and pharmaceutical dosage forms depends on pharmaceutical analysis. It involves determining a drug's identity, stability, strength, and purity using analytical techniques. The fast advancement of pharmaceutical sciences has made the need for accurate, reliable, and precise analytical methods more critical. Analytical technique development and validation are crucial components of drug development in order to guarantee that pharmaceutical products meet rigorous quality standards and comply with regulatory regulations. New analytical methods must be developed when current methods are inadequate or unavailable for newly introduced drugs. These methods must be trustworthy, reproducible, and capable of detecting even trace quantities of pollutants or breakdown products. Because of its adaptability, accuracy, and sensitivity, HPLC is one of the most widely used analytical methods available. [1, 2, 3, 4, 5]
The most popular HPLC technique is known as reverse phase high-performance liquid chromatography (RP-HPLC). In RP-HPLC, the mobile phase is relatively polar, while the stationary phase is non-polar (typically C18 columns). This method is ideal for estimating a wide range of therapeutic drugs since it is particularly effective at analyzing moderately polar to non-polar compounds (Figure 1).

Figure 1: Stucture of Ensitrelvir.
Molecular Formula: C22H17ClF3N9O2 [6]
Molecular Weight: 531.88 g•mol [6, 7]
IUPAC Name: 6-chloro-3-[(1-methyl-1H-1,2,4-triazol-3-yl)methyl]-N-[(1S)-1-(2,4,5-trifluorophenyl)-2-oxoethyl]-1H-indazole-5-carboxamide [8, 6]
Generic Name: Ensitrelvir [6]
Brand Names: Xocova [9]
Drug Category: Antiviral agent (SARS-CoV-2 protease inhibitor) [6, 9]
Indications: Treatment of COVID-19 (mild to moderate cases) [10, 8]
Pharmacology: Blocks viral polyprotein processing, reducing viral load [6]
Mechanism of action:
Inhibits SARS-CoV-2 main protease (3CLpro), preventing viral replication [6, 9]
Tolerability: Generally, well tolerated in clinical trials [6, 9]
Adverse Effects: Decreased HDL, increased triglycerides, headache, diarrhea [11]
Availability: Oral tablets (Ensitrelvir fumarate) [11]
Significance of the study
As a newly introduced antiviral agent, Ensitrelvir lacks extensively validated analytical methods in the literature. Existing methods, if any, may not be optimized for routine quality control or may involve complex procedures.
Therefore, there is a significant need to develop a simple, rapid, accurate, and cost-effective RP-HPLC method for the estimation of Ensitrelvir in both pure form and pharmaceutical formulations. The method should be capable of:
• Providing accurate quantification of the drug
• Separating the drug from excipients and degradation products
• Ensuring reproducibility and robustness
• Reducing analysis time and solvent consumption
• Such a method would be highly beneficial for pharmaceutical industries, research laboratories, and regulatory agencies. [11–13]
Ensitrelvir, also known as LOXO-305, is a novel medication designed to treat certain types of blood cancers, such as mantle cell lymphoma (MCL), chronic lymphocytic leukemia (CLL), and small lymphocytic lymphoma (SLL). It belongs to a class of drugs known as kinase inhibitors and works by inhibiting Bruton's tyrosine kinase (BTK), a key enzyme in B cell stimulation and survival. [12, 13]
This drug is particularly significant because it offers a new hope for patients who are resistant to covalent BTK inhibitors (cBTKis), which are the standard-of-care for multiple B-cell malignancies. Ensitrelvir binds noncovalently to BTK, which allows it to overcome resistance mutations that affect other BTK inhibitors. [12, 13]
It was approved for medical use in the United States in January 2023 and in the European Union in November 2023. The medication is taken orally and has shown a favorable toxicity profile, making it suitable for use in combination with other treatments. [13, 10]
wavelength the drug shows good absorbance
Instrumentation: An auto sampler equipped Reverse Phase High performance liquid chromatography (WATERS), UV/VIS Spectrophotometer was provided by LABINDIA, pH was measured by the pH meter (AD 1020, Adwa Instruments) Calibrated Weighing machine (Afcoset ER -200A), Pipettes, burettes and beakers were used throughout the study.
Chemicals and reagents: Ensitrelvir was supplied by MSN Lab, KH2PO4 was supplied by FINAR chemical LTD, Water, Methanol and Acetonitrile for HPLC was provided by Standard solutions ltd and Hcl, H2O2, NaOH were provided by MERCK.
For wavelength selection UV spectrum of 10 µg / ml Ensitrelvir in diluent (mobile phase composition) was recorded by scanning in the range of 200nm to 400nm.From the UV spectrum wavelength selected as 228nm. At this wavelength both the drug shows good absorbance.
System suitability:
The tailing factor for the Ensitrelvir peaks in the standard solution should not be more than 2.0.The number of theoretical plates for the Ensitrelvir peaks in the standard solution should not be less than 2000.
Calculation: (For Ensitrelvir)
Where:
AT = average area counts from the sample preparation.
AS = average area counts from the standard preparation.
WS = weight of the working standard in mg.
P = percentage purity of the working standard.
LC = label claim in mg/ml.
Optimized Chromatographic Conditions
Chromatographic separation of Ensitrelvir was achieved using the PLATSIL C18-EP column (4.6 x 250mm, 5µm) with a mobile phase consisting of Acetonitrile and Triethylamine pH 4 in a 60:40 ml ratio.
The mobile phase is filtered and degassed before use. The flow rate of the mobile phase is 1 ml/min, and the analysis time is 15 minutes.
Preparation of Standard Solution
Accurately weigh 25 mg of Ensitrelvir working standard and transfer it into a 25 ml clean, dry volumetric flask.
Add the diluent and sonicate until the working standard is completely dissolved. Then, make up the volume to the mark with the same solvent. (This is the stock solution.)
Linearity
Take 25 mg of Ensitrelvir working standard and accurately weigh it into a clean, dry 25 ml volumetric flask.
Add diluents and sonicate to dissolve the standard completely, then fill the flask to the mark with the same solvent. This is the stock solution. From the stock solution, take 0.2 ml, 0.4 ml, 0.6 ml, 0.8 ml, and 1 ml into separate 10 ml volumetric flasks.
Dilute each to the mark with diluents to prepare solutions with concentrations of 20, 40, 60, 80, and 100 ppm of Ensitrelvir. Inject each of these solutions into the chromatographic system and record the peak areas.Plot a graph with concentration on the X-axis and peak area on the Y-axis.
Calculate the correlation coefficient from the graph.
Precision
Precision refers to the degree of repeatability of an analytical method under normal conditions.It is usually expressed as a percentage of relative standard deviation (% RSD). Precision includes three aspects: repeatability, reproducibility, and intermediate precision. [14, 15, 16] To test precision, take 0.6 ml of the stock solution and dilute it to 10 ml with diluents (Figure 2).
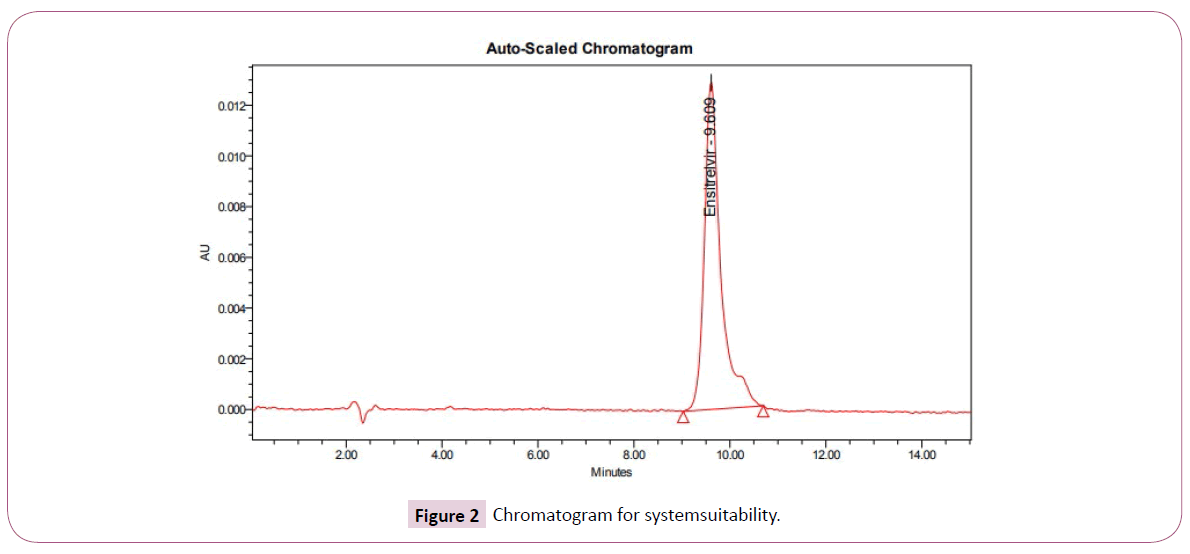
Figure 2: Chromatogram for systemsuitability.
Procedure
Inject the standard solution six times into the HPLC system and measure the peak area for each injection.
The %RSD for the six replicate injections was found to be within the acceptable limits.
Accuracy
For accuracy determination, three different concentrations were prepared separately i.e. 50%, 100% and 150% for the analyte and chromatograms are recorded for the same.
Preparation of standard stock solution
Accurately weigh and transfer 25 mg of Ensitrelvir working standard into a 25 ml clean dry volumetric flask add Diluents and sonicate to dissolve it completely and make volume up to the mark with the same solvent. (Stock solution) Further pipette 0.6ml of the above stock solution into a 10ml volumetric flask and dilute up to the mark with Diluents.
Preparation of Sample solutions
3 sample solutions corresponding to 50%, 100% and 150% were prepared. Accurately weigh 12.5mg, 25mg, 37.5mg of working standard into 25 ml clean dry volumetric flask, add diluents and subject it to sonication to dissolve the solids completely and make up the volume to the mark with stock solution. Further pipette out 0.6 ml of above stock solution into a 10ml volumetric flask and dilute up to the mark with diluents.
Limit of Detection (LOD)
LOD is the lowest concentration of an analyte that can be detected but not necessarily quantified. It is defined based on a specific signal to noise ratio. LOD depends on both the analysis method and the instrument used. In chromatography, the LOD is determined by the amount injected that results in a peak with a height at least twice or three times the baseline noise level. Signal to noise ratio is 2:1 or 3:1.
Limit of Quantification (LOQ)
LOQ is the lowest concentration of an analyte that can be reliably quantified with acceptable precision and accuracy using a specific method under given experimental conditions.
The usual method involves analyzing samples with decreasing known amounts of the analyte and identifying the lowest level where acceptable accuracy is achieved.
LOQ is also based on a specific signal to noise ratio.
In chromatography, it is the injected amount that results in a peak with a height ten times the base line noise level. [17, 18]
Signal to noise ratio is 10:1.S/N=10/1
Ruggedness
This refers to how consistently test results can be obtained when the same sample is analyzed under different normal test conditions, such as using different analysts, instruments, days, reagents, columns, and TLC plates.[18]
Robustness
This measures how well an analytical method can handle small, intentional changes in the procedure without affecting the results. It shows how reliable the method is under normal lab conditions. [17-19]
Results and Discussion
Various trials were performed by varying the combination, proportion of mobile phase. After observing the chromatogram of different mobile phase no peaks were detected in the location of Ensitrelvir, which clearly represents that the excipients mixture did not interfere with the exact determination of the analyte in the accuracy assay, proving the specificity and selectivity of the method (Table 1).
| Trial | Mobile Phase | Proportion |
|---|---|---|
| Trial -1 | Methanol: KH2PO4 PH: 4 | 60:40 |
| Trial -2 | Methanol: KH2PO4 PH: 4 | 70:30 |
| Trial -3 | Methanol: KH2PO4 PH: 4 | 50:50 |
| Trial -4 | Methanol: KH2PO4 PH: 4 | 70:30 |
| Trial -5 | Methanol: KH2PO4 PH: 4 | 60:40 |
| Trial -6 | Acetonitrile: TriethylaminePH: 4 | 50:50 |
| Trial -7 | Acetonitrile: Triethylamine PH: 4 | 70:30 |
Table 1 Different mobile phase used.
Linearity
The linearity range was found to lie from 10µg/ml to 50µg/ml of Ensitrelvir, results are tabulated below (Figure 3).
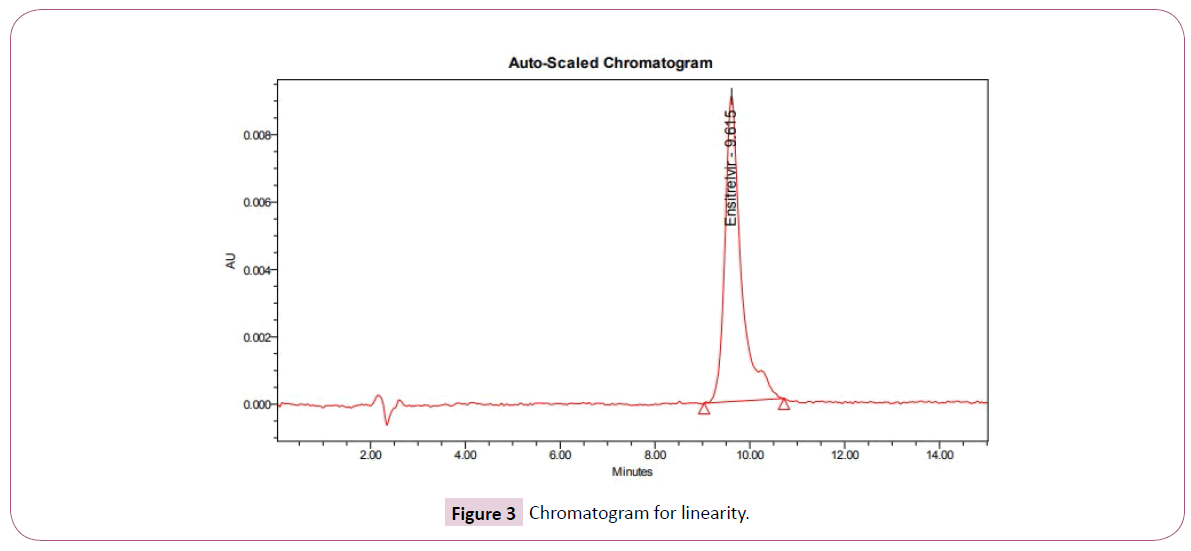
Figure 3: Chromatogram for linearity.
Precision
Precision of the method was carried out for both sample solutions as described under experimental work. The corresponding chromatograms and results are shown below.
Acceptance criteria
• % RSD for sample should be NMT 2
• The %RSD for the standard solution is below 1, which is within the limits hence method is precise (Table 2).
| S.No | Name | RT(min) | Area(µVsec) | Height(µV) | USP tailing | USP Plate count |
|---|---|---|---|---|---|---|
| 1 | Ensitrelvir | 9.609 | 308314 | 12899 | 1.28 | 4883 |
Table 2 Results of system suitability parameters.
Accuracy
Sample solutions at different concentrations (50%, 100%, and 150%) were prepared and the % recovery was calculated (Table 3).
| S.No | Ensitrelvir | |
|---|---|---|
| 1 | Concentration(µg/ml) | Area |
| 2 | 20 | 102771 |
| 3 | 40 | 205542 |
| 4 | 60 | 308314 |
| 5 | 80 | 411085 |
| 6 | 100 | 503856 |
Table 3 Area of different concentration of ensitrelvir.
Acceptance Critera
The percentage recovery was found to be within the limit (98-102%).The results obtained for recovery at 50%, 100%, 150% are within the limits. Hence method is accurate (Figure 4-8).
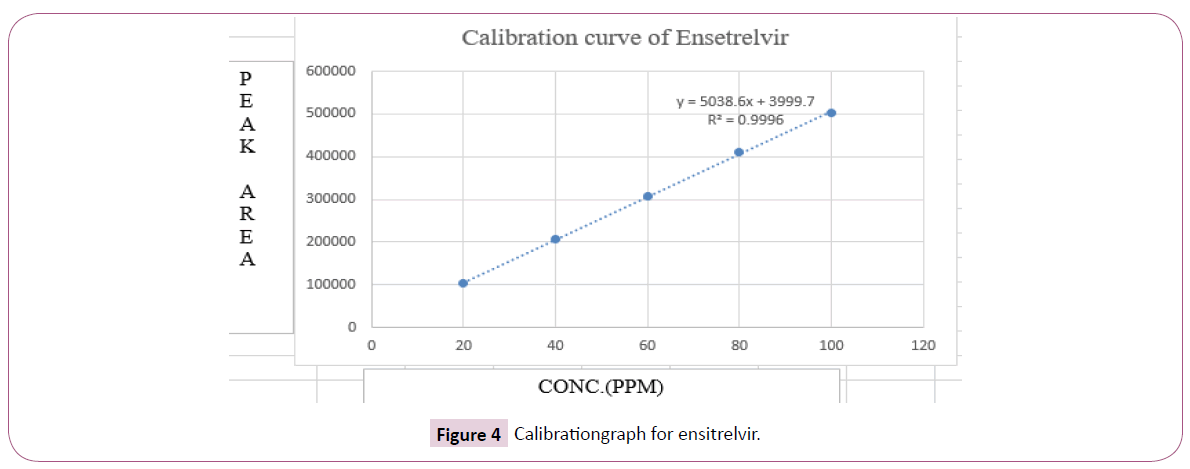
Figure 4: Calibrationgraph for ensitrelvir.
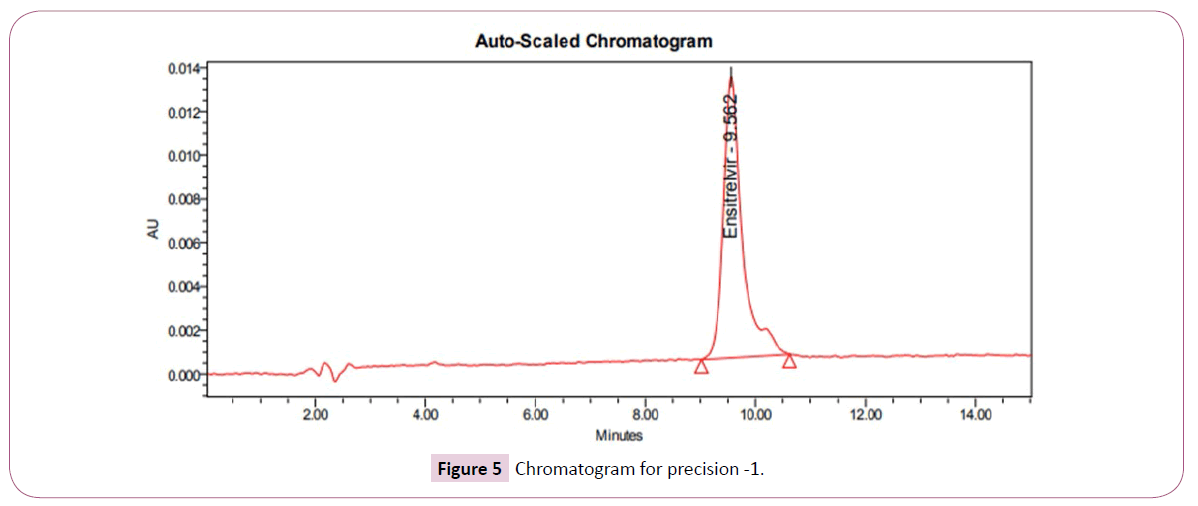
Figure 5: Chromatogram for precision -1.
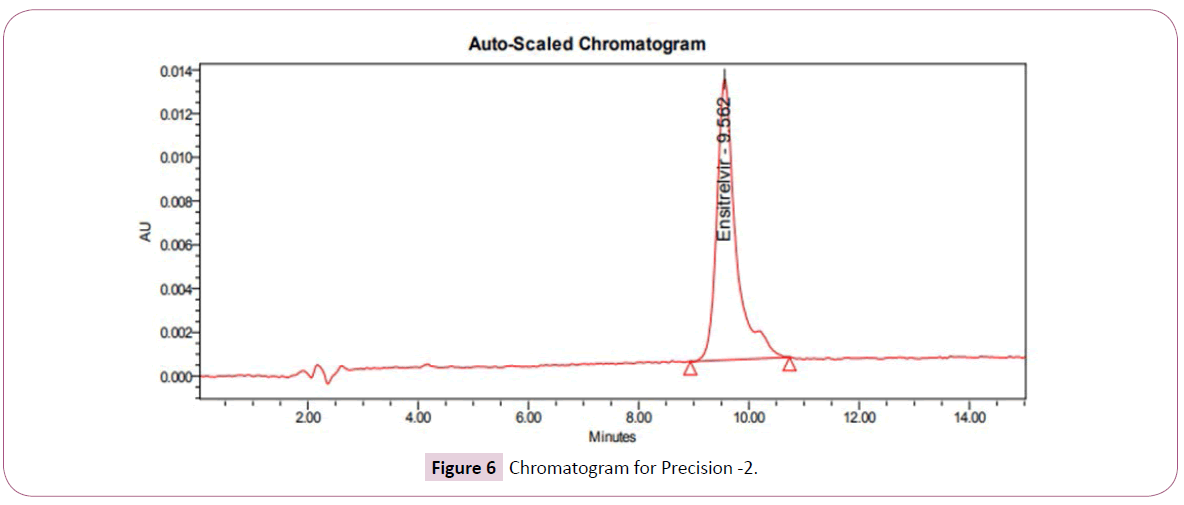
Figure 6: Chromatogram for Precision -2.
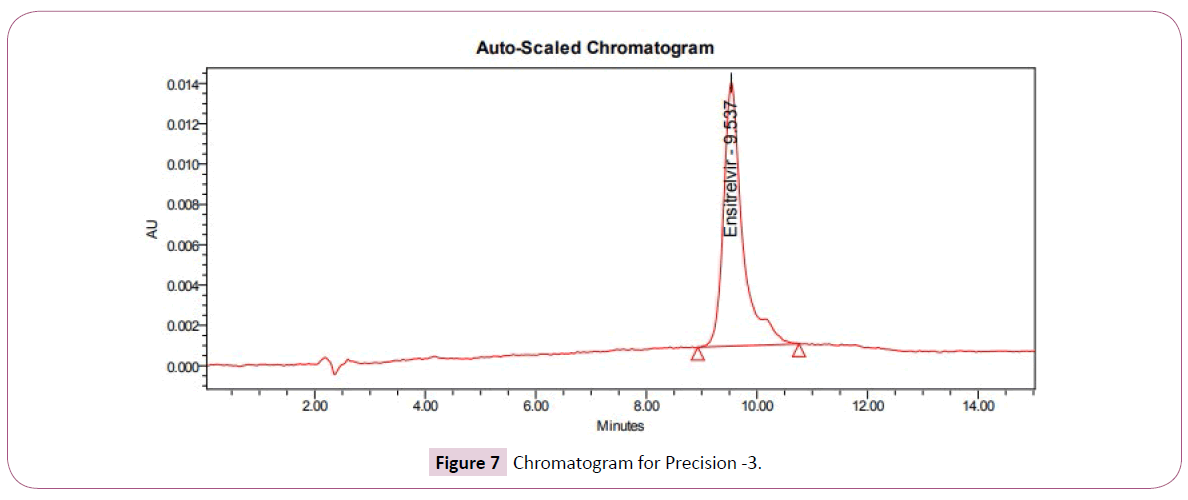
Figure 7: Chromatogram for Precision -3.
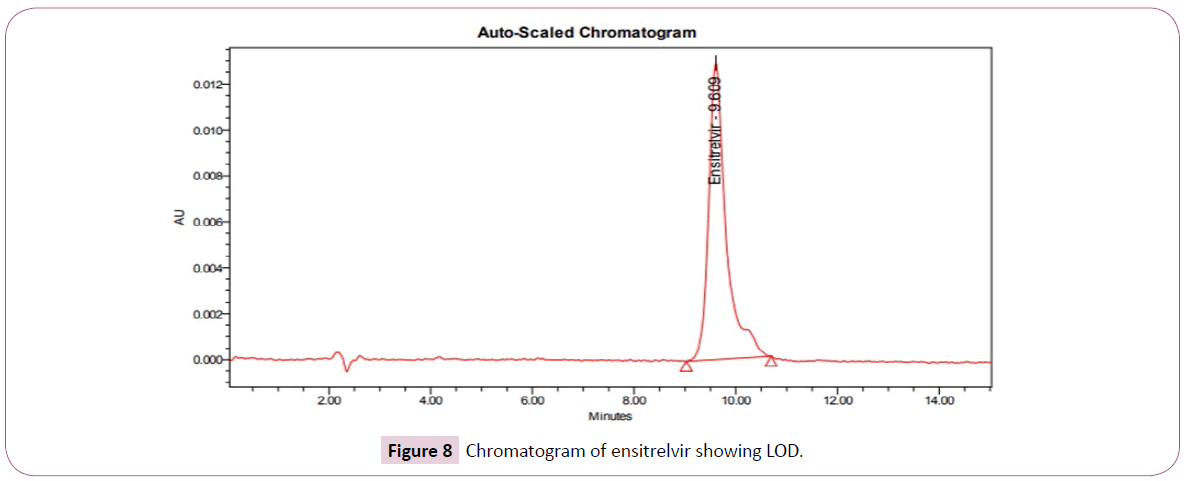
Figure 8: Chromatogram of ensitrelvir showing LOD.
Limit of detection for ensitrelvir
The lowest concentration of the sample was prepared with respect to the base line. The ratio of signal to noise was measured (Table 4,5).
| Average Area | Standard Deviation | %RSD |
|---|---|---|
| 311305.2 | 5227.715 | 1.6 |
Table 4 Results for precision.
| %Concentration (at specification Level) | Area* | Amount Added(mg) | Amount Found(mg) | % Recovery | Mean Recovery |
|---|---|---|---|---|---|
| 50% | 154157 | 12.5 | 12.3 | 98.4 | 98.86 |
| 100% | 308314 | 25 | 24.92 | 99.68 | |
| 150% | 462471 | 37.5 | 36.95 | 98.5 |
Table 5 Results for accuracy.
Limit of quantifictaion for ensitrelvir
The lowest concentration of the sample was prepared with respect to the baseline noise and measured the signal to noise ratio (Table 6,7) and (Figure 9).
| Drug name | Base Line noise (µV) | Signal obtained (µV) | S/N ratio | CONC. |
|---|---|---|---|---|
| Ensitrelvir | 83 | 246 | 2.96 | 0.1µg/ml |
Table 6 Results of LOD
| Drug name | Base Line noise(µV) | Signal Obtained(µV) | S/N ratio | CONC. |
|---|---|---|---|---|
| Ensitrelvir | 83 | 828 | 9.97 | 0.38µg/ml |
Table 7 Results of LOQ
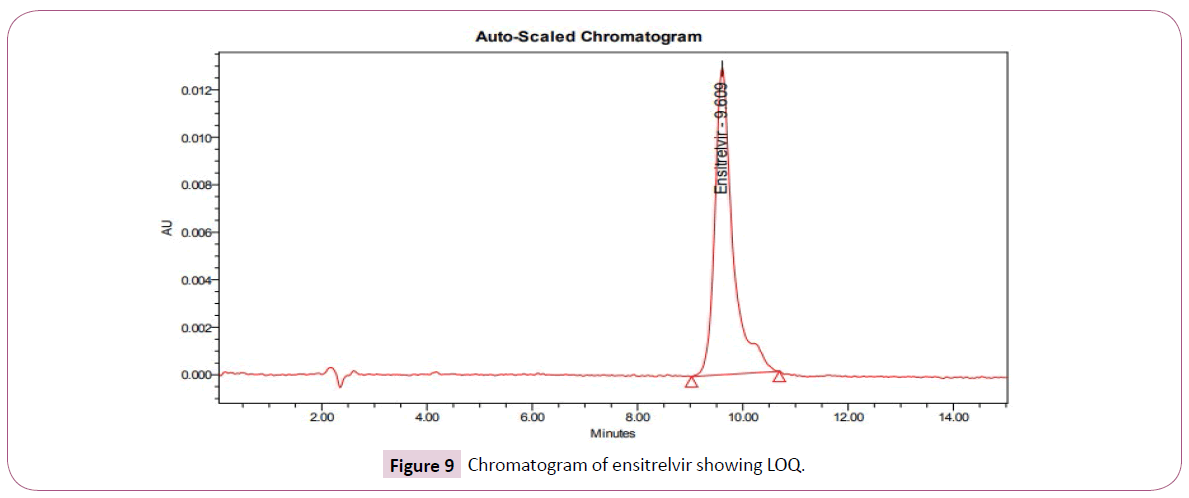
Figure 9: Chromatogram of ensitrelvir showing LOQ.
Robustness
The standard and samples of Ensitrelvir were injected. The retention time, USP plate count, and USP tailing factor were found to be within the accepted limits when there were changes in flow rate or variation in the mobile phase. This shows that the method is robust (Figure 10-11).
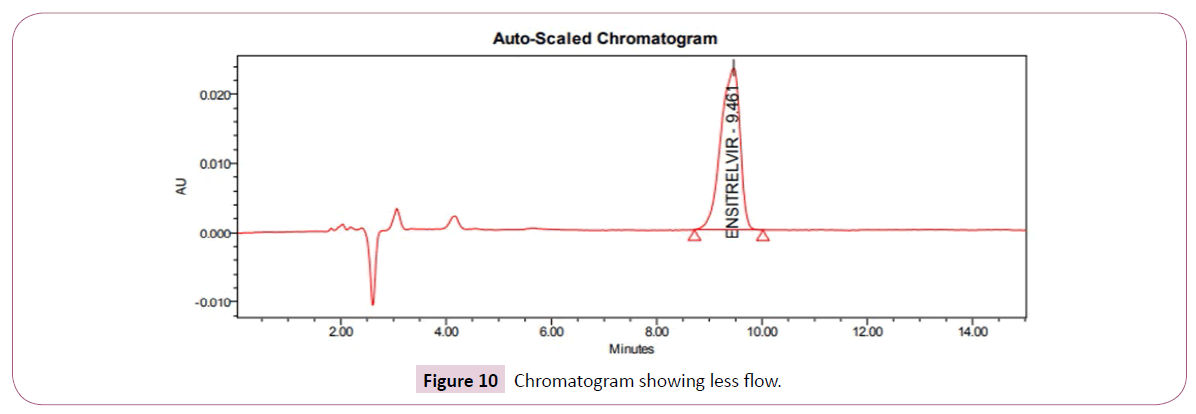
Figure 10: Chromatogram showing less flow.
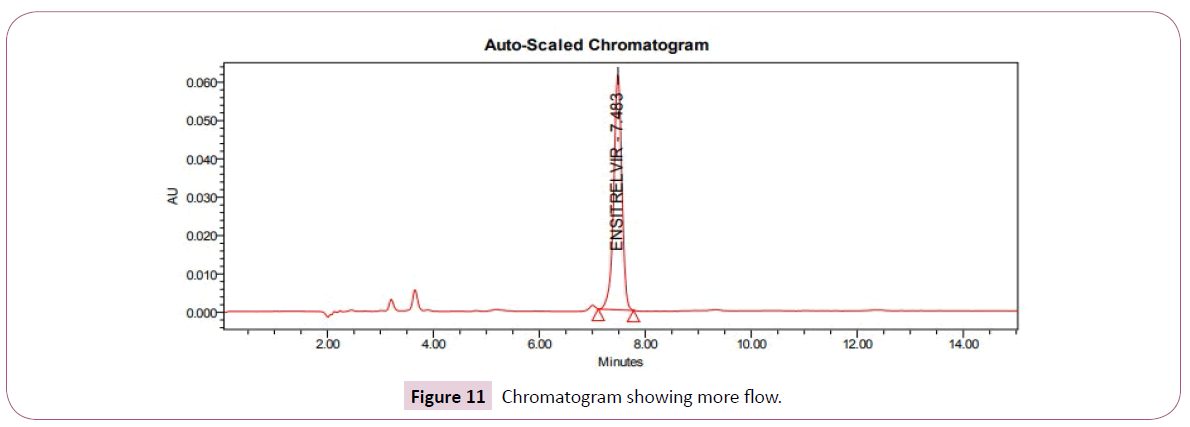
Figure 11: Chromatogram showing more flow.
Acceptance criteria
The retention time, USP plate count, and USP tailing factor were found to be within the accepted limits when there were changes in flow rate or variation in the mobile phase. This shows that the method is robust (Table 8,9) and (Figure 12).
| S.No | Flow Rate(ml/min) | System Suitability Results | |
|---|---|---|---|
| USP Plate Count | USPT ailing | ||
| 1 | 0.8 | 4876 | 1.3 |
| 2 | 1 | 4883 | 1.28 |
| 3 | 1.2 | 4889 | 1.29 |
Table 8 Results for Actual Flow (1ml/Min) Have Been Considered From Assay Standard.
| S.No | Change in Organic Composition in the Mobile Phase | System Suitability Results | |
|---|---|---|---|
| USP Plate Count | USP Tailing | ||
| 1 | 10%less(54ml) | 4880 | 1.3 |
| 2 | *Actual(60ml) | 4883 | 1.28 |
| 3 | 10%more(66ml) | 4891 | 1.29 |
Table 9 Results for Variation in Mobile Phase Composition for Ensitrelvir
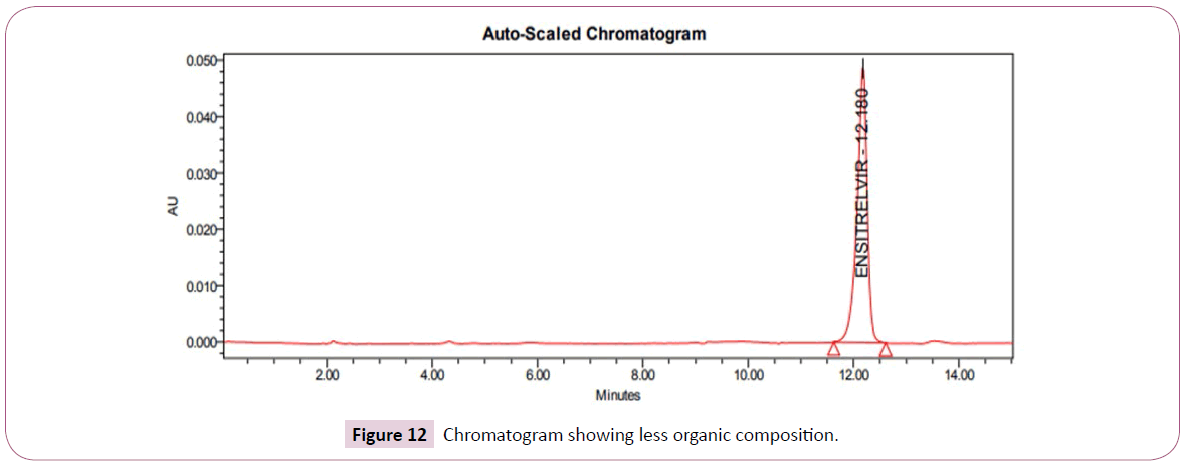
Figure 12: Chromatogram showing less organic composition.
Summary
A simple, accurate, and dependable RP-HPLC method was successfully developed for the analysis of Ensitrelvir.
The method uses a PLATISIL C18-EP column with a mobile phase made up of Acetonitrile and Triethylamine buffer (pH 4) in a 60:40 ratio. The method performed well, with a retention time of approximately 9.6 minutes, a tailing factor of 1.28, and a high theoretical plate count of around 4883, indicating effective separation. The method was validated according to ICH guidelines and showed excellent linearity in the concentration range of 20–100 µg/ml, with a correlation coefficient (R2) of 0.999. The precision studies showed %RSD values well within acceptable limits (<2%), proving the method's reproducibility. Accuracy studies showed recovery values between 98–102%, reflecting the method's reliability.
Conclusion
The developed RP-HPLC method for Ensitrelvir was found to be accurate, precise, sensitive, and robust. The LOD and LOQ values were 0.1 µg/ml and 0.38 µg/ml respectively, showing the method's high sensitivity. Robustness studies confirmed that small changes in the chromatographic conditions had little effect on the method's performance. Overall, the method is suitable for routine quality control analysis of Ensitrelvir in both bulk and pharmaceutical forms, ensuring reliable and consistent results.
References
- Snyder LR, Kirkland JJ, Dolan JW. (2011). Introduction to modern liquid chromatography. 3rd ed. Hoboken (NJ): John Wiley & Sons.
- Skoog DA, Holler FJ, Crouch SR. (1998). Principles of instrumental analysis. Philadelphia: Saunders College Publishing.
- Chatwal GR, Anand SK. (2022). Instrumental methods of chemical analysis. Mumbai: Himalaya Publishing House.
- Beckett AH, Stenlake JB. (2004). Practical pharmaceutical chemistry. New Delhi: CBS Publishers.
- Willard HH, Merritt LL Jr, Dean JA, Settle FA Jr. (1987). Instrumental methods of analysis. New Delhi: CBS Publishers & Distributors.
- Harris DC. (1987). Quantitative chemical analysis. New York: W.H. Freeman.
- International Council for Harmonization (ICH). (2005). Q2 (R1): Validation of analytical procedures: Text and methodology. Geneva.
- Kazakevich YV, Lobrutto R. (2006). HPLC for pharmaceutical scientists. Hoboken (NJ): John Wiley & Sons.
- Meyer VR. (2010). Practical high-performance liquid chromatography. Chichester: Wiley.
- Swartz ME, Krull IS. (2018). Analytical method development and validation. Boca Raton( FL): CRC Press.
- Dong MW. (2006). Modern HPLC for practicing scientists. Hoboken (NJ): John Wiley & Sons.
- Blessy M, Patel RD, Prajapati PN, Agrawal YK. (2014). Development of forced degradation and stability indicating studies of drugs—A review. J Pharm Anal 4: 159–165.
- Niwa T, Shiraki Y, Kawashima S, Fujisaki S. (2020). Discovery and development of non-covalent BTK inhibitors for B-cell malignancies. J Med Chem 63: 11252–11274.
- Keam SJ. (2023). Pirtobrutinib: First Approval. Drugs 83: 547-556.
- Food and Drug Administration (FDA). (2023). FDA approves pirtobrutinib for relapsed or refractory mantle cell lymphoma. Silver Spring (MD): FDA. [Cited 2026 Apr 10].
- European Medicines Agency. (2023). Jaypirca (pirtobrutinib): EPAR – Product information. Amsterdam: EMA. [Cited 2026 Apr 10].
- Keam SJ (2023) Pirtobrutinib: First approval. Drugs 83: 547–556.
- Eli Lilly and Company. (2023). Jaypirca (pirtobrutinib) prescribing information. Indianapolis (IN): Eli Lilly and Company. [Cited 2026 Apr 10].
- Mato AR, Shah NN, Jurczak W, Cheah CY, Pagel JM, et al. (2021). Pirtobrutinib in relapsed or refractory B-cell malignancies (BRUIN): A phase 1/2 study. Lancet 397: 892–901.
Google Scholar, Cross Ref, Indexed at
Google Scholar, Cross Ref, Indexed at
Google Scholar, Cross Ref, Indexed at
Google Scholar, Cross Ref, Indexed at
Google Scholar, Cross Ref, Indexed at
Google Scholar, Cross Ref, Indexed at
Open Access Journals
- Aquaculture & Veterinary Science
- Chemistry & Chemical Sciences
- Clinical Sciences
- Engineering
- General Science
- Genetics & Molecular Biology
- Health Care & Nursing
- Immunology & Microbiology
- Materials Science
- Mathematics & Physics
- Medical Sciences
- Neurology & Psychiatry
- Oncology & Cancer Science
- Pharmaceutical Sciences