ISSN : 0976-8505
Der Chemica Sinica
Microencapsulation of Oxolinic Acid with Chitosan Beads
Galo Cárdenas-Triviño1*, Marianela Burgos2, Carlos von Plessing3
1Facultad de Ingeniería, DIMAD, Centro de Biomateriales, Universidad del Bío-Bío, Av. Collao 1202, Concepción, CHILE. gcardenas@ubiobio.cl
2Facultad deCiencias, Universidad Católica de la Santísima Concepción.mburgos@ucsc.cl
3Departamento de Farmacia, Facultad de Farmacia, Universidad de Concepción, Chile.cvonples@udec.cl
Abstract
Chitosan microcapsules were synthesized by the method of ionic gelling. The oxolinic acid was encapsulated in chitosan microcapsules with different concentrations, which was corroborated by FT-IR bands of the capsules that are typical of chitosan and the antibiotic. The inclusion of the antibiotic in the microspheres,was determined by means of thermogravimetry since there were two decompositions temperatures corresponding to different compounds.At several concentrations of oxolinic acid chitosan microspheres had different external morphology, by means of SEM was observed that greater concentration of antibiotic exhibited a smoother external texture, being spherical most of them. The solubility of chitosan microspheres was very low in sea and nanopure water, since the protonationat basic pH of the amino group of chitosan is very low, the solubility was lower.The solubilities of chitosan with different concentrations of antibiotic micro-spheres showed a Gaussian tendency of solubility at different acid pH ranges (hydrogels). The optimum pH of solubility of chitosan spheres occured at pH 3.5, what it was observed at the maximum point of the curve.Chitosan microcapsules had different concentrations of oxolinic acid, because release of antibiotic concentration may occur and was measured by the HPLC method. The percentage of encapsulation of the microspheres was high, being all of them greater than 90%. The release of oxolinic acid on chitosan microspheres was faster at pH 5.7, since the release began from the time 1, instead at pH 7.5 was slower, since the release began after 3 times. Chitosan microcapsules had an average dry weight of 1.1 × 10⁻³ mg.
Keywords
microcapsules, chitosan, oxolinic acid, morphology, concentration
Introduction
Chile has around twenty five years of history in terms of salmon farming, time which has made progress that have given it many economic benefits. However, these achievements are accompanied by the increase of several problems, such as the emergence of fish diseases. These diseases have fought with a wide variety of chemicals and drugs. The main pathologies identified are generated mainly in the intensive culture of salmonid species, where the following bacteria associated with these diseases according to Smith [1] have been detected:
•Aeromonassalmonicida,Renibacteriumsalmoninarum, Yersinia ruckeri, Piscirickettsiasalmonis detected in 1989, associated with the syndrome salmon rickettsial.
These four species have as common property being gram-negative bacterias and as main route of infection have gills, also being either the route of entry of these pathogens, the dissemination of them occurs mainly through the bloodstream of infected fish (Smith) [1].
One of these microorganisms Piscirickettsiasalmonishas been so far the main cause of losses at the stage of fattening of the three species most important salmon in Chile, which correspond to the coho salmon, salmon trout and Atlantic Rainbow (Leal) [2]. Piscirickettsiasalmonis corresponds to the first isolated and characterized in fish rickettsia. This bacterium was initially isolated in Chile in 1989 by Fryer etal.[3], and Cvitanich et al.[4], from farming salmon affected by high mortality rates. This agent is a new species, which is taxonomically classified in provisional form in a new genus, is characterized as a bound intracellular pathogen, which multiplies by binary division, is cytopathic to different cell lines of salmonids, initially producing the formation of clusters of rounded cells and heart [3] and finally the lysis with detachment of the monolayer. Its optimal growth temperature is in the range of 15 to 18 °C, sharply reducing its replication under 10 °C and 21 °C [5]. The organism is stationary, non-encapsulated, Pleomorphic, usually coccoid, in pairs or in the form of ring and a variable size between 0.5-1.5 m in diameter. In smears of blood and tissue, the rickettsias are stained with hematoxylin-eosin (HE), Giemsa and methylene blue, was observed within cytoplasmic vacuoles surrounded by a membrane, in scattered form or groupings that give an appearance of morula, as shown in (Fig. 1) [5].

Figure 1: Culture cell infected (CHSE-214) with P. salmonisof the crop cells have cytoplasmic vacuoles in which the presence of microorganismscoccoidal is observed (demarcated in a circle) corresponding to P. salmonis
(Fig. 1). Culture cell infected (CHSE-214) with P. salmonis of the crop cells have cytoplasmic vacuoles in which the presence of microorganisms coccoidal is observed (demarcated in a circle) corresponding to P. salmonis.
The first outbreaks of the disease associated with this pathogen was presented at the end of the year 1989. It was initially described only in coho salmon (coho syndrome), to produce up to 90% mortality in some centres of culture. Initial calculations established a mortality of 1.5 million coho salmon, which accounted for an estimated 10 million dollars loss.
The disease has been described mainly in sea water and estuarine and very occasionally in fresh water. The first outbreaks were related to a period subsequent to the fluctuations in the water temperature, presence of a "bloom" of non-toxic algae and/or stress [5].
Clinical signs of this disease is characterized by a slow surface swimming, erratic and sometimes in ringlet. In addition, described lethargy, anorexia, colliding with the walls of the raft or cage, remove and darkening. The most relevant external macroscopic lesions includes: flaking, Gill pallor, ecchymotic hemorrhages and Petechial at the base of the fins, nodules and ulcers on the skin up to 2 cm in diameter. The necropsy analysis of the abdominal cavity, it is common to find the presence of ascites, reno and splenomegaly, nodulation subcapsularfrom creamy color to beige in the liver, presence of a pseudomembrane on the heart and Petechial haemorrhages in stomach, blind pilorics, gut, visceral fat, muscle, and swim bladder. In the majority of cases the intestine is filled with a yellowish mucus content and stomach with a transparent liquid seromucus, this last gives the impression that the fish has swallowed water [6].
Also is referred as Piscirickettsiosis disease initially it was apparently specific for coho salmon, therefore the trend was on the one hand reduce the densities and by another hand increase in the production of Rainbow trout and Atlantic salmon. Faced with this new situation, the disease began to be diagnosed increasingly in the last two species [5].
Chilean salmon farmers have also used different products to combat the pathologies associated with microorganisms, such as antibiotics, chemotherapy and vaccine. Some antibiotics used are: oxolinic acid, clarithromycin, chloramphenicol, cotrimoxazole, erythromycin, spectinomycin, streptomycin, flumequine, furazolidone, gentamicin, oxytetracycline, penicillin, sarafloxacine, tetracycline [5].
Antibiotics have been used widely in cultures of salmon, particularly to control the rickettsial salmonid (SRS), associated disease septicemia at Piscirickettsiasalmonis, which says 80% of the use of these antimicrobials [7].
Fryer et al. [4], determined that the strain of Piscirickettsiasalmons(LF-89) isolated from the first outbreaks of the disease, showed a sensitivity to many antibiotics, only being resistant to penicillin. However, relatively recent studies, which have suggested a possible generation of resistance to various chemotherapeutic agents used for the treatment of the piscirickettsiosis. A study by Palmer et al. [8], have shown an insulation resistance of a strain of Ireland of the North front of cotrimoxazole, furazolidone and penicillin and sensitivity to oxolinic acid [5].
The oxolinic acid, whose structure is shown in (Fig. 2), is a synthetic chemotherapeutic belonging to the family of first generation quinolones, consisting of amendments to nalidixic acid (first quinolone) synthesized in 1962. Quinolones have a chemical structure consisting of 2 rings, with one nitrogen at position 1, a Carbonyl in position 4 group and a carboxylic group in position 3, these having a common skeleton corresponding to 4-oxo-1, 4-dihidroquinoline. The mechanism of action of oxolinic acid works by blockingDNA-gyrasebacterial, joining the subunit of type A. The bacteria have a special kind of type II topoisomerases, called gyrases,that introduce negative supercoiling in the double helix of DNA. DNA-gyrase is composed of two subunits of type A and two B-type (A2B2); Type A produce cuts and successive double chain joints, while the B subunits are ATPases that provide energy for the reaction. The blockade of quinolones on the gyrase assumes that this is "frozen" in the phase in which the DNA is attached to the enzyme. This causes the accumulation of double-strand breaks, which leads to the death of the bacteria(Gesche) [9].

Figure 2: Structure of oxolinicacid (5-ethyl-5,8-dihydro-8-oxo-1,3-dioxol [4,5-g] quinolone-7-carboxilic acid)
In relation to pharmacokinetics all quinolones have a good and quick absorption by mouth, binding to plasma proteins in a small percentage, less than 50% and are widely distributed in tissues and body fluids. Their elimination occurs primarily through the kidneys in more than 90% and the remainder is metabolized to liver level, producing a (P-450) oxidation and conjugation (Castells et al.) [10].
The oxolinic acid has a broad spectrum of action, which is aimed primarily at germs Gram negative and his administration in fish is 10 to 30 mg/kg of fish per day of oxolinic acid in the form of pure active ingredient, for 10 days.
Currently the dosage of medications for fish and the form of service brings problematic different partners. Administration of chemotherapy and antibiotics is by means of the compound in its commercial form (active compound more excipients) that in the majority of cases is a powder which is managed within the pellet of food, which is sprayed in the ponds. The administration of the medication is not carried out responsibly, since correct dosing has not been respected and this has led to the emergence of resistance to antibiotics by some bacterial strains, also from the environmental point of view a part of the chemotherapy is in the aquatic environment by the disadvantages that have power systems affected the natural dynamics of the place.
Therefore,is seeking a methodology that allows an administration of the compound which is more beneficial in terms of release controlled both in the body and in the environment. Micro-encapsulation of medicines mainly in organic polymers is a promising alternative in terms of improvement of the administration of chemotherapeutic agents for bacterial pathogens. From the technological point of view, could be defined as the process of drug coating, in the form of molecules, solids or liquid globules, with materials of different nature, to result in particles of micrometric size, which differ in their morphology and internal structure. The origin of microencapsulation dates from the year 1931, where he published a work describing the formation of microcapsules of gelatin according to a procedure that already at that time received the designation of "coacervation". The idea of microencapsulated drug did not emerge until the mid-50s, when the pharmaceutical "Smith Kline and French" company introduced this technology in order to achieve a sustained or prolonged drug release. Despite the late application of microencapsulation to the field of medicinal products, the truth is that its diffusion was very rapid, becoming in a short period of time a technology widely extended in the pharmaceutical industry [11].
The benefits of the micro-encapsulation in the formulation of drugs according to Villa [11] could be summarized as follow:
• Reduction of the direct irritant effect caused by some medicines in the gastric mucosa. Examples of this are the character acid drugs, being a singular case the aspirin.
• Masking the odor and flavor. Coating of Medicine of undesirable organoleptic characteristics with a material that makes visible these features brings, without doubt, important advantages from the point of acceptability by the patient.
• Get a sustained release or controlled of the active ingredient from the pharmaceutical form. This is, at present, the most frequent application of microencapsulation.
This last point is of interest to a chemotherapy for salmon species where the release of the asset can be controlled. Thanks to the effective coating of the drug with a suitable material, it is possible to achieve, not only a gradual and sustained transfer, but also releasing occurs as pulse mode at a certain pH.
The variety of materials that can be used in micro-encapsulation is being gradually extended arising new biomaterials and new applications of micro-encapsulation are emerging. In general, is able to become micro materials that are classified into three categories: fats, proteins and polymers. There are several methods to use such as: coacervation, interfacial polymerization, extraction with evaporation of the solvent, spray and atomization-freezing, suspended in air and ionic gelling.
The ionic gelling is a technique in which microcapsules cover formation takes place by a reaction of ionic gelling between an oppositely charged ion and a polysaccharide. Usually, the gelation of sodium alginate (polyacrylic) with calcium chloride (cation) are used. The method consists in suspending the compound that will be encapsulated in an aqueous solution of sodium alginate, adding the mixture by drip, on an aqueous solution of Ca Cl2 that is subject to adequate agitation speed. The contact drop of sodium alginate with Ca2+, produce instant gelation of it, resulting in a membrane or coated calcium alginate that is insoluble in water but permeable. The reaction that takes place according to Villa [11] is:
2Na - alginate + Ca2+→ Ca - alginate + 2Na+
Microspheres obtained by any of the procedures described must be characterized and controlled in accordance with tests that ensure their quality and homogeneity, as well as its biopharmaceutical behavior.
According to Rivas and co-workers [12] in 2003 the analysis characteristic they were usually performed to the microspheres were: i) morphological characteristics, particle size and structure internal ii) production performance and iii) effectiveness of encapsulation and active ingredient content.
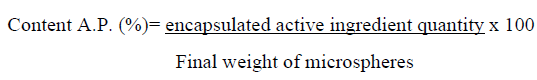
Content of oxolinic acid
Content in active principle or capacity of encapsulation refers to the amount of drug encapsulated in the microspheres. It was calculated in the following way:
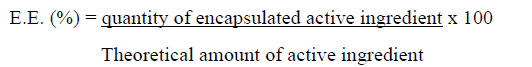
The performance or effectiveness of encapsulation is calculated from the relationship between the encapsulated active ingredient and the theoretical or able to be encapsulated, from the expression:
Release study of the active ingredient: As in other dosage forms of release-controlled, the studies release in vitro of the active molecule from the microspheres is very important. The release of the active ingredient is governed by a series of factors that are dependent of polymer, the active principle and own microsphere. Among the first one can quote the type of polymer (insoluble, soluble pH - dependent), its crystalline state and molecular weight. Parameters related to the active ingredient, include the same solubility and molecular weight. Finally, own microsphere dependent factors are, for example, type of internal structure (reservoir or matrix) and theoretical content of active ingredient with respect to polymer.
Active polymer-principle interactions and fitness: Most of the procedures of micro encapsulation imply an intimate mixing between the polymer and the active ingredient, so you can have place different physico-chemical interactions affecting the therapeutic efficacy of the final dosage form. Consequently, it is convenient to characterize the physical state of polymer and active ingredient separately and the active principle in the microsphere (active ingredient dissolved or dispersed in polymer) and highlight the possible existence of interactions drug - excipient.
Materials and Methods
Production of Chitosan: Chitosan was obtained by the classical treatment with NaOH 45% w/w at 100°C from chitin of shrimps using the chemical method of HCl and NaOH. The 10% w/v of NaBH4 addition, to the process reduces oxidation and achieve higher molecular weights, preventing the depolymerization. All this stage must have a duration of 90 minutes. Once chitosan was obtained,this was washed with hot water to remove remaining NaOH and finally dried at room temperature.
Chitosan used was obtained from red prawn shells, their characterization is summarized in (Table 1), in the case of viscosity [13] and nitrogen, both values were in the range characteristic of chitosan
| Sample | Ash (%) | Molecular weight (g/mol) | Degrade acetylation (%) | Viscosity (cps) | Nitrogen (%) |
|---|---|---|---|---|---|
| Chitosan | 0.3 | 97500 | 95 | 104 | 8.2 |
Table 1: Report of the characterization of chitosan, obtained from red prawn shells [14,15]
Percentage of ashes in chitosan
The percentage of ash was determined through the method reported by Black and Schwartz, weighing dry chitosan sample in a porcelain crucible, previously placed in an oven for 24 h at 900°C. The difference of weight gives the ashes percentage [16,17].
Degree of deacetylation analysis
The determination of deacetylation degree using elemental analysis of nitrogen by the Kjeldahl method,relates the degree of acetylation (DA) with the percentage of nitrogen.
According to the following equation:
DA (%) = [(8,695-%N) 1,799] * 100.
Where 8.695 is the percentage of nitrogen in the complete deacetylation of chitosan, 1.799 is the difference between 9.695 and 6.896 (percentage of N in chitin completely deacetylated) and %N is the percentage of N calculated on the organic fraction of the material analyzed (Larez, 2003) [18].
Determination of the molecular weight
The molecular weight of chitosan was determined using the viscosimetric method, using the equation of Mark- Houwink, which represents an empirical relationship between the average viscosimetric molecular weight and the intrinsic viscosity.
Mark-Houwink equation: (ŋ) = K (Mv)ª
The parameters K=0.074 and a= 0.76 by Mark-Houwink parameter in a solvent system of 0.2M/AcOH0.3 M.
The intrinsic viscosity (ŋ) in samples of chitosan is measured with an Ostwald viscometer at 25 ± 0.05°C [13].
Preparation of microcapsules
Synthesis of chitosan microcapsules was obtained dripping a concentrated (6%) solution of chitosan in acid acetic, about a mixture containing H2O/NaOH (0.5M) in methanol, already formed spheres were washed with hot water. Below is a suspension of the spheres in NaOH and adding a known amount of oxolinic acid per mol of chitosan, suspension was placed to heat at 40°C with stirring by 2 hours. The microspheres were washed with hot water at neutral pH and then dried. There were 3 samples between 1 and 10 milligrams of oxolinic acid
SEM
The samples, either microcapsules with and without oxolinic acid were cut in the middle, the other ones maintained their original form, being coated with gold sprayed of 150A° thickness. SEM ETEC Autoscan Model U-1 was used
FTIR
The samples were prepared using KBr pellets and spectrograms measured in a FT-IR Nicolet Magna 550
Solubility tests
The solubility was determined for different types of microspheres. The tests were carried out in sea water, nanopurewater and HCl 1 M at different pH (1,1.5, 2, 2.5, 3, 3.5, 4, 4.5, 5 and 5.5). Around 0.10 g of each microspheres were weighted and place in beakers with 20 ml of contact solution and let the stirring for 15 minutes in the case of sea water and nano purewater and for 2 h in the case of HCl. Then the samples were dried in an oven at 40°C until constant weight, then final weight was registered and solubility was determined by difference.
Determination of oxolinic acid concentration in chitosan microcapsules.
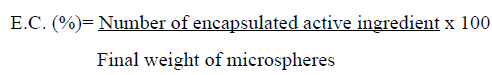
Determination of the concentration was conducted by applying the method of linear regression, where a calibration curve was made, first determining a HPLC method consisting of a Gemini column 3U C18 3 μm pore size of 4.6 x 150 mm long, a mobile acid phase oxalic 0.01 M (pH 2.3) /Acetonitrile (65:35 v/v), with a flow of 0.8 ml/min and a volume of 10 μl injection, the run time was 8 minutes. A fluorescence detector with a wavelength of 312 nm excitation and absorption of 368 nm was used to quantify. The equipment used was a Lachrom Elite with a detector L-2480, L-2130 pump and autosampler L-2200. The standards were prepared from a stock solution of 1000 μg/mL NaOH 0.03 M oxolinic acid, and held the following dilutions: 0.02, 0.05, 0.1, 0.25, 0.5, 0.75, 1 and 2 μg/mL, the dilutions were performed in 1 ml Ependorff and then they were shaken in a minishaker, each standard was filtered using filters Millex-GV with PVDE membrane 0.45 μm of pore and 13mm in diameter Mark millipore and transferred to vials for subsequent injection into the equipment, were 5 calibration curves where each standard was injected in triplicate and then work with an averagecurve between 5 curves. Solutions of KOH were dropped into chitosan solutions with different concentrations of oxolinic acid being neutralized with HCl 0.1 N and was taken from these 500 μL and complete volumewith 500 μL of mobile phase. Then they were filtered in the same way that the standards, being injected in duplicate. The concentration of active in the KOH solution that would correspond to the loss could be determined from the supplied areas of acid oxolinic from microspheres and difference in relation to the initial antibiotic concentration determines the ability of encapsulation (C.E.), using the following formula:
In addition determines the effectiveness of encapsulation (E.E.) according to the following relationship:
E.E. (%) = Number of encapsulated active ingredient x 100
Theoretical amount of active ingredient
Study of release kinetics
It is used as the basis for release kinetics theory of Fick's diffusion law, where the dissemination in relationship is determined at the time to the 6 concentrations tested, for this weigh 0.2578 gr of spheres approximately and placed in a glass precipitated on a metal mesh adapted under the level of the maximum volume of the solution used for the diffusion, so that areas only have contact with the solution but are not in continuous stirring, in order to keep slow the diffusion process. First, the test is performed using 60 mL buffer phosphate pH 5.7 and remain in slow stirring for 16 hours and samples of 1 mL are taken at: 0, 30, 60, 90, 120, 180, 240, 300,600 and 960 minutes. Then, again weighed the same amount of microspheres and placed in 60 mL of buffer phosphate pH 7.5 and remain on average 54 hours stirring and samples of 1 mL are taken at: 0, 0.5, 1, 1.5, 2, 2.5, 3, 8, 45 and 54 hours. Then, the samples are filtered and analyzed by HPLC. The pH chosen for the testing of release were pH 5.7, which simulates the pH within the body of fish and pH 7.5, which simulates the pH in aquatic environment.
Extraction tests Trials of extraction for the 6 concentrations tested, were conducted in order to determine the concentration of oxolinic acid encapsulated into microsphere, for this a chitosan microsphere was ground carefully in a mortar and 1 ml of NaOH 0.03 M was added and then agitated in a mini-shaker, this procedure was conducted with 5 areas for each concentration which were then filtered and injected into the chromatograph to determine its concentration.
Preliminary tests
Preliminary tests were carried out in the laboratories of bioassays of the Faculty of Biology at the University of Concepción. To determine the toxicity of the microspheres, several oral toxicity tests were performed using four different methodologies, testing in the following species of fish:Cheirodongalusdae, Oncorhynchus mykiss (rainbow trout),Salmo salar(Atlantic salmon),Gambusiaaffinis (mosquito fish).
Methodology 1: Cheirodon galusdae taken from an aquarium and were stacked in the container where it will throw them a known quantity of microspheres and the next day was checked the quantity ingested by fishes.
Methodology 2: Chitosan microspheres were covered one at time with a paste prepared fish food base and were given Gambusiaaffinis and an Oncorhynchus mykiss who were placed in separate containers. The next day it was checked the amount ingested by fish.
Methodology 3: It is mixed 10 ml of a solution of Chitosan to 6% with 50 ml fish oil is dripping on a solution of KOH 0.5 M, formed spheres were washed, dried, and were given to Salmo salar, Cheirodongalusdae and Gambusiaaffinis, which were placed in separate containers, and the amount ingested by fish was checked the next day.
Methodology 4: a small amount of pellets is ground for fish and they mixed with chitosan solution 6% and they dripped on a solution of 0.5 m KOH, then obtained spheres, were washed and withdrew them a percentage of moisture in the stove and they were given to the fish before it is completely dry, fish with which were tested: Salmo salar, Cheirodongalusdae and Gambusiaaffinis. The next day it is registeredthe amount ingested by fish.
Results and Discussion
Preparation of Chitosan Capsules
Due to the poly cationic chitosan nature,it has been prepared a series of poly complexes which have characteristics of hydrogels, the reason why it has been possible to study them in the controlled release of drugs, including anticancer treatments complex polyelectrolyte type that encapsulates a concentrated solution of a polyelectrolyte into a skin formed by the electrostatic interaction of the polymer with another of opposite charge.
Characterization of Chitosan Microcapsules [16]
Synthesis of Chitosan microspheres with oxolinic acid The formation of microspheres takes place by means of a gelation reaction, where chitosan mixed with acetic acid, a protonation of the amino group, with a subsequent solubilization of chitosan, this behaves as a polycation which get in contact with KOH (anion) give rise to a polyelectrolyte reaction by difference of loads where the outer layer of the chitosan solution precipitates as chitosan gel. The reaction proposed for gelation of chitosan in KOH reaction is shown below.
Fig.3 shows a proposed model for the formation of chitosan with oxolinic acid microspheres, where the outer layer of the microspheres gels to be in contact with the KOH solution, on the inside, here is where the solution of chitosan (not gelled) containing the antibiotic (the figure showsblue)

Figure 3: Model proposed for the gelling of oxolinic acid microspheres
(FT-IR) spectroscopy
The FT-IR absorption spectrum in the middle region of chitosan is registered (Fig. 4). The first band corresponds to the stretching (á¿¡ -OH) at 3431 then at 2878 cm-1 (á¿¡C-H). The acetamide of chitin shows an absorption band at 1655 cm-1. The 1381 cm-1 signal correspond to the deformation of the NH2 group. The C-O bond has a vibration of tension at 1085 cm- 1 and the N-H group deformation at 590 cm-1 is observed [17].

Figure 4: FT-IR spectrogram of oxolinic acid.
The FT-IR spectrum of oxolinic acid, where the main absorption bands, are summarized in Table 2 are displayed. The first band at 3401 cm-1 corresponds to the stretching vibration of the–OH group, then 3-band characteristics of heterocyclic compounds are between 3061 cm-1 and 2927 cm-1. The stretching vibration of C=O of the carboxylic group presents a band at 1705 cm-1. The C=C bond of the quinolinic ring shows an absorption at 1448 cm-1. At 1570 cm-1 presents a vibration C = or the ketone carbonyl group. The C=N group of the quinoline is presented at 1448 cm-1 and 938 cm-1 the absorption band of acetal group.
| Bands (cm-1) | ||||||
|---|---|---|---|---|---|---|
| Functional groups | 1 | 2 | 3 | 4 | 5 | 6 |
| O-H | 3434,23 | 3439,27 | 3439,27 | 3431,74 | 3433,1 | 3433,1 |
| C = C, quinoline | 1642,69 | 1633,28 | 1633,09 | 1637,89 | 1634,49 | 1633,14 |
| Axial stretch C = O (amide 1) | 1556,13 | 1564,29 | 1556,18 | 1563,98 | 1551,54 | 1564,02 |
| C = N, quinoline | 1413,46 | 1415,3 | 1413,06 | 1413,33 | 1412,36 | 1412,92 |
| C-O vibration | 1087,19 | 1088,82 | 1023,93 | 1091,00 | 1093,18 | 1089,78 |
Table 2: Table of the more important absorbance bands with oxolinic acid
Table 2 shows the summary of FT-IR absorbance bands of greater importance that indicate the presence of characteristic bands of chitosan and oxolinic acid in encapsulated microspheres. In the case of the encapsulated 6, the absorption bands were similar, therefore they have the same structure. The first band that appears in the range of the 3430 cm- 1 corresponds to the stretching of the –OH from chitosan, then close to 1630 cm-1 appears a band corresponding to the vibration of oxolinic acid C=C of quinolinic center ring. The stretching vibration of C= acetamide of chitosan or present a band in the range of the 1550 cm- 1. Vibration C=N of the position 1 antibiotic appears in the range of the 1400 cm- 1 for the encapsulated 6 and C-O vibration, absorption band was in the range of the 1080 cm-1. For the case of chitosan and the oxolinic acid there was the absence of characteristic bands of some functional groups, this is due to the overlap of bands that have one greater intensity over others of lower intensity, as the- OH vibration on chitosan, overlapped band are characteristic of the heterocyclic ring of antibiotic. Table 2 summarizes the absorption bands.
Thermogravimetric analysis (TGA)
Results of scans, shown temperature in °C in relation to the percentage of loss of mass (green curve) and the first derivative of the relationship between the percentage of mass loss and temperature in °C (blue curve). The termogravimetry reaches a temperature of 600° C where the remnants of the curve are shown.
Fig. 5 shows the thermogram for chitosan spheres, leaving a remnant of a 34.24% at 596 °C corresponding to carbonated chains. Table 3 summarizes the decomposition temperatures (TD).
| Sample | Peak (T °) ( final mass loss (%)) |
|---|---|
| QS Microsphere | 596,57°C (66,63%) |
| Oxolinic Acid | 596,70°C (57,35%) |
| 2 | 590,23°C (63,02%) |
| 3 | 596,57°C (66,63%) |
| 4 | 590,98°C (63,03%) |
| 5 | 590,60°C (63,09%) |
| 6 | 590,23°C (68,09%) |
Table 3: Decomposition temperatures of microcapsules

Figure 5: Thermogram of Chitosan spheres
Chitosan microspheres exhibit a residual weight of 34.24% at 596.57°C. In the case of the oxolinic acid was observed that the TD = 596 °C shows a 42.65% of residual weight (Table 3). The scans for the encapsulated with different concentrations of antibiotics where its remnants were ranging with 37% of residues, corresponding to the remnant that is left in the case of the chitosan samples. These scans showed also two peak in the first derivative which corresponds to the decomposition of two compounds at that temperature, which indicates the presence of the antibiotic in the encapsulated.
Scanning electron microscopy (SEM)
The scanning electron micrographs show the images on the surface of the microspheres, Fig. 6 shows each microspheres synthesized with different concentrations of oxolinic acid, also the relation to the increase in particle size was determined. The microspheres made with 2 mg of the antibiotic (6-a) show a regular spherical shape, a surface with an irregular texture, with a particle size of 1.28 mm diameter. (Fig. 6b) corresponding to the package with 3 mg of antibiotic has a similarly to the previous bead, spherical shape and irregular texture on its surface, its particle size of 1.41 mm in diameter. The synthesized microspheres with antibiotic 3 mg shown on (Fig, 6c) and unlike other spheres has a ball-shaped elongated, due to a chitosan solution to the samples with oxolinic acid solution diluted and to drip the solution, drop coming from syringe loses its drop shape by contact to change from one medium to another its surface shows the presence of salts, which correspond to the remains of KOH from neutralization by washing with water, its particle size is 1.06 mm in diameter. The microspheres synthesized with 4 mg antibiotic (Fig. 6d) has a regular spherical shape and a smooth surface, the surface depends on not only wash these but also the concentration of chitosan solution, where the chitosan solution more diluted its surface is more smooth and when chitosan solution in more concentrated microsphere is more compact and its surface more irregular, its particle size is of 1.16 mm in diameter.

Figure 6: Pictures foreach of the beads. (a) 2 mg. (b) 3 mg. (c) 4 mg. (d) 5 mg. (e) 6 mg. (f) 7mg
Microspheres synthesized with the highest concentrations of antibiotic 6 mg (6-e) and 7 mg (6-f) have very irregular spherical shapes since chitosan solution was very diluted and is difficult to sustain the form of drop since cover formation of microcapsules was slow and stick together them both into the solution and then at the time of drying, therefore the spherical shape is irregular. The particle size of the spheres were 1.22 mm diameter and 1.42 mm diameter for the Figures 6e and 6f, respectively. The sizes of particles between the microspheres with capping were homogeneous and were in the range of the 1.06 mm-1.42 mm in diameter, a size that only depends on the diameter of the instrument used to dribble
Solubility tests
The solubility of microspheres varied according to the pH, since it was necessary the protonation of the amino group to produce their solubility, therefore soluble in nano pure water, which is shown in Table 4, for the encapsulated both chitosan microspheres according to its mass of oxolinic acid sample where zero corresponds to chitosan microspheres without encapsulation show one low solubility, less than 1% in a time of 15 minutes and slow stirring, this low solubility showed by Table 4. Tests of solubility of Chitosan microspheres with oxolinic acid in nanopure water.
| Oxolinic acid (mg) | I W(gr) | FW (gr) | Mass solubilized (g) | % Solubility |
|---|---|---|---|---|
| 0 | 0,1076 | 0,1066 | 0.001 | 0,9294 |
| 2 | 0,1020 | 0,1010 | 0.001 | 0,9804 |
| 3 | 0,1047 | 0,1040 | 0,0007 | 0,6686 |
| 4 | 0,1009 | 0,1007 | 0.0002 | 0,1982 |
| 5 | 0,1008 | 0,0998 | 0.001 | 0,9921 |
| 6 | 0,1042 | 0,1040 | 0.0002 | 0,1919 |
| 7 | 0,1003 | 0,1000 | 0.0003 | 0,2991 |
Table 4: Tests of solubility of Chitosan microspheres with oxolinic acid in nanopure water
microspheres is due to the hydration of spheres, even in some cases of rupture. The solubility for chitosan microspheres and encapsulated, shows where the greater solubility is indicated for sample 5 with 0.9921%, the less soluble mass corresponds to the sample 6 with 0,1919% solubility. The concentration of antibiotic in the areas did not affect the solubility in nanopure water. It was not trend of solubility in time
(Table 5) [14]. Tests of solubility of Chitosan and beads with oxolinic acid in seawater.
| Oxolinic acid (mg) | IW (gr) | FW (gr) | Mass solubilized (gr). | Solubility(%) |
|---|---|---|---|---|
| 0 | 0,1055 | 0,1050 | 0.0005 | 0.47 |
| 2 | 0,1088 | 0,1080 | 0,0008 | 0.74 |
| 3 | 0,1007 | 0,1000 | 0,0007 | 0.7 |
| 4 | 0,1033 | 0,1029 | 0.0004 | 0.39 |
| 5 | 0,1025 | 0,1023 | 0.0002 | 0.2 |
| 6 | 0,1010 | 0,1007 | 0.0003 | 0.3 |
| 7 | 0,1074 | 0,1069 | 0.0005 | 0.47 |
Table 5: Tests of solubility of Chitosan and beads with oxolinic acid in seawater
In the case of seawater (pH 7.5), solubility was low, but chitosan spheres begin to hydrate, the amino group cannot be protonated, in order to achieve its Kps and the solubility. The solubilities for each encapsulates according to their mass of oxolinic acid is shown in Table 5, in addition to the initial and final weight in grams. Table 5 indicates that the solubilities were low reaching values lower than 1%, where the higher solubility is the sample 2 with a 0.74% solubility higher than the sample 5 with a 0.20%. As trials with nanopure water solubility was low and there was a marked tendency of solubility in time, therefore release of oxolinic acid in seawater did not cause a significant impact, chitosan begins to hydrate and not allow the antibiotic to diffuses easily. To observe the behavior of chitosan microspheres inside the stomach of the fish, the solubility of them is determined in a pH range from 1 up to pH 5.5. Table 6 shows the initial weights recorded at various pH for different concentrations of oxolinic acid, being zero for chitosan spheres without encapsulation. Table 6 contains the final weights recorded after the test of solubility at various pH for each sample. The final difference between initial weights and the final weights were reported in percentage.
| pH | Sample 0 | Sample 1 | Sample 2 | Sample 3 | Sample 4 | Sample 5 | Sample 6 |
|---|---|---|---|---|---|---|---|
| 1 | 4,310 | 3,900 | 4,100 | 4,000 | 4,000 | 3.8 | 3,900 |
| 1.5 | 12,351 | 11,178 | 10,000 | 9,100 | 8,900 | 7,857 | 7,100 |
| 2 | 18,881 | 17,478 | 15,400 | 14,200 | 12,400 | 11,100 | 10,000 |
| 2.5 | 22,908 | 19,248 | 18,700 | 17,300 | 15,500 | 13,400 | 12,000 |
| 3 | 24,951 | 22,500 | 20,200 | 19,400 | 17,400 | 15,300 | 13,400 |
| 3.5 | 25,620 | 24,500 | 21,600 | 19,500 | 17,600 | 15,400 | 13,600 |
| 4 | 24,470 | 22,222 | 20,800 | 18,800 | 17,000 | 15,170 | 13,190 |
| 4.5 | 21,700 | 20,900 | 18,800 | 17,400 | 15,800 | 14,500 | 13,000 |
| 5 | 17,600 | 16,600 | 16,500 | 14,500 | 13,600 | 12,300 | 11,400 |
| 5.5 | 11,500 | 11,120 | 11,600 | 10,400 | 10,200 | 9,774 | 9,440 |
Table 6: Solubilities in percentages for samples of chitosan microspheres with oxolinic acid in HCl at different Ph
The solubilities of chitosan microspheres varies according to the pH and the concentration of antibiotic in the sample, the lower solubility was given for sample 5 at pH 1 with a 3.85% and higher solubility was at pH 3.5 with 25.62% for chitosan drug-free. The solubilities behavior of the spheres at different pH is seen more clearly in Table 6, which describes the percentage of solubility for each of the samples in the range of pH work. All cases show a curve with trend Gaussian, where the solubility increases until optimum pH 1 and then decrease when the pH is approaching to more alkaline range. The maximum solubility of chitosan spheres at pH 3.5 was given by the ability of the protonated amino group solutions to slightly acid, thus increasing capacity microspheres, at higher pH hydrophilic proton availability decreases, also decreasing the solubility. In the case of lower than 3.5 pH solubility also decreases up to pH 1, phenomenon which is explained by the nature of hydrogels presenting microspheres of chitosan, which begin to have a maximum volume at acidic pH, with a repulsion between charged groups, thus a minimum shielding thus generating an excess of acid. The samples solubilities decreases as it increases the amount of added antibiotics for their synthesis, since higher concentrations of antibiotic microspheres have concentrations of chitosan more diluted and therefore the solubility of the microspheres was also given by the solubility of the oxolinic acid which solubilizes at alkaline pH.
Determination of oxolinic acid in chitosan microspheres.
Determination of the active encapsulated for sample 6 at different concentrations within the microspheres is summarized in Table 7,which shows the average area obtained by the method of HPLC applied to oxolinic acid, shown the concentration in μg/ml calculated for each area, this value corresponding to the amount of oxolinicacid which was not encapsulated, registering the largest loss in the sample number 4 with 17.16 μg/ml and the lowest loss in sample 1 with a loss of 6,76 μg/ml concentration. Is not shown a relationship between the initial concentration of oxolinic acid added for the formation of the microcapsules and the loss of antibiotic (non-encapsulated oxolinic acid), there was no greater loss of antibiotic in greater concentrations of initial oxolinic acid (Table 7). Concentration of oxolinic acid encapsulated in microspheres according to areas obtained by HPLC, and the capacity of encapsulation (E.C.) and the effectiveness of encapsulation (E.E) in percentage.
| Number of sample | Average area | C[µg/ml] | E.C.(%) | E.E.(%) |
|---|---|---|---|---|
| 1 | 2508922 | 6.76 | 0.16 | 93,20 |
| 2 | 2633235 | 6.8 | 0.24 | 95,40 |
| 3 | 2627707 | 7.08 | 0.32 | 96,46 |
| 4 | 6568773 | 17.16 | 0.39 | 93,13 |
| 5 | 4454544 | 11.75 | 0.48 | 96,08 |
| 6 | 2485226 | 7.61 | 0.57 | 97,82 |
Table 7: Concentration of oxolinic acid encapsulated in microspheres according to areas obtained by HPLC, and the capacity of encapsulation (E.C.) and the effectiveness of encapsulation (E.E) in percentage
The encapsulation capacity (E.C.) given in percentage indicates more encapsulation presents sample 6 with a 0.16%, and lower encapsulation sample 1 with a 0.16%, encapsulation ability increases as it increases the amount of oxolinic acid in initial samples. According to the values of efficiency of encapsulation, encapsulation of antibiotic within microspheres, possesses high values of encapsulation, greater than 93%, where greater encapsulation occurs in sample 6 with 97.8% and the lowest encapsulation in sample 4 is 93,1%. There was a clear relationship between the initial concentration of oxolinic acid and encapsulation efficiency, but it could be that by increasing the initial antibiotic concentration higher efficiency, as in sample 6, where the greatest concentration of antibiotic being initial is also the highest percentage of encapsulation.
The chromatograms of the six samples analyzed by HPLC, is showing the time of run on the abscissa and the intensity of fluorescence in the axis, and the corresponding pick to the oxolinic acid has a retention time of 5.2 min, approximately.
Extractions
In order to estimate the amount of oxolinic acid encapsulated in a microsphere the extractions are summarized in Table 8, showing for each sample averages from the time of retention, the height and the area, in addition to its respective concentration estimated through its area. The amounts of oxolinic acid estimated for each microsphere increases as it increases the concentration of total encapsulation.
| Number of simple | Average Rt | Average height | Average area | [µg/ml] average |
|---|---|---|---|---|
| 1 | 5.33 | 341114 | 2185755 | 0,129 |
| 2 | 5.33 | 557563 | 3349199 | 0.205 |
| 3 | 5.33 | 630531 | 3494646 | 0,214 |
| 4 | 5.33 | 688164 | 5037206 | 0.315 |
| 5 | 5.33 | 1305638 | 7100895 | 0,449 |
| 6 | 5.33 | 2703931 | 18250003 | 1,175 |
Table 8. Averages concentrations for the sixsamples of work in [μg/ml] for one bead
(Table 8). Averages concentrations for the six samples of work in [μg/ml] for one bead.
Release antibiotic tests
The release of antibiotic within the microspheres was carried out through changes of pH, where chitosan begins to solubilize and the oxolinic acid begins to spread, Table 9 summarizes concentrations released at various times for 6 types of sample intest of 54 hours at pH 7.5. The first 2 hour of test, there was practically no release but then, after that time all samples begin to release small amounts of antibiotic, (Figure 7) shows the trend of release curves, which indicates that there is a quick release on the first day, but then the release is slower becoming constant over time (Table 9). Release time of oxolinic acid at pH 7.5.
| sample | Minutes | Number of sample | |||||
|---|---|---|---|---|---|---|---|
| [µ / ml] 1 | [µ / ml] 2 | [µ / ml] 3 | [µ / ml] 4 | [µ / ml] 5 | [µ / ml] 6 | ||
| T0 | 0 | 0 | 0 | 0 | 0 | 0 | 0 |
| T1 | 30 | 0 | 0 | 0 | 0 | 0 | 0 |
| T2 | 60 | 0 | 0 | 0 | 0 | 0.003 | 0 |
| T3 | 90 | 0 | 0.037 | 0 | 0,259 | 0,187 | 0.006 |
| T4 | 120 | 0,629 | 0,690 | 0 | 2,157 | 3,074 | 2,336 |
| T5 | 150 | 1,073 | 1,530 | 1,379 | 3,827 | 3,491 | 3,979 |
| T6 | 180 | 1,465 | 4,352 | 2,862 | 4,256 | 5,466 | 4,306 |
| T7 | 480 | 2,415 | 4,732 | 4,093 | 4,824 | 5,752 | 5,362 |
| T8 | 2700 | 4,600 | 5,499 | 5,748 | 6,493 | 6,804 | 6,910 |
| T9 | 3240 | 4664 | 5,521 | 5,757 | 6,572 | 6,889 | 6,976 |
Table 9. Release time of oxolinic acid at pH 7.5

Figure 7: Release kinetics of oxolinic acid in buffer phosphate at pH 7.5
The test release at pH 5.7 was performed in the same way as above, but for 40 hours (Table 10) where the first releases were at 30 minutes after the test, in Fig. 8, shows the release test, where in comparison to pH 7.5, the release was nearly complete in the early hours to be constant in two graphs of liberation, there was a link between the concentration and the release, i.e. more of oxolinic acid microspheres not freed faster antibiotic to areas of lower concentrations.
| Sample | Minutes | Number of sample[µg/ml] | |||||
|---|---|---|---|---|---|---|---|
| T0 | 0 | 0 | 0 | 0 | 0 | 0 | 0 |
| T1 | 30 | 1,876 | 0,047 | 0,823 | 1,720 | 1,635 | 2011 |
| T2 | 60 | 1,957 | 1,894 | 0.895 | 1,723 | 1,870 | 2,106 |
| T3 | 90 | 2,008 | 2,058 | 1,821 | 1,819 | 1,931 | 2,129 |
| T4 | 120 | 2,098 | 2,133 | 1,917 | 1,903 | 1,941 | 2,266 |
| T5 | 180 | 2010 | 2,288 | 2,176 | 1,958 | 2,017 | 2,740 |
| T6 | 240 | 2,228 | 2,378 | 2,336 | 1,977 | 2,067 | 2,772 |
| T7 | 300 | 2,517 | 2,413 | 2,368 | 2,100 | 2,482 | 3,521 |
| T8 | 600 | 2,545 | 2,573 | 2,648 | 2,998 | 3,456 | 3,778 |
| T9 | 960 | 2,546 | 2,573 | 2,649 | 2,998 | 3,455 | 3,778 |
Table 10: Release time of oxolinic acid at pH 5.7

Figure 8: Kinetics of liberation of oxolinic acid in phosphate buffer pH 5.7
Weight of the microcapsules
The weight of the microcapsules was determined through a histogram of frequency of sizes (Fig. 9) showing the weights of the microspheres in mg in relation to their relative frequency, which means that they are grouped within similar sizes ranges, the average of the microspheres were 0,0011 mg with a standard deviation of 1,933 (Fig. 9). Histogram of frequencies in relation to weight in mg of microspheres.

Figure 9: Histogram of frequencies in relation to weight in mg of microspheres
Preliminary tests in fish
Four methodologies applied for the realization of the bioassay of toxicity of the microspheres in fish gave negative, to perform the bioassay, fish had to swallow the given microcapsules, but in any case this was not possible, since the fish ate only part of the total of the given microspheres and even in some cases did not eat any of the microspheres [19].
Conclusion
Chitosan used for synthesis of microcapsules has a medium low molecular weight and a high degree of deacetylation, these were prepared by means of ionic gelling. The chitosan gel was obtained in the presence of KOH.
The presence of chitosan and the antibiotic was corroborated by FT-IR bands of microcapsules.
Chitosan microcapsules with oxolinic acid had a thermal decomposition that determines the inclusion of the antibiotic in the microspheres, since 2 peak appear in the first derivative which corresponds to the decomposition of two different compounds.
The form of chitosan microspheres changes according to their concentration and concentrations of oxolinic acid present different outward forms, this can be seen in the scanning microscopy, since a greater concentration of antibiotic the external texture was smoother. There was a relationship between the concentration of antibiotic and the internal shape of the microcapsule, the greater amount of increased antibiotic is the appearance of white granules associated with the oxolinic acid.
The solubility of chitosan microspheres was very low in sea water and nanopure water, since protonation of the amino group was low and the chitosan less soluble.
The solubilities of chitosan with different concentrations of antibiotic micro-spheres show a Gaussian tendency of solubility in different ranges of pH to very acid pH (hydrogels) microspheres present swelling and at basic pH protonation of the amino group was low.
The optimum pH of solubility of chitosan spheres occurs at pH 3.5, what was observed at the maximum point of the curve.
Chitosan microcapsules had different concentrations of oxolinic acid, because the loss of antibiotic concentration was quantified by the HPLC method.
The percentage of encapsulation of the microspheres was high, all the percentages of encapsulation were higher than 90%.
The release of oxolinic acid on chitosan microspheres was fast at pH 5.7, and slow at pH 7.5.
Chitosan microcapsules had an average dry weight of 0.0011 g, as shown in the histogram of frequencies.
References
- Smith P (1999) Mechanisms of infection of bacterial pathogens in fish salmon. DIS Aquat Org 37: 165-172.
- Leal J, Woywood D (2007) Piscirickettsiosis in Chile: advances and perspectives for its control. Salmociencia 34-42.
- Fryer JL, Lannan C, Garces LH, Larenas JJ, Smith PA (1990) Isolation of a rickettsia-like organism from diseased coho salmon (Oncorhynchuskisutch) in Chile. Fish Pathol 25: 107-114.
- Cvitanich JD, Garate O, Smith CE (1991) The isolation of a rickettsia-like organism causing disease and mortality in Chilean salmonids and its confirmation by Koch’s postulate, J Fish Dis 14: 121-145.
- Larenas J, Contreras J. Smith P (1998) Current status of Piscirickettsiosis in salmon. Revista AquaTIC5:20-26.
- Bravo S, Fields M (1989) Syndrome of the Coho Salmon. Fishing Chile 54: 47-48.
- Igor DI (2006) X-ray State to the salmon industry. Report prepared by the Centro Ecoceanos. 20 p
- Palmer MA, Ambrose RF, Poff NL (1997) Ecological theory and community ecology. Restora Ecolo 5: 291-300.
- Gesche E, Madrid E, Eagle C (2001) Effect of pH, bacterial strain and type of sample, in microbiological detection, oxolinic acid and oxytetracycline in fish. Arch Med Vet 33: 21-29.
- Castells M, Castells S, Hernandez M (2007) Pharmacology in nursing. 2 nd Edtn. Elsevier publishing. Spain. 418-420.
- Vila J (1997) Pharmaceutical technology: Fundamentals of pharmaceutical systems and basic operations. 1.
- Rivas IMG, Torres A (2003) Influence of emulsifier on the characteristics of microcapsules obtained by artificial polymerization. Pharmac technol 30: 225-228.
- Larez C (2003) Some applications of chitosan in aquatic systems. Iberoamer J Polym 4: 91-109.
- Peniche C, Studies on chitin and Chitosan, Doctor’s Degree Thesis. Havana Faculty of Chemical Sciences University (Havana, 95 P).
- Anaya P, Cárdenas G, Lavayen V, García A, D’Wayer CO (2013) Chitosan Gel Film Bandages: Correlating Structures, Composition and Antimicrobial Properties. J Appl Polym Scie 128: 3939-3948.
- Taboada E, Cabrera G, Cardenas G (2002) Retention capacity of chitosan for copper and mercury ions. J Chil Chem Soc 48: 7-12.
- Edelio TV, Gustavo CB, Galo CT (2003) Synthesis and Characterization of New Arylamine Chitosan derivatives. J Appl Polymer Sci 91: 807.
- Larez C (2003) Some applications of chitosan in aquatic systems. Iberoam J Polyme 4: 91-109.
- Heads M (2007) Natural drugs in salmon farming: an alternative in disease control.Salmociencia 27-33.

Open Access Journals
- Aquaculture & Veterinary Science
- Chemistry & Chemical Sciences
- Clinical Sciences
- Engineering
- General Science
- Genetics & Molecular Biology
- Health Care & Nursing
- Immunology & Microbiology
- Materials Science
- Mathematics & Physics
- Medical Sciences
- Neurology & Psychiatry
- Oncology & Cancer Science
- Pharmaceutical Sciences