Determination of Paraquat after Adsorption by two Tropical Soils: A Voltammetric Study Based on Nafion Coated Glassy Carbon Electrode.
Djimadoum TN, Kamdem TA, Noumbo KS and Tonle KI*
Department of Chemistry, Faculty of Science, University of Dschang, Dschang, Cameroon
- *Corresponding Author:
- Ignas Tonle Kenfack
Department of Chemistry
Faculty of Science
University of Dschang
P.O. Box 67, Dschang, Cameroon
Tel: +237 696 14 15 45
Fax: +237 345 17 26 97
E-mail: ignas.tonle@univ-dschang.org
Received Date: September 28, 2018; Accepted Date: October 24, 2018; Published Date: October 31, 2018
Citation: Djimadoum TN, Kamdem TA, Noumbo KS, Tonle KI (2018) Determination of Paraquat after Adsorption by two Tropical Soils: A Voltammetric Study Based on Nafion Coated Glassy Carbon Electrode. Environ Toxicol Stud J 2:9.
Abstract
The use of pesticides constitutes the most cost-effective means of pest and weed control. Despite the importance of this use, these compounds pose a toxicological threat to both humans and the three parts of the environment formed by air, water bodies and soils. The monitoring of pesticides constitutes a daily concern, for researchers in both environment protection and analytical chemistry. This study was devoted to the elaboration of an electrochemical sensor based on a glassy carbon electrode (GCE) chemically modified by a thin film of nafion. It was developed and used to assess the sorption of a world-wide used herbicide, paraquat (PQ) by soils. The redox behavior of PQ was first examined by cyclic voltammetry using the sensor. Afterwards, an electroanalytical procedure for the determination of residues of PQ was developed by square wave voltammetry (SWV). Some parameters of the electrochemical process such as the supporting electrolyte, the concentration of nafion on the electrode response, the pH of supporting electrolyte (0.01 mol/L Na2SO4) and the accumulation time were studied. Upon optimization, a linear relationship was found between the peak current and the concentration of PQ in the range of 2 x 10⁻⁹ to 6.4 x 10⁻⁸ mol/L, with a detection limit of 0.4 ppb (1.8 × 10⁻⁹ mol/L). The developed procedure was then successfully applied to the determination of PQ adsorbed by two tropical soil samples with satisfactory results.
Keywords
Paraquat; Toxicology; Nafion; Modified electrode; Soils; Square wave voltammetry; Adsorption
Introduction
Pesticides are commonly used in agriculture to protect plants. However, this class of organics has been detected in different kinds of samples such as soils [1], liver samples of birds [2], and water samples [3,4]. Paraquat (PQ) or 1,1-dimethyl-4,4 bipyridinium dichloride, also known as methylviologen (Scheme 1), is one of the most used pesticides in over 130 countries around the world [5]. It is considered toxic for algae, fishes and other organisms. The adverse effects caused by chronically and acute expositions to this herbicide are well known and cases of death by casual ingestion or poisoning are documented in the literature [6,7]. PQ has thus been analyzed using a wide range of analytical techniques such as spectrophotometry [8], flow injection potentiometry [9] and liquid chromatography [10]. These techniques operate quite well but they present a certain number of disadvantages: separation processes in the pretreatment of samples are often complex, analysis times are long, and most of these techniques require expensive equipment [11,12]. The reversible redox properties of PQ are well known, that can allow the development of voltammetric methods based on its reduction or oxidation.
Some of these methods use techniques such as differential pulse [13], square wave [14,15] and cathodic stripping [16] voltammetries. PQ is a di-cation that can be easily accumulated on the surface of electrodes modified with cation exchanger materials, such as nafion [17], clay minerals [18] and some surfactants [19].
Nafion is a perfluorinated sulfonated cation exchanger polymer and has been widely used in electrochemistry to modify electrodes due to its excellent properties such as chemical inertness, thermal stability, mechanical strength, huge cation exchange capacity and antifouling capability [20]. Its presence on solid electrode surface induces affinity towards target cationic compound, favored by electrostatic interactions between the positively charged analyte and nafion negative charge. This key aspect can been exploited for the development of sensitive electroanalytical procedures for the determination of PQ, based on square wave voltammetry (SWV).
In this paper we report the study of the retention of PQ in two soils by using a voltammetric procedure based on nafion coated glassy carbon electrode. Our study has led to the understanding of the retention process of PQ pesticide by the investigated tropical soils, on the basis of adsorption isotherms also investigated herein.
Materials and Methods
Apparatus and chemicals
Electrochemical measurements were carried out using a μ-Autolab potentiostat (type III) running with GPES software, supplied by EcoChemie (Utrecht, The Netherlands). A standard single compartment three electrode cell was used. Electrode potentials were measured with respect to an Ag/AgCl/3M KCl reference electrode (Metrohm, Ref 6.0726.100). A stainless steel rod was used as counter electrode. The working electrode was either a bare GCE or a nafion coated GCE (here denoted GCE/nafion) prepared as described below. Spectrophotometric measurements were carried out using a JENWAY UV-Vis spectrophometer. IR spectra were recorded using a Bruker spectrophotometer equipped with a DTGS detector. Paraquat (98%) was purchased from Aldrich and a 10−2 mol/L stock solution was prepared in distilled water. Nafion (5% w/w in ethanol) was obtained from Alfa Aesar. Na2SO4, H2SO4, NaOH, K2HPO4, CH3COOH, CH3COONa, CH3CH2OH and all other chemicals were of analytical grade and used as received. The solutions and subsequent dilutions were prepared daily with distilled water.
Procedure used for the glassy carbon electrode (GCE) modification
Prior to its modification by drop-coating, the GCE was polished with alumina pastes of different sizes (1, then 0.05 μm) on billiard cloth. It was then placed in a 1:1 ethanol-water solution and properly cleaned by sonication for 10 min to eliminate any remaining alumina particles. Finally, the electrode was activated in 0.01 mol/L supporting electrolyte by 10 successive cyclic scans from -1.5 to -0.3 V at a scan rate of 100 mV/s. The surface of the GCE was coated with 7 μL nafion film modifier followed by the evaporation of the solvent at room temperature for 30 minutes to obtain the GCE/nafion modified electrode.
Electrochemical procedures and batch sorption studies
The electrochemical behavior of PQ was investigated using the bare and modified GCE by cyclic voltammetry (CV) performed in the potential window of -0.3 to -1.5 V versus Ag/AgCl (at a scan rate of 100 mV/s). All experiments were performed at room temperature. The stripping voltammetric determination of PQ was carried out by SWV in 0.01 mol/L Na2SO4 (pH7) as supporting electrolyte. The preconcentration of PQ was performed at close circuit at the working electrode immersed in the supporting electrolyte and kept under stirring. The scan parameters included a pulse potential frequency of 25 Hz, amplitude of 80 mV, a scan rate of 200 mV/s, a deposition potential of 800 mV and a step potential of 8 mV. A preconcentration time of 10 minutes was used for the quantitative measurements. Following each measurement, the electrode was cleaned by stirring in distilled water until obtaining a flat voltammogram.
The adsorption of PQ by soil samples was carried out in batch mode. Thus, 30 mg of soil were weighed and powdered in a mortar, and transferred in plastic tube. 20 mL of a 2 x 10⁻⁴ M stock solution of PQ were added in the tube which was hermetically closed. It was then placed in a mechanical platform shaker (Edmund Buhler, GmbH) and agitated at a speed of 150 rpm for a predetermined period of time. The soil was discarded by filtration and a volume of 60 μL of the filtrate was introduced into the electrochemical cell containing 50 mL of the support electrolyte. Square wave voltammograms were then recorded using the optimized parameters obtained earlier. Analyses were done using triplicate measurements and the mean values were recorded. The determination of PQ in filtrates was carried out according to the linear regression equation formulated for the calibration curve and taking into account the dilution effect.
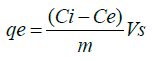
The amount qe (mol/g) of PQ retained at equilibrium by a soil sample was quantitatively evaluated using the amount of pesticide adsorbed per unit mass of soil sorbent according to equation (1):
 (1)
(1)
Where Ci and Ce are the initial and residual PQ concentration (mol/L) respectively, Vs is the volume of PQ solution (mL) and m (g) is the mass of soil used in the flask.
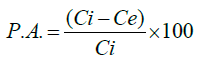
The percentage of adsorption (P.A.) of PQ was calculated as follows (equation 2):
 (2)
(2)
For comparison purposes, UV-Vis spectrophotometry was also used to quantify the amount of PQ in filtrates.
Description of soil samples
The bedrock which forms the geological substratum of Nkouonke 1 soil (NK1 soil sample) is deposited on basalt, which is a flat bowl without a slope located between 20 and 33 cm of depth. NK1 is a savanna soil from Foumbot (West region, Cameroon). It is darkish brown in the wet state and has a clay-loam texture. In the wet state, NK1 is also very friable, plastic and of low-tack. The presence of very fine pores, the average percentage of fine roots, the absence of biological activity and the absence of channels, limit the broadcasts. The bedrock which forms the geological substratum of Nkouonke 3 soils (NK3 soil sample) is a deposit of granite and a savanna cultivated soil of Foumbot located between 0 and 20 cm of depth. NK3 is dark reddish brown in the dry state and dark in the wet state, its texture is light clay.
Results and Discussion
Cyclic voltammetry study of PQ behavior
The electrochemical behavior of 4 × 10⁻⁴ mol/L PQ on the GCE electrode and GCE/nafion electrode was studied by CV, and the obtained result is shown in Figure 1. One can observe that the signal of PQ is formed by two pairs of peaks (P1, P4) and (P2, P3) which result respectively in schemes (1) and (2) corresponding to PQ adsorbed onto GCE/nafion [21-23].

Figure 1: Cyclic voltammograms recorded in 0.01 M CH3COONa (pH 8) (a) on bare GCE, (b) on bare GCE after addition of 2×10⁻⁴ mol/L PQ and (c) on GCE/nafion® in the same solution as in (b). Potential scan rate: 100 mV/s.
 (1)
(1)
 (2)
(2)
As expected, the electrochemical response on the GCE modified by a thin film of nafion was greater than that recorded on the bare GCE. This feature can be reasonably explained by the fact that negatively charged -SO3− groups of nafion favorably attract the positively charged PQ pesticide [17].
Influence of the nature of supporting electrolyte and nafion concentration on the signal of the modified electrode
The voltammograms in Figure 2A show the electrochemical response of PQ (5 × 10⁻⁶ mol/L) obtained on GCE/nafion electrode in hydrogen phosphate (0.01 mol/L), sodium sulfate (0.01 mol/L) and sodium acetate (0.01 mol/L) aqueous solutions with pH adjusted to 8. The analysis of these voltammograms shows that the peak obtained in sodium sulfate solution is more intense than the signal obtained in other supporting electrolytes. Sodium sulfate solution thus favors the detection of PQ and was used as supporting electrolyte in further experiments.

Figure 2: (A) SWV response of 5 × 10⁻⁶ mol/L PQ at GCE/nafion in different supporting electrolytes (0.01 mol/L) at pH8 (i) Na2SO4, (ii) K2HPO4, (iii) CH3COONa. (B) Effect of nafion concentration on SWV peak current of 3 × 10⁻⁶ mol/L PQ in 0.01 mol/L Na2SO4 (pH8). SWV conditions: frequency 25 Hz, amplitude 0.04V, deposition potential 0.8V.
The effect of nafion concentration on the peak of current for 3 × 10⁻⁶ mol/L PQ in 0.01 mol/L Na2SO4 was also examined as shown in Figure 2B. The peak current of PQ initially increased when the percentage of nafion was increased, reaching a maximum at 2%. The electrode response then decreased with an increase in nafion concentration at the electrode. The dilution of nafion decreased its viscosity, limiting thereby the transfer of electrons at the electrode [17]. Therefore, 2% of nafion in the dispersion was taken as optimal concentration in the subsequent experiments.
Influence of the pH of supporting electrolyte and accumulation time
The effect of the pH of supporting electrolyte on the current response of GCE/nafion in 0.01 mol/L Na2SO4 containing 10-6 mol/L PQ was investigated in the pH range from 3 to 12. The results are shown in Figure 3A. An increase in current intensity when the pH increases from 3 to 7 was observed, followed by a slight decrease of the electrode from pH7 to 12. The detection of PQ was observed to be more favorable in basic solution compared to acidic media. However, pH7 was taken as optimal and used in the subsequent experiments.

Figure 3: (A) Effect of the pH on SWV peak current of 10−6 mol/L PQ in 0.01 mol/L Na2SO4. (B) Effect of accumulation time on SWV peak current of 10−8 mol/L PQ in 0.01 mol/L Na2SO4 (pH7). SWV conditions: frequency 25 Hz, amplitude 0.04V, deposition potential 0.8V.
The accumulation time is also a key parameter since the amount of bounded species can vary with time. Thus, the investigation of the variation of current intensity with accumulation time allows us to determine the minimum time at which the accumulation of PQ at the surface of the electrode tends to be maximum. Indeed, the intensity of the current increased with time up to 600s (Figure 3B). The increase of current intensity indicated a progressive accumulation of PQ at the electrode surface. After 600s (10 minutes), the current intensity increased slightly and tends to level off, probably due to the fact that the accumulation sites of PQ on the surface of the electrode tend towards saturation [22]. Ten minutes preconcentration was chosen as optimal time in the subsequent experiments.
Interference study, calibration plot and analytical application of the sensor
The influence of some ions present in topical soil such as K+, NO3−, Ca2+, Mg2+, NH4+ and Fe3+ on the peak currents of PQ reduction onto GCE/nafion was studied using 10−8 mol/L PQ in 0.01 mol/L Na2SO4 at pH7 (Table 1). Each of these ions was then introduced in the accumulation medium, with a concentration 1000-fold greater than that of PQ. As can be seen from Table 1, the presence of Mg2+ and K+ showed negative interference on the signal of PQ while other species induced a positive interference. Overall, the variation in the response of PQ was not affected since none deviation for more than 5% was registered. This means that the GCE/nafion electrode is not influenced by the presence of these ions in soils. Using the optimized experiment conditions obtained in previous sections, the calibration curve for PQ was plotted by SWV. Figure 4 shows the voltammograms corresponding to the variation of PQ concentration in the range of 2 × 10⁻⁹ to 6.4 × 10⁻⁸ mol/L in 0.01 mol/L Na2SO4 supporting electrolyte. The linear equation was defined as: I (A) = -201.43868 × C (mol/L)- 2.84456 × 10⁻⁶, with a correlation coefficient of 0.9996 (Figure 4 inset). A limit of detection (calculated as 3×SD/m, where SD is the standard deviation and m is the slope of the calibration curve) was 0.4 μg/L (1.8 × 10⁻⁹ mol/L) and the limit of quantification of PQ (estimated as 10×SD/m) was 1.6 μg/L (6.2 × 10⁻⁹ mol/L).
| Ionic Species | Concentration (mol/L) | Contribution* (%) I[ PQ ]=100% |
|---|---|---|
| Ca2+ | 10-5 | 2.40 |
| Mg2+ | 10-5 | -1.00 |
| NH4+ | 10-5 | 2.00 |
| K+ | 10-5 | -1.20 |
| NO3− | 10-5 | 0.01 |
| Fe3+ | 10-5 | 0.01 |
*n=3
Table 1: Influence of ions species on the peak current of 10−8 M PQ (Ip=−4.840 × 10⁻⁶ A) in 0.01 mol/L Na2SO4 at pH 7.

Figure 4: Dependence of the SWV peak current on PQ concentration (a) blank, (b) 2 × 10⁻⁹, (c) 5 × 10⁻⁹, (d) 8 × 10⁻⁹, (e) 1.6 × 10⁻⁸, (f) 2.4 × 10⁻⁸, (g) 3.2 × 10⁻⁸, (h) 4 × 10⁻⁸, (i) 4.8 × 10⁻⁸, (j) 5.6 × 10⁻⁸ and (k) 6.4 × 10⁻⁸ mol/L in 0.01 mol/L Na2SO4 at pH 7 in optimal conditions. The inset shows the corresponding calibration curve of PQ.
A comparison of the sensitivity of the GCE/nafion sensor with those reported in the literature shows that the method proposed herein exhibited a detection limit of the same order of magnitude [18,23], or even lower than those reported by certain authors [23-26] for the detection of the same pesticide. It is however noteworthy to mention that a better detection limit has achieved by Chtaini et al. [27] by square wave voltammetry at natural phosphate modified carbon paste electrode. A key advantage of the present study the simplest method to modify the glassy carbon electrode which led to on a very inexpensive but quite sensitive sensor.
The repeatability of the response was measured with the same electrode after five measurements of 5 × 10⁻⁹ mol/L PQ with an R.S.D. value of 0.8%. This indicated that the method herein proposed is sensitive and could be easily applied for the quantification of PQ.
Prior to that, the applicability of the GCE/nafion sensor for the determination of PQ in soils was demonstrated by using it to analyze PQ spiked in 2 soils. The recovery percentage was calculated taking into consideration the amount of PQ previously introduced in the tube. Table 2 presents the results obtained for both voltammetric and spectrophotometric methods. One can notice from the voltammetric method that NK1 and NK3 soils adsorb about 69% and 77% respectively, of the amount of the PQ initially introduced in the tube. A similar tendency was observed for the spectrophotometric method. This observation could be reasonably explained by the intrinsic characteristics of studied soils. The great retention of PQ by NK3 in comparison with NK1 is in relation with the amount of organic matter, and clay mineral and the cation exchange capacity of this soil. In fact, the higher these parameters are, the more pronounced is the uptake of the pesticide.
| Soil samples |
Added [PQ] (mol/L) | UV-Vis Spectroscopy measurement | Square Wave Voltammetry measurement | ||||||
|---|---|---|---|---|---|---|---|---|---|
| Absorbance Measured* |
RSD (%) |
[PQ] found (mol/L) |
Recovery (%) |
Intensity (A) Measured* |
RSD (%) |
[PQ] found (mol/L) |
Recovery (%) |
||
| NK1 | 2 × 10⁻⁴ | 1.309 | 1.3 | 6.42 × 10⁻⁵ | 32.1 | −1.44 × 10⁻⁵ | 1.4 | 6.18 × 10⁻⁵ | 30.9 |
| NK3 | 2 × 10⁻⁴ | 1.097 | 1.4 | 5.17 × 10⁻⁵ | 25.8 | −1.22 × 10⁻⁵ | 2.9 | 4.61 × 10⁻⁵ | 23.1 |
*n=3
Table 2: Residual concentrations of PQ determined by UV-Visible spectroscopy and SWV.
The results in Table 2 confirmed the potential applicability of the voltammetric method developed in this work for the quantification of PQ in soils. For both voltammetric and UV-vis spectrophotometric methods, the maximum relative standard deviation (RSD) recorded for a triplicate measurement was less than 3%, proving the reproducibility of the measurements.
Assessment of the adsorption of PQ by tropical soils
Physic-chemical characterization of soils
To gain some information about the nature of both soils investigated in this work, some experiments were performed to determine their physic-chemical characteristics. The key parameters are gathered in Table 3, that include mostly the cation exchange capacity, the granulometry, the humidity and exchangeable acidity, the pH, the organic carbon and organic material.
| Soil | Depth (cm) |
pH KCl | pH H2O | ΔpH | CEC (meq/100 g) | Exchangeable Acidity (meq/100 g) |
OC (%w) |
OM (%w) |
Humidity (%) |
Components | ||
|---|---|---|---|---|---|---|---|---|---|---|---|---|
| Clay (%) | Silt (%) | Sand (%) | ||||||||||
| NK1 | 20 - 33 | 4.69 | 6.38 | 1.69 | 21.68 | 1.18 | 2.64 | 4.60 | 2.01 | 31 | 27 | 42 |
| NK3 | 0 - 20 | 4.02 | 5.52 | 1.50 | 24.32 | 3.58 | 2.94 | 5.07 | 0.70 | 35 | 25 | 40 |
ΔpH= (pH H2O-pH KCl), CEC: cation exchange capacity, OC: organic carbon, OM: organic matter
Table 3: Physic-chemical characteristics of NK1 and NK3 soils.
The infrared spectra of soil samples were recorded in the 4000 - 500 cm−1 region (Figure 5). The absorption bands at 3690 and 3625 cm-1 for NK3, 3694 and 3619 cm-1 for NK1 correspond to interlayer hydroxyl group stretching of kaolinite [30,31]. The absorption bands observed around 1400 and 1630 cm-1 are ascribed respectively to C-H stretching vibration of organic matter and O-H deformation of water molecular [26,29]. The absorption bands around 1000 and 910 cm−1 observed in Figure 6 were attributed to Si-O and Al-AlOH stretching vibration bands of kaolinite, respectively. The doublet at 745-790 cm-1 on the spectra of both soil samples can be ascribed to Si-O-Si intertetrahedral bridging bonds in quartz [30].

Figure 5: Infrared spectra of NK1 and NK3 soil samples.
Influence of contact time on the adsorption of PQ by soils
Commonly, the contact time between the sorbent and the adsorbate affects adsorption processes. This parameter was first investigated in this section, and as shown in Figure 6A, a fast adsorption of PQ was observed during the first fifteen and twenty minutes for NK3 and NK1 respectively. A plateau was then obtained from 30 minutes for NK3. The first step is characterized by high adsorption rate and this is due to the fact that initially, the number of adsorbent sites available on the soils is higher, allowing PQ to easily reach them. The second part shows that when time progresses, the number of free sites on soils decreases and the non-adsorbed molecules are assembled at the surface, thus limiting the capacity of adsorption.

Figure 6: (A) Effect of contact time on the adsorption onto NK1 and NK3 soil samples. Experimental conditions: 30 mg of each soil sample in 20 mL of 2 × 10⁻⁴ mol/L PQ solution, shaking time: 120 mn at room temperature. (B) Effect of pH on the adsorption of 2 × 10⁻⁴ mol/L PQ onto NK1 and NK3 at equilibrium time. (C) Effect of soil mass on the adsorption of 2 × 10⁻⁴ mol/L PQ at pH 12 onto NK1 and NK3 at equilibrium time.
Influence of pH on the adsorption of PQ by soils
As the contact time, the pH of solution is one of the most important parameters affecting adsorption. According to Table 3, both NK1 and NK3 soil samples are acidic, and from Figure 6B, the uptake of PQ was very low in more acidic medium (pH2), probably due to a competition between PQ and hydronium ions for the adsorbing sites on soil samples. However, the adsorption continuously increased with pH, reaching the highest rate at pH12. This observation could find an explanation in the deprotonation in basic conditions of the functional groups present in the organic matter of soils, which enhance the uptake of the positively charged PQ. Therefore, pH12 was chosen for the investigation of the effect of soil mass on the adsorption of paraquat.
Influence of soil adsorbent mass on the adsorption of PQ
The amount of soil was varied from 10 to 250 mg in 100 mL of 10-4 M PQ at pH12. As can be seen from Figure 6C, the retention of the pesticide by the soil increased with the mass of this latter. Initially low for small amounts of soil, the adsorption became stronger as soil mass was increased in the solution, the optimal value (adsorption of PQ above 78%) being obtained with a soil mass of 250 mg. As observed for other parameters investigated in this study, the adsorption of the pesticide was more important for the soil sample NK3.
Conclusion
In this work, a nafion coated glassy carbon electrode was shown to be a prominent sensing tool for the voltammetric determination of paraquat in soils. Due to its low-cost, this sensor could be useful as an analytic device in environmental monitoring or for a rapid screening of areas polluted with toxic pesticides.
Conflict of Interests
The authors declare that there is no conflict of interests regarding the publication of this paper.
Acknowledgements
The financial support from the Academy of Science for the Developing world (Grant No. 12-117 RG/CHE/AF/AC-G; UNESCO FR: 12-117 RG/CHE/AF/AC-G) is gratefully acknowledged.
References
- Baskaran S, Kookan RS, Naidu R (1997) Determination of the insecticide imidacloprid in water and soil using high performance liquid chromatography. J Chromatogr A 787: 271-275.
- Berny PJ, Buronfosse F, Videmann B, Buronfosse T (1999) Evaluation of the toxicity of imidacloprid in wild birds. J Liq Chromatogr Rel Technol 22: 1545-1559.
- Guillermo Q, Armenta S, Garrigues S, Guardia M (2004) Fourier transform infrared determination of imidacloprid in pesticide formulations. J Braz Chem Soc 15: 307-312.
- Rivas PI, Alegre EG, Suarez AI (2006) Development and validation of a fast high performance liquid chromatography method for the determination of microencapsulated pyrethrod pesticides. Chim Acta 557: 245-251.
- Fabio FS, Carlos MPV, Christopher MAB (2007) Electroanalytical detection of the pesticide paraquat by batch injection analysis. Anal Lett 40: 1800-1810.
- Sagar GR (1987) Uses and usefulne ss of paraquat. Hum Toxicol 6: 7-11.
- Stephens BG, Moormeister SK (1997) Uses and usefulness of paraquat. Am J Forensic Med Pathol 18: 33-39.
- Rai MK, Das JV, Gupta VK (1997) A Sensitive determination of paraquat by spectrophotometry. Talanta 45: 343-348.
- Saad B, Ariffin M, Saleh MI (1998) Flow injection potentiometric determination of paraquat in formulation and biological samples. Talanta 47: 1231-1236.
- Kambhampati I, Roinestad KS, Hartman TG, Rosen JD, Fukuda EK, et al. (1994) Determination of diquat and paraquat in water using highperformance liquid chromatography with configuration by liquid chromatography particle beam mass spectrometry. J Chromatogr A 688: 67-73.
- Sreedilar M, Madhusudana TR, Sirista KR, Jayarama SR (2003) Differential pulse adsorptive stripping voltammetric determination of dinoseb and dinoterb at a modified electrode. Anal Sci 19: 511-516.
- Sbai M, Tome HE, Gombert U, Breton T, Pontie M, et al. (2007) Electrochemical stripping of methyl-parathion using carbon fiber microelectrodes modified with combinations of poly-NiTSPc and nafion films. Sens. Actuator B Chem 124: 368-375.
- Yanez-Sedeno P, Pingarron JM, Polo-Diez LM (1985) Determination of paraquat by differential pulse polarography. Mikrochim Acta 87: 279-287.
- Walcarius A, Lamberts L (1996) Square wave voltammetric determination of paraquat and diquat in aqueous solution. J Electroanal Chem 406: 59-68.
- Souza D, Machado SAS (2003) Study on electroanalytical the paraquat aqueous solutions by square wave voltammetry. Quim Nova 26: 644-652.
- Pinilla MM, Hernandez HL, Moreno SM, Sevilla ET (1993) Determination of paraquat by cathodic stripping voltammetry after accumulation through the formation of an ion pair on a hanging mercury drop electrode. Electroanalysis 5: 79-81.
- De Oliveira MF, Lichtiq J, Jorge CM (2004) Evaluation of a nafion coated glassy carbon electrode for determination of paraquat by differential pulse voltammetry. J Braz Chem Soc 15: 735-741.
- Zen JM, Jeng SH, Chen HJ (1996) Determination of paraquat by square wave voltammetry at a perfluorosulfoned ionomer/claymodified electrode. Anal Chem 68: 498-502.
- Luque M, Rios A, Valcarcel M (1998) Sensitive determination of paraquat and diquat at the sub-ng level by continuous amperometric flow methods. Analyst 123: 2383-2387.
- Xie X, Gan T, Sun D, Wu K (2008) Application of multi-walled carbon nanotubes/nafion composite film in electrochemical determination of Pb2+. Fuller Nanotub Car Nano 16: 103-113.
- Lu TH, Sun IW (2000) Electrocatalytic determination of paraquat using a nafion film coated glassy carbon electrode. Talanta 53: 443-451.
- El Mhammedi MA, Chtaini A (2008) Electrochemical studies of adsorption of paraquat onto Ca10(PO4)6(OH)2 from aqueous solution. Leonardo J Sci 12: 25-34.
- De-Souza D, Machado SAS (2005) Electrochemical detection of the herbicide paraquat in natural water and citric fruit juices using microelectrodes. Anal Chim Acta 546: 85-91.
- Alvarez E, Sevilla MT, Pinilla JM, Hemandez L (1992) Cathodic stripping voltammetry of paraquat on a carbon paste electrode modified with amberlite XAD-2 resin. Anal Chim Acta 260: 19-23.
- Kenne-Dedzo D, Nanseu-Njiki CP, Ngameni E (2012) Amperometric sensors based on sawdust film modified electrodes: application to the electroanalysis of paraquat. Talanta 99: 478-486.
- Tcheumi HL, Tonle IK, Walcarius A, Ngameni E (2012) Electrocatalytic and sensing properties of natural smectite type clay towards the detection of paraquat using a film-modified electrode. Am J Anal Chem 3: 746-754.
- El Mhammedi MA, Bakasse M, Chtaini A (2017) Electrochemical studies and square wave voltammetry of paraquat at natural phosphate modified carbon paste electrode. J Hazard Mater 145: 1-7.
- Tonle IK, Letaief S, Ngameni E, Walcarius A, Detellier C (2011) Square wave voltametric determination of lead (II) ions using a carbon paste electrode modified by thiol-functionalized kaolinite. Electroanalysis 23: 245-252.
- Viscarra RRA, Mouazen AM, Wetterlud J (2010) Visible and near spectroscopy in soil science. Adv Agron 107: 163-215.
- Bertaux JF, Frohlich F, Ildefonse PP (1998) Multicomponent analysis of FTIR spectra: quantification of amorphous and crystallized mineral phases in synthetic and natural sediments. J Sediment Res 68: 440-447.

Open Access Journals
- Aquaculture & Veterinary Science
- Chemistry & Chemical Sciences
- Clinical Sciences
- Engineering
- General Science
- Genetics & Molecular Biology
- Health Care & Nursing
- Immunology & Microbiology
- Materials Science
- Mathematics & Physics
- Medical Sciences
- Neurology & Psychiatry
- Oncology & Cancer Science
- Pharmaceutical Sciences