Environmental Indicators in the Pretreatment of Water Potabilization
De Medina Salas Lorena1*, Mora Murrieta Betzabé1, Castillo González Eduardo2, Giraldi Díaz Mario Rafael1
1Faculty of Chemical Sciences, Universidad Veracruzana, Circuito Gonzalo Aguirre Beltrán s/n, Zona Universitaria, C.P. 91040, Xalapa, Veracruz, México
2Faculty of Civil Engineering, Universidad Veracruzana, Circuito Gonzalo Aguirre Beltrán s/n, Zona Universitaria, C.P. 91040, Xalapa, Veracruz, México
- *Corresponding Author:
- De Medina Salas Lorena
Faculty of Chemical Sciences Universidad Veracruzana
Circuito Gonzalo Aguirre Beltrán s/n, Zona Universitaria
C.P. 91040, Xalapa, Veracruz, México
Tel: +52(228)8421758
E-mail: loredms@hotmail.com
Received Date: March 24, 2018; Accepted Date: April 18, 2018; Published Date: May 01, 2018
Citation: De Medina Salas Lorena, Mora Murrieta Betzabé, Castillo González Eduardo, Giraldi Díaz Mario Rafael (2018) Environmental Indicators in the Pretreatment of Water Potabilization. Environ Toxicol Stud J 2:6.
Abstract
Environmental indicators provide information that is both significant and comparable for process controls, such as drinking water quality. Therefore, the objective of this study was to determine the variability of the following parameters: turbidity, residual chlorine and pH, in the process of water pretreatment for potabilization and to propose corrective actions to ensure standards of water quality for human consumption are maintained. The methodology consisted in taking 45 simple samples of water to determine the aforementioned parameters in the water supply for the locality studied. Individual X-R control charts were elaborated to learn the central tendency and variability of the environmental indicators. These were compared to the control limits in the official Mexican standard NOM-127-SSA1-1994 “Environmental health, water for human use and consumption-permissible limits of quality and treatments to which water must be submitted for its potabilization”. The results showed that turbidity was under statistical control, whereas residual chlorine and pH were identified to be outside of the aforementioned control. Therefore it is suggested to improve training for operators and to establish a calibration program for the equipment used. This review of the environmental indicators also allowed us to conclude that this process is affected by water quality, which is variable. This is especially true in the rainy season where there is more turbidity due to the dragging of sediments towards the supply source, in addition to the existence of a relationship between the increase in turbidity of raw water and disinfectant dosage. Through the control of the water pretreatment process there will be gradual but significant advances to increase water quality, guaranteeing the satisfaction of the population.
Keywords
Environmental indicators; Turbidity; pH; Residual chlorine; Control charts
Introduction
Environmental phenomena have an impact on the variability of water supply sources; this requires the processes of potabilization to operate properly before these variations can be considered to maintain the quality standards in the production of water for human consumption [1].
The importance of environmental indicators derives from the need to help organizations in their decision-making processes as well as constituting a tool through which concise and scientifically supported information is presented so that it can be easily understood and used [2]. These indicators favor public perception about environmental problems to provide an information base for continuous improvement; they also assess conditions and trends at a regional, national or global scale and benefit the integration of these factors into economical policies. All these factors make it possible to comply with international commitments in environmental matters and to perform comparative analyses between companies and economic sectors.
The ISO 14000 series is used for the evaluation of indicators; it is constituted by a set of standards and among them ISO 14031: 2015 "Environmental performance evaluation" stands out [3]. This standard describes two general categories of indicators for the evaluation of environmental performance (EEP): indicators of environmental performance and indicators of environmental conditions. Therefore, the objective of this research was to determine the behavior of the following parameters: turbidity, residual chlorine and pH in the process of pretreatment of water for potabilization and to propose corrective actions to ensure that standards of water quality for human consumption are maintained (Table 1).
| Number | Critical Control Point | Indicator | Standard | Observation/ Description |
|---|---|---|---|---|
| 1 | Pre-sedimentation | Turbidity | NOM-127-SSA1-1994 | < 5 NTU |
| 2 | Chlorine contact tank | Chlorine | NOM-127-SSA1-1994 | 1.50 ppm |
| 3 | Driving line | Chlorine Turbidity pH |
NOM-127-SSA1-1994 | 1.5 ppm < 5 NTU 6.5-8.5 |
| 4 | Output of regularization tanks | Chlorine Turbidity pH |
NOM-127-SSA1-1994 | 3 ppm < 5 NTU pH: 6.5-8.5 |
Table 1: Indicators of the water pretreatment process.
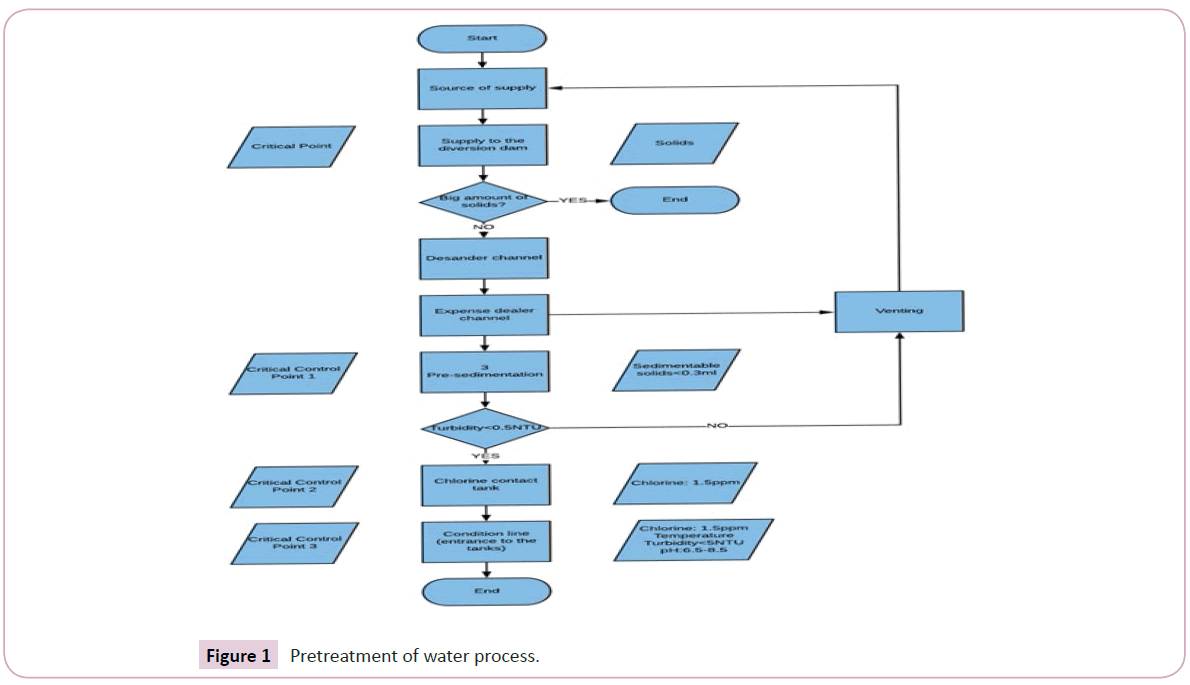
Standard NOM-127-SSA1-1994 has the following limits for drinking water: maximum 5 units of nephelometric turbidity (NTU) ideally below 1 NTU [4], pH 6.5-8.5 and residual chlorine between 0.2 to 1.5 mg/L [5]. A high turbidity prevents disinfection and promotes the proliferation of bacteria, which results in a significant demand in the average chlorine expense, which in consequences acidifies the water. The excess dosage of chlorine has a series of negative effects, since it increases the costs of water treatment and alters the water’s properties of flavor and odor. Liquid chlorine causes severe burns on contact with skin and eyes. The effects are more severe as concentration gets higher or exposure times get longer, causing eye irritation and shortness of breath. Symptoms of exposure to high concentrations consist of nausea and vomiting followed by marked difficulty in breathing [6]. Increasing chlorine levels also raises the risk of formation of disinfection byproducts such as trihalomethanes that can be harmful to human health [7]. Therefore, if these indicators are not under control, a significant disturbance in water quality is generated [8-11]. Hence the importance of analyzing the potabilization pretreatment process, which is shown in Figure 1, with critical control points and indicators that were measured in this process.
The important points in the present study are the performance of permanent surveillance for appropriate control to avoid over dosage or lack of application of reagents that affect the water’s final quality. Thanks to this information, material and human resources allocation can take place, maximizing the results obtained in the investment and ensuring optimal results (Figure 1).
The evaluation of indicators of operation in the pretreatment of water according to ISO 14001 has benefits regarding the improvement of the quality and efficiency of the process, savings in raw material and reduction in the generation of waste, all this is reflected in a decrease in the costs of management, operation, treatment and payment for the right to use water [12].
Methodology
The methodology consisted of three phases: water sampling, characterization of the parameters in the laboratory and statistical analysis of the results. The source of supply for this pretreatment is the Huehueyapan River located near the Cofre de Perote volcano in Mexico. The facility consists of a bypass dam constructed with concrete and masonry, including a grit sedimentation channel with a steel gate measuring 1.0 x 1.50 m.
The collected flow is conducted through a call channel to three gravity-based pre-sedimentation tanks, each with a capacity of 60 lps. After the sedimentation process, chlorination by the addition of 13% sodium hypochlorite is carried out in a contact tank, for the adequate disinfection of the water and its distribution under sanitary conditions through the pipeline network of the city. Therefore, it is required to dose a chlorine concentration of 3 mg/L in the effluent of the regularization tanks, so that the closest point of the distribution network contains 1.2 mg/L and the furthest, 0.2 mg/L and thereby ensuring water quality as required by the corresponding regulation.
For the first phase, 45 simple samples were taken in duplicate during the period from January to February 2018 at the entrance of the regularization tanks. In the second phase, laboratory determinations were made for the turbidity, residual chlorine and pH parameters using a portable laboratory Hash 2800. In the third phase, the statistical analysis of turbidity, residual chlorine and pH [13] of the water pretreatment process using individual x-R control charts to determine if they were under statistical control [14,15]. The data analysis was carried out using JMP SAS software version 8. Based on the results obtained through the measurements made in the affluent of the regularization tanks, it was determined if these environmental indicators had to be adjusted to standard requirements for water for human consumption.
Results and Discussion
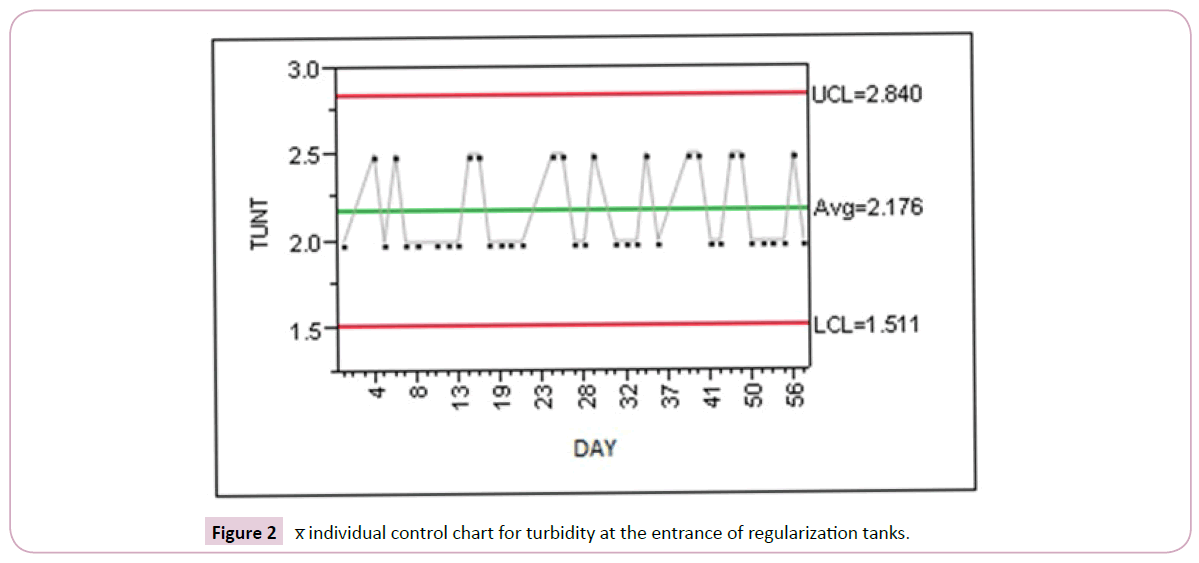
Figure 2 shows the chart of individual averages of turbidity, where this parameter presented values in the range of 2 to 2.5 NTU, so it is under statistical control in the affluent of the regularization tanks. It is worth mentioning that the data from days 30 and 37 were eliminated due to the presence of rain that increased the turbidity. In this study the turbidity indicator presented a range of 2.0 to 3.0 NTU, however this result is different from that shown by other authors who report ranges of 0.67 ± 0.56 and 0.25– 8.23 NTU respectively. It is inferred that the difference is due to the period when sampling took place and the water quality of the study area (Figure 2) [16,17].
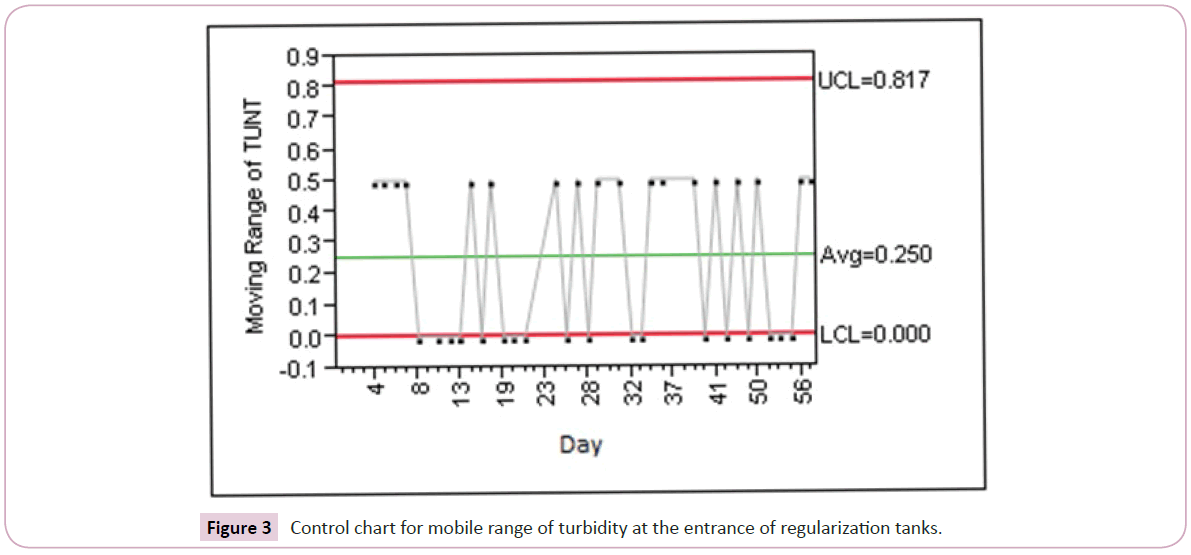
Figure 3 shows the chart of ranges was also under control after making the same adjustment of the aforementioned points. This confirms the process is affected by the behavior of high turbidity events in the supply source. It requires a quick and accurate operational response by operators, in order to maintain quality standards in the treated water. A strategy to guarantee the above could be the implementation of training programs, aimed at the personnel that operate pretreatment; especially if there are high turbidity events in the source of supply. When the turbidity indicator is under statistical control, it means the process is stable, predictable and reliable (Figure 3).
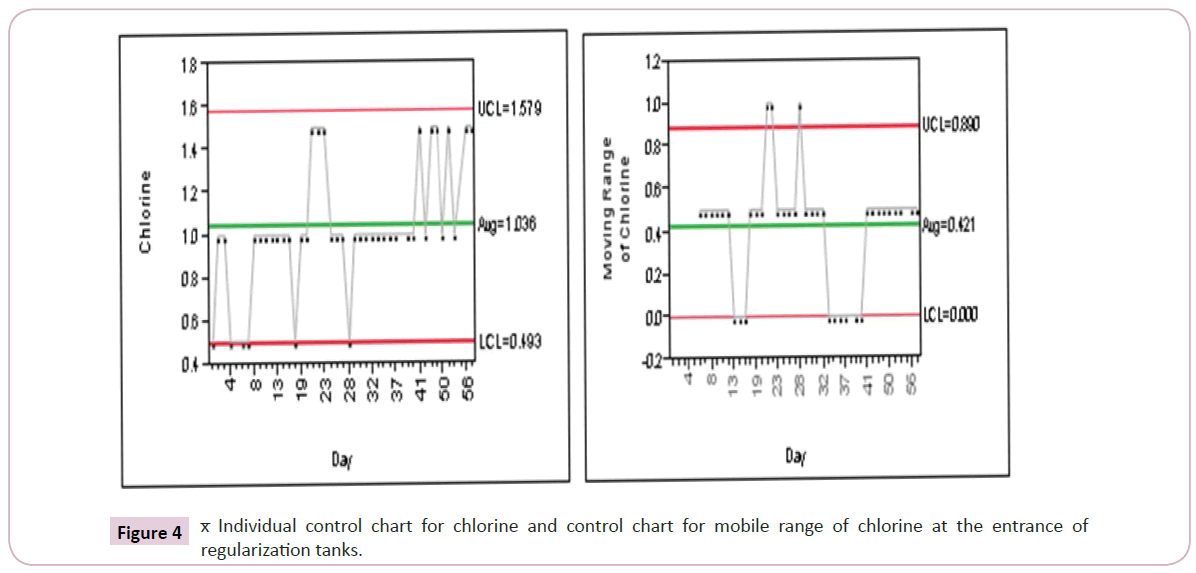
Figure 4 presents the chart for the indicator of residual chlorine, here it was found that point 5 had a low concentration of chlorine (0.3 mg/L) and point 55 did not contain chlorine at all. The results were compared with the NOM-127-SSA1-1994 that indicates the values of residual chlorine should be within the range of 0.2 to 1.5 mg/L. Thus, it can be seen that point 5 of the chart is within specification whereas point 55 is outside the regulatory values. After reviewing this situation, it was found that an error by the operators in charge of the dosing of chlorine caused these low concentrations. Therefore, the control limits of the charts were recalculated without considering this data, where non-random patterns were observed in two trials specifically. The first one, consisting of seven consecutive points and the second one, consisting of eight points below the average range, confirming that there is a lack of training for the facility operators regarding the application of the colorimetric method. It would be recommended to provide proper training to the operators and it would be necessary to have another measuring instrument designed for the automated on-site and online control of residual chlorine concentration. Chlorine indicator presented a range of 0.5 to 1.5 mg/L in this research; this result is different from that reported in prior literature with ranges from 0.12 to 0.44 mg/L [17,18]. This difference is probably due to greater contamination at the sampling sites (Figure 4).
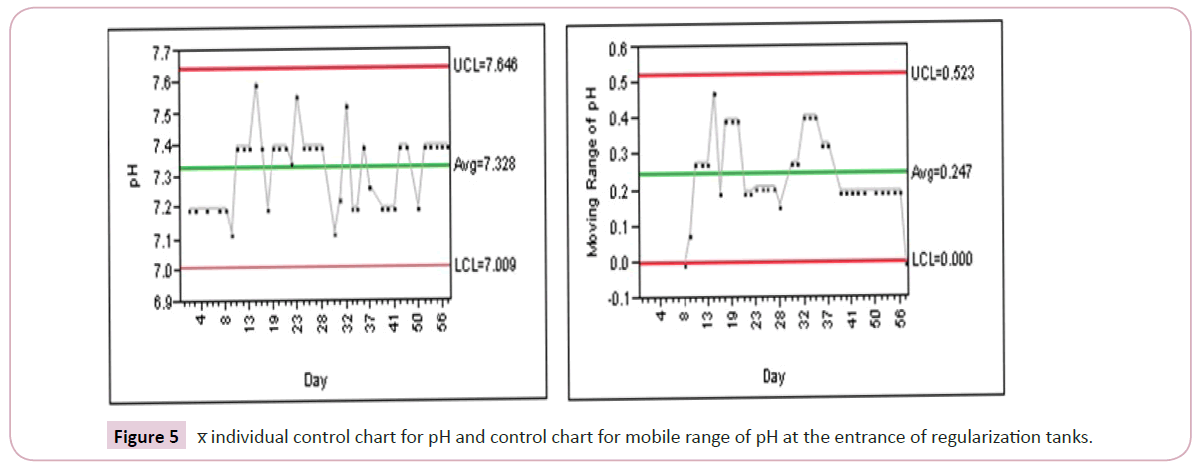
Figure 5 presents the charts where control limits for the pH indicator were recalculated and the assignable causes were reviewed, in points 1, 4, 6, 29 and 49. All the values had a pH of 6.8; which may be indicative of a causality arising from the operation of the measurement equipment, for example, incorrect calibration, because of adjustments that were observed in the process and a tendency to form non-random patterns, confirming the cited causality. Consequently, it is necessary to have a calibration program for the measuring equipment, as well as providing further training to the operators. The pH was 6.8, however this result differs from that presented by other authors who show values of 6.7 to 8.2 [19-21]. This is probably due to the sampling sites and the season of the year in which the sampling was obtained.
It is important to note that turbidity and pH values did not exceed the limits set by standard NOM-127-SSA1-1994. Likewise, operational criteria should be established in the procedures in which statistical control was applied in order to determine water quality from the effluent (Figure 5).
Conclusion
The pretreatment operation indicators were analyzed, concluding that this process is affected by water quality; this is variable according to the season of the year, the variations include changes in pluviality. Turbidity in the source of supply affects the efficiency of the pretreatment process, so the implementation of training programs aimed at operators to troubleshoot events of high turbidity from the supply sources could be a good strategy to guarantee the quality characteristics required by current regulations.
Due to the increase in turbidity, chlorine requirements are greater to ensure water disinfection. It is recommended to establish controls to minimize the unnecessary waste of chlorine, especially during the occurrence of the aforementioned situations. In this way, through the control of the water purification pretreatment process, significant advances will be made to increase water quality, guaranteeing the satisfaction of the population.
All the control charts used in this research provide information about the behavior of the process and identification of the points outside of specification, so it is important to review them over time. It is desirable that government agencies related to water potabilization consider these results as the first step in the establishment of a permanent monitoring plan that guarantees water quality. Through this kind of measurement, a strategic plan can be established in the medium and long term, including preventive and corrective actions that contribute to the continuous improvement of the process.
References
- Montoya C, Loaiza D, Torres, P, Cruz C, Escobar JA (2011) Effect of increase of raw water turbidity on efficiency of Conventional drinking water treatment processes. Revista EIA 16: 137-148.
- International Standard ISO 14031 (2013) Environmental management - Environmental performance evaluation - Guidelines. International Organization for Standardization. Switzerland.
- Ritchie I, Hayes W (2007) A guide to the implementation of the ISO 14000 series on environmental management. Upper Saddle River, NJ, Prentice Hall, USA.
- Toro CG (2011) Monitoring of the quality of Water. Available from: https://academic.uprm.edu/gonzalezc/HTMLobj-859/maguaturbidez.pdf
- Mexican Official Standard Nom-127-Ssa1-1994, "Environmental health, water for use and consumption human-limits permissible quality and treatments to which the water should be submitted for your potabilization". Official Journal of the Federation. Available from: https://www.ordenjuridico.gob.mx/Documentos/Federal/wo69543.pdf
- The Clorine Manual 6th Edition (2000) The Clorine Institute, Inc., Washington, D.C. USA. Available online: https://www.archerinstruments.com/Chlorine_Manual.pdf
- Marco L, Azario R, Metzler Cy García MC (2004) Turbidity as a basic indicator of wáter quality made drinkable from surface sources. Proposals to purpose of the study of the purification system and distribution in the city of Concepción del Uruguay (Entre Ríos, Argentina) Higiene y Sanidad Ambiental 4: 72-82.
- Coulibaly HD, Rodriguez MJ (2004) Development of performance indicators for small Quebec drinking water utilities. J Environ Manage 73: 243-255.
- Smeti EM, Thanasoulias NC, Kousouris LP, Tzoumerkas PC (2007) An approach for the application of statistical process control techniques for quality improvement of treated water. Desalination 213: 273-281.
- Scheili A, Rodriguez MJ, Sadiq R (2016) Impact of human operational factors on drinking water quality in small systems: an exploratory analysis. J Clean Prod 133: 681-690.
- Scheili A, Rodriguez MJ, Sadiq R (2015) Seasonal and spatial variations of source and drinking water quality in small municipal systems of two Canadian regions. Sci Total Environ 508: 514-524.
- Cascio J, Woodside G (2003) Guía ISO 14000. Las nuevas normas internacionales para la administración ambiental. México, DF. Mc Graw Hill Interamericana.
- Michalus JC, Santander PR Rajczakowski L (2004) Analysis of water purification process variables in he city of oberá, misiones using control charts. Revista de Ciencia Tecnología 6: 5-11.
- Gutiérrez PH (2010) Calidad y productividad, México, DF Mc Graw Hill.
- Montgomery DC (2009) Statistical Quality Control, DF Limusa Wiley.
- Jafari K, Mohammadi AA, Heidari Z, Asghari FB, Radfard M, et al. (2018) Data on microbiological quality assessment of rural drinking water supplies in Tiran County, Isfahan province, Iran.
- YouseﬠM, Saleh HN, Yaseri M, Mahvi AH, Soleimani H, et al. (2018) Data on microbiological quality assessment of rural drinking water supplies in Poldasht country. 17: 763-769.
- Barakat A, Meddah R, Afdali m, Touhami F (2018) Physicochemical and microbial assessment of spring water quality for drinking supply in Piedmont of Béni-Mellal Atlas (Morocco). Phys chem earth.
- Arnal JM, Sancho M, García Fayos B, Lora J, Verdu G (2006) Aquapot: UF real applications for water potabilization in developing countries. Problems, location and solutions adopted. Desalination 204: 316-321.
- Ayandirana TA, Fawolea OO, Dahunsib SO (2018) Water quality assessment of bitumen polluted Oluwa River, South Western Nigeria. Water Res and Indus 19: 13-24.
- Wu Z, Wang X, Chen Y, Cai Y, Deng J (2018) Assessing river water quality using water quality index in Lake Taihu Basin, China. Sci Total Environ 612: 914-922.
Open Access Journals
- Aquaculture & Veterinary Science
- Chemistry & Chemical Sciences
- Clinical Sciences
- Engineering
- General Science
- Genetics & Molecular Biology
- Health Care & Nursing
- Immunology & Microbiology
- Materials Science
- Mathematics & Physics
- Medical Sciences
- Neurology & Psychiatry
- Oncology & Cancer Science
- Pharmaceutical Sciences
