ISSN : 2347-5447
British Biomedical Bulletin
A Machine Learning Algorithm for Image Compression with application to Big Data Architecture: A Comparative Study
1Condensed Matter Research Unit for Electronics and Signal Processing (UR-MACETS), University Of Dschang, Cameroon
2Research Unit of Automatics and Applied Informatics (UR-AIA), University of Dschang-Cameroon
3Research Unit of Engineering of Industrial Systems and Environment (UR-ISIE), University of Dschang-Cameroon
4National Advanced School of Posts, Telecommunications and Information Communication, and Technologies (SUP'PTIC), Cameroon
- *Corresponding Author:
- Aurelle Tchagna Kouanou
Faculty of Science, Condensed Matter
Research Unit for Electronics and Signal
Processing (UR-MACETS), University Of Dschang, Cameroon
Tel: +237696263641
E-mail: tkaurelle@gmail.com
Received date: November 19, 2018; Accepted date: January 16, 2019; Published date: January 25, 2019
Citation: Kouanou AT, Tchiotsop D, Tchinda R, Tansaa ZD (2019) A Machine Learning Algorithm for Image Compression with application to Big Data Architecture: A Comparative Study. Br Biomed Bull Vol.7 No.1:316.
Abstract
Abstract Background and Objective: In this paper, our paradigm is based on the workflow proposed by Tchagna et al and we now propose a new compression scheme to implement in this step of the workflow. The goal of this study is to propose a new compression scheme, based on machine learning, for vector quantization and orthogonal transformation, and to propose a method to implement this compression for big data architectures. Methods: We propose developed a machine learning algorithm for the implementation of the compression step. The algorithm was developed in MATLAB. The proposed compression scheme performed in three main steps. First, an orthogonal transform (Walsh or Chebyshev) was applied to image blocks in order to reduce the range of image intensities. Second, a machine learning algorithm based on K-Means clustering and splitting method is utilized to cluster image pixels. Third, the cluster IDs for each pixel is encoded using Huffman coding. The different parameters used to evaluate the efficiency of the proposed algorithm are presented. We used Spark architecture with the compression algorithm for simultaneous image compression. We compared our obtained results with literature results. The comparison was based on three parameters, Peak Signal to Noise Ratio (PSNR), MSSIM and computation time. Results: We applied our compression scheme to medical imagery. The obtained results of parameters for the Mean Structural Similarity (MSSIM) Index and Compression Ratio (CR) averaged 0.975% and 99.75%, respectively, for a codebook size equal to 256 for all test images. In comparison, with codebook size equal to 256 or 512, our compression method outperforms the literature methods. The comparison suggests the efficiency of our compression method. Conclusion: The MSSIM showed that the compression and decompression operation performed without loss of information. The comparison demonstrates the effectiveness of the proposed scheme
Keywords
Big data; Machine learning; Image compression; MATLAB/Spark; Vector quantization
Introduction
Big data is not limited to data size, but should also include characteristics such as volume, velocity, and type [1]. In medicine, techniques have been established to obtain medical images with high definition and large size. For example, a modern CT scanner can yield a sub-millimeter slice thickness with increased inplane resolution resulting in 600 MB to a gigabyte (GB) of data [2]. The problem is the very large amount of data contained in an image can quickly saturate conventional systems. In modern computing, image compression is important. The compression enables a reduction in the required storage space for computer memory during image saves. This provides easier transmission and is less time-consuming. The development of a new method able to compress biomedical images with a satisfactory compromise between the quality of the reconstructed image and the compression ratio is a challenge. Indeed, in [3], the authors propose a new concept and method for all such steps. In the present study, we consider the compression step and propose a scheme for image compression based on machine learning for vector quantization. There exist two types of compression: lossless compression (reconstructed data is identical to the original), and lossy compression (loss of data). However, lossless compression is limited in utility since compression rates are very low [4]. The compression ratio of the lossy compression scheme is high. Lossy compression algorithms are often based on orthogonal transformation [5-11]. Many lossy compression algorithms are performed in three steps: orthogonal transformation, vector quantization, and entropy encoding [12]. In image compression, quantization is an important step. Two techniques are often used to perform the quantization step: scalar quantization and vector quantization. Based upon distortion factor considerations introduced by Shannon [4,6], the best performance can be obtained using vectors instead of scalars. Thus, efficiency and performance of processing systems based on vector quantization (VQ) depend upon codebook design. In image compression, the quality of the reconstructed images depends on the codebooks used [13].
In this paper, we propose a compression scheme which performs three principal stages. In a first step, the image is decomposed into sub-blocks (8 × 8); on each sub-block, we applied an orthogonal transform (Walsh or Chebyshev) in order to reduce the range of image intensities. Secondly, a machine learning algorithm based on K-Means and split method calculates the centers of clusters and generates the codebook that is used for vector quantization on the transformed image. Third, the clusters IDs for each pixel are encoded using Huffman coding. We used MATLAB Software to write and simulate our algorithm. This paper has two essential goals. The first is to compare our proposed algorithm for image compression, with existing algorithms in the literature. The second aim of this paper is to propose a method to implement our compression algorithms in a workflow proposed in [3] using Spark. With this method, we can compress many biomedical images with the best performance parameters. The paper is organized as follows: in section 2, published methods in the field are examined. These methods are exploited theoretically throughout our work in section 3. Section 4 presents the obtained results on four medical images. Results are analyzed, compared and discussed with another work in section 5. A conclusion and future work are provided in section 6.
State of the Art
With the rapid development of the modern medical industry, medical images play an important role in accurate diagnosis by physicians [14]. However, many hospitals are now dealing with a large amount of data images. They used traditionally the structured data. Nowadays, they use both structured and unstructured data. To work effectively these hospitals use new methods and technologies like virtualization, big data, parallel processing, compression, artificial intelligence, etc., out of which the compression is the most effective one. For a medical image, the goal is to maintain the diagnostics-related information at a high compression ratio. It is worth mentioning that several papers have been published showing the used algorithms to have the compression methods increasingly effective. In that way, Lu and Chang that presented in [15] a snapshot of the recently developed schemes. The discussed schemes include mean distance ordered partial codebook search (MPS), enhance LBG (Linde, Buzo, and Gray) and some intelligent algorithms. In [11], Prattipati et al. compare integer Cosine and Chebyshev transform for image compression using variable quantization. The aims of their work were to examine cases where Discrete Chebyshev Transform (DChT) could be the alternative compression transform to Discrete Cosines Transform (DCT). However, their work was limited to the grayscale image compression and further; the use of a scalar quantification does not allow them to reach a high PSNR. Chiranjeevi and Jena proposed Cuckoo search (CS) metaheuristic optimization algorithm, which optimizes the LBG codebook by levy flight distribution function, which follows the Mantegna’s algorithm instead of Gaussian distribution [16]. In their proposed method, they applied Cuckoo search for the first time to design effective and efficient codebook which results in better vector quantization and leads to a high Peak Signal to Noise Ratio (PSNR) with good reconstructed image quality. In the same year, Chiranjeevi and Jena applied a bat optimization algorithm for efficient codebook design with an appropriate selection of tuning parameters (loudness and frequency) and proved better in PSNR and convergence time than FireFly-LBG [17] Their proposed method produces an efficient codebook with less computational time. They give results great PSNR due to its automatic zooming feature using an adjustable pulse emission rate and loudness of bats. FF-LBG (FireFly-LBG) algorithm is proposed by Horng [18]. Horng proposed an algorithm to construct the codebook of vector quantization based upon FF algorithm. The firefly algorithm may consider as a typical swarm based approach for optimization, in which the search algorithm is inspired by the social behavior of fireflies and the phenomenon of bioluminescent communication [18].
Hosseini and Naghsh-Nilchi work also on the VQ for medical image compression [19]. Their main idea is to separate the contextual region of interest and the background using a region growing segmentation approach; and then, encoding both regions using a novel method based on contextual vector quantization. The background is compressed with a higher compression ratio and the contextual region of interest is compressed with a lower compression ratio to maintain a high quality of the image (ultrasound image). However, the compression ratio remains low and, the fact to separate the image for compression takes a long time in the compression process. Unfortunately, the authors did not test the processing time of their algorithm. In [20], Hussein Abouali presented an adaptive VQ technic for image compression. Its proposed algorithm is a changed LBG algorithm and operates in three phases: initialization, iterative, and finalization. In the initial phase, the initial codebook is selected. During the iterative phase, the codebook is refined, and the finalization phase removes redundant codebook points. During the decoding process, pixels are assigned the gray value of its nearest neighbor codebook point. However, this method presents the same problem with the LBG algorithm that used the very large codebook. Jiang et al. in [14] introduced an optimized medical image compression algorithm based on wavelet transform and vector quantization (VQ) with variable block size. They, respectively, manipulate the low-frequency components and high-frequency components with the Huffman coding and improved VQ by the aids of wavelet transformation (Bior4.4). They used a modified K-means approach, which is based on the energy function in the codebook training phase. Their introduced method, compress an image with good visual quality and, a high compression ratio. However, the method is more complex than some traditional compression algorithms presented in their paper. Phanprasit et al. presented a compression scheme based on VQ [12]. Their method performs in the three follow step. First, they use discrete wavelet transform to transform the image and fuzzy C-means, and support vector machine algorithms to design a codebook for vector quantization. Second, they use Huffman coding as a method of eliminating the redundant index. Finally, they improve the PSNR using a system with error compensation. Thus, we notice that Phanprasit et al. use two algorithms to calculate the clusters and generate the codebook for vectors quantization. However, although the quality of results got by the authors, the compression ration remains always low. Mata et al. in [13] proposed a fuzzy K-means families and K-means algorithms for codebook design. They used the Equal-average Nearest Neighbor Search in some of fuzzy K-means families, precisely in the partitioning of the training set. The acceleration of fuzzy K-means algorithms is also got by the use of a look ahead approach in the crisp phase of such algorithms, leading to a decrease in the number of iterations. However, they still need to set the number of K at the beginning of the algorithm.
Given the obtained results in [12-14], we can notice that the K-mean represents a good solution for the construction of the codebook for VQ. However, the disadvantage of K-mean lies in setting the value of K before the start of the program. To overcome this problem, we propose in this paper to use the split method to adapt the value of K for each image automatically. This has the consequence of having an optimal codebook for each image and to improve the quality of the reconstructed image with a good compression ratio as we will see in the obtained results of this paper. To the best of our knowledge, none of the existing researches presents a method able to implement a big data image. This drawback is the second main interest in this paper. As in [21] where the authors proposed the compression method for Picture Archiving and Communication System (PACS) implementation, we also proposed spark architecture for biomedical image compression using the introduced compression scheme. Our proposed architecture can then be implemented into a workflow proposed in [3].
Methods
Figure 1 illustrates the flowchart of the proposed compression and decompression scheme. In this figure, the orthogonal transformations refer to the conversion of an image from the time domain to other domains such as frequency domain through an orthogonal base. The image in the new domain brings out specific innate characteristics which can be suitable for some applications. In this work, we used Walsh transform and Chebyshev transform. 0 Additional, DChT overcomes DCT on images with sharp edges and high predictability [22]. In the two next subsections, we define the DChT and the discrete Walsh transform (DWhT) used to transform the images in our flowchart. In the results section, we will see the difference between the DChT and the DWhT on the quality of the reconstructed image and the performance parameters.

Figure 1: Compression scheme based upon orthogonal transform, vector quantization and Huffman coding.
Discrete chebyhev transform (DChT)
The DChT stems from the Chebyshev polynomials Tk(x) of degree k and is defined in eq. (1).
TK(x) =cos (k arcos x) ; x Є [-1, 1] ; k=0,1,2,…0 (1)
TK(X) are normalized polynomials such TK (1) =1 and satisfy the Chebyshev differential equation given in eq. (2).
(1-x2) y’’ –xy’ +k2y= 0 (2)
The Chebyshev polynomials TK (x)are connected by the recurrence relation [11,22]:
T0 (x) =1
T1 (x)=X
TK+1 (x)= 2xTk (x) – Tk-1 (x) for k˃1 (3)
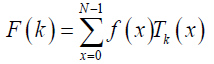
The DChT of order N is then defined in [23-25] eq. (4):
 (4)
(4)
k= 0,1,2,……,N -1
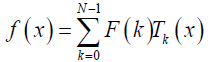
Where F (k ) denotes the coefficient of orthonormal Chebyshev polynomials. f (x) is a one-dimension signal at time index x. The inverse DChT is given in eq. (5) [23-25]:
 (5)
(5)
x=0,1,2,…,N -1
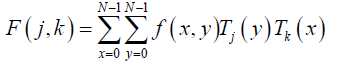
Now, let consider a function with two variables f (x,y)sampled on a square grid NхN points. Its DChT is given in eq. (6), [25-27]:
 (6)
(6)
j, k = 0,1,2,….,N -1
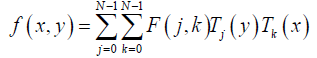
And its inverse DChT is given in eq. (7):
 (7)
(7)
x, y =0,1,2,…,N -1
Discrete walsh transform (DWhT)
The Walsh function W(k, x) is defined on the interval (0,1) in [28]
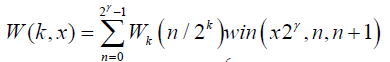 (8)
(8)
Where N=2k; 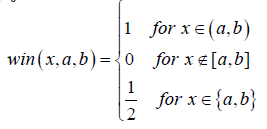 win represented the window function.
When x= m/N and for some integer 0˂m˂N it comes that
W (k, m/N) =Wk (m/N)δm,n =Wk (n/N) δm,n =Wk (m,k / N) (9)
The orthonormality property of the Walsh functions is expressed in eq. (10)
w (m,x), W(N,X))=δm,n (10)
The discrete orthogonality of Walsh functions is defined in eq. (11) by Chirikjian GS et al. [28].
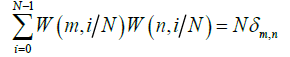 (11)
(11)
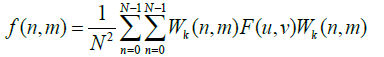
For a function with two variables f (n,m) sampled on square grid N2 points, its 2D Walsh transform is given in eq. (12) by Karagodin MA et al. [29].
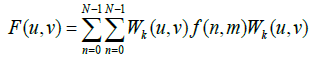 (12)
(12)
Where WK(U,V)is the Walsh matrix having the same size as the function F (n,m) The inverse 2D transform is also defined in eq. (13) by Karagodin MA et al. [29].
 (13)
(13)
The transformation allows reducing the range of image intensities and prepares the image for the next step: the vector quantization that group the input data into vectors (non-overlapping) and “quantizer” each vector.
Vector quantization
Vector quantization (VQ) is used in many signal processing contexts including data and image compression. VQ procedure for image compression includes three major parts: code-book generation, encoding and decoding [19].
Basic concepts: Vector quantization (VQ) was developed by
Gersho and Gray [30-32]. A vector quantizer q may be defined
[33] by an application of a set E into a set  as in eq. (14).
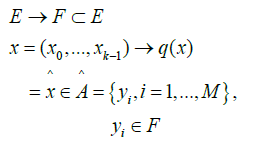 (14)
(14)
 are a dictionary of length M and dimension k. E is partitioned by
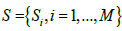 , with
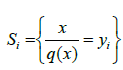 . The distortion between
 and
and  is a positive quantity or zero [32-37] given by
eq. (15):
is a positive quantity or zero [32-37] given by
eq. (15):
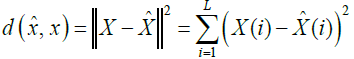 (15)
(15)
Where L is the vector size.
The total distortion of the quantizer for a given codebook is then:
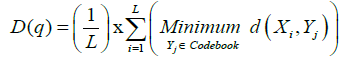 (16)
(16)
For the construction of our codebook, we used a machine learning algorithm that performs with unsupervised learning. Our unsupervised learning relies on the K-means algorithm with the splitting method.
K-Means and splitting algorithm: VQ makes it possible to have a good quantification of the image during the compression. However, the generated codebook during quantification is not always optimal. We introduced then a training algorithm (K-means) to calculate the codebook. K-means is a typical distance-based cluster algorithm, and distance is used as a measure of similarity [38,39]. Here, K-means calculate and generate the optimal codebook that can be adapted to the transformed image [40]. K-Means does not solve the equiprobability problem between the vectors. Thus, we coupled the K-Means with a Split method to have equiprobably vectors of a lower probability of occurrence. This allows us to create a very suitable codebook for image compression and to close the lossless compression technics. The goal of the splitting method is to partition into two clusters the training vectors. It minimizes the mean square error between the training vectors and their closest cluster centroid. Based on work proposed by Franti et al. in [41], we construct our own method using K-means and splitting method for vector quantization codebook generator. Figure 2 shows the algorithm of our vector quantization method.

Figure 2: Flowchart to generate codebook for vector quantization.
Huffman coding: The Huffman coding is a compression algorithm based on the frequencies appearance of characters in an original document. Developed by David Huffman in 1952, the method relies on the principle of allocation of shorter codes for frequent values and longer codes to less frequent values [4,6,42,43]. This coding uses a table containing the frequencies appearance of each character to establish an optimal binary string representation. The procedure is generally decomposed into three parts: the creation of the frequencies appearance of the character table in the original data, the creation of a binary tree according to the previously calculated table, and encoding symbols in an optimal binary representation. Our three steps to perform the image compression are defined, now to see the effects of our compression scheme; we have to calculate performance parameters.
Performance parameters for an image compression algorithm
There are eight parameters to evaluate the performance of our compression scheme: Mean Square Error (MSE), Maximum Absolute Error (MAE), Peak Signal to Noise Ratio (PSNR), Mean Structural SIMilarity (MSSIM) Index, Universal Image Quality (UIQ) Index, the Compression Rate (CR), the compression time (CT) and decompression time (DT). The MSE and PSNR are defined by Kartheeswaran S et al. and Ayoobkhan MUA et al. [44,45] in eq. (17).
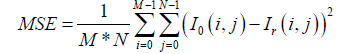 (17)
(17)
With I0 the image to compress and Ir the reconstructed image and (M, N) the size of the image. The PSNR is given in eq. (18).
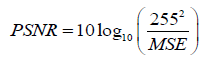 (18)
(18)
The MSE represents the mean error into energy. It shows the energy of the difference between the original image and the reconstructed image. PSNR gives an objective measure of the distortion introduced by the compression. It is expressed in deciBels (dB). Maximum Absolute Error (MAE) defined by (19) shows the worst-case error occurring in the compressed image [46].
MAE =max |I0 (i, j) – Ir (i, j)| (19)
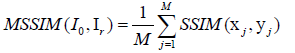
Usually, in practice, MSSIM index allows evaluating the overall image quality. MSSIM is defined by Wang Z et al. and Hore A et al., [47,48] in eq. (20).
 (20)
(20)
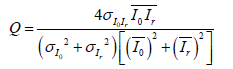
Where xj and yj are the image contents at the j-th local window; and M is the number of local windows in the image and SSIM (x, y) = [1 (x, y)]α .[c(x, y)] β .[s (x, y)]γ with α˃ 0, β˃ 0 and γ˃ 0 are parameters used to adjust the relative importance of the three components. The UIQ Index models any distortion as a combination of three different factors: loss of correlation, luminance distortion, and contrast distortion [49]. It is defined by in eq. (21).
 (21)
(21)
In equation (20) and (21) the best value 1 is achieved if and only Io= Ir.
The MSSIM, SSIM and UIQ as define above, are the practical index use to evaluate the overall image quality.
The Compression rate (CR) is defined as the ratio between the uncompressed size and compressed size. The CR is given by Sayood K and Salomon D et al., [4,6] in (22) and (23).
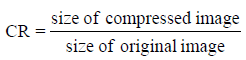 (22)
(22)
In percentage form, the CR is given by (16).
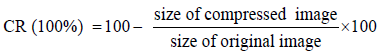 (23)
(23)
The compression time and decompression time are evaluated when we start the program in MATLAB. CT and DT depending on the computer used to simulate the program. We simulate our algorithm in a computer with the following parameters: 500 Go of the hard disk; Intel core I 7, 2 GHz; 8 Go of RAM.
For the medical image, the goal of the introduced method in this paper is to maintain the diagnostic-related information at a high compression ratio. The medical applications require saving a large amount of images taken by different devices for patients in large numbers and for a long time [20]. Our compression algorithm being defined let us present how these algorithms can be implemented in the compression step of the workflow presented in [3]. Indeed, the challenge is then how you can compress at the same time many quantities of images.
Implementation of our compression scheme in big data architecture
In this subsection, we just present a method used to implement our algorithm using MATLAB and the Spark framework in order to compress many images at the same time. MATLAB is used because it provides numerous capabilities for processing big data that scales from a single workstation to compute clusters, on Spark [50]. Our compression codes are written in MATLAB, we just need to use Spark to have access to our images and simulate our algorithms. Indeed, Spark runs on top of existing Hadoop Distributed File System (HDFS) infrastructure to provide enhanced and additional functionality. However, we coupled MATLAB with Spark in order to have access to data image from HDFS and Spark and applied our compression MATLAB algorithm. In fact, MATLAB provides a single, high-performance environment for working with big data [51]. With MATLAB, we can explore, clean, process, and gain insight from big data using hundreds of data manipulation, mathematical, and statistical functions [51].To extract the most value out of your data on big data platforms like Spark, careful consideration is needed as to how data should be stored and extracted for analysis in MATLAB. We can use MATLAB and access to all types of engineering and business data from various sources (Images, audio, video, geospatial, JSON, financial data feeds, etc.). You can also explore portions of your data and prototype analytic. By using the mathematical method, machine learning, virtualization, optimization methods, you can build the algorithms and create models and analyze your entire dataset, right where your data lives. Therefore, it is possible to use Spark and MATLAB to implement an algorithm able to compress many images at the same time.
Results
In this section, we present the obtained results for the compression scheme proposed in Figure 1 and our Spark architecture to compress images using our introduced algorithm. We use four medical images as test images. These images are chosen according to their spectral activities ranging from the least concentrated to the most concentrated finally to have a good conclusion on our algorithms. The Discrete Cosine Transform (DCT) is a transform used to represent the spectral activity [52]. The Figure 3 (a-d) shows these test images with their spectral activities. Image size is 512 × 512 × 3. Table 1 presents the obtained results with DChT and Table 2 those obtained with DWhT.

Figure 3a: Test images with their spectral activities in pelvis.

Figure 3b: Test images with their spectral activities in head.

Figure 3c: Test images with their spectral activities in abdomen.

Figure 3d: Test images with their spectral activities in strange body.
In Tables 1 and 2, we can observe that the variation of PSNR, MSE, MAE, CR, UIQ, MSSIM, CT and DT according to codebook size. For a codebook size of 512, the values of PSNR are high and the closer infinity for some images and MSSIM are equal to one. MSSIM equal to one and PSNR equal to infinity proof that the compression and decompression operate with no loss of information. In both tables, the compression ratio ranges between 99.72% and 99.90% whatever the image and the codebook size. We can also notice that when the codebook size increases, the CR decreases slightly. Our results are then very satisfactory given the good compromise between MAE/UIQ and CR.
In Figures 4 (a,b) and 5 (a,b), we can see the impact of codebook size in our compression algorithm. These figures represent image after decompression. By using the Human Visual System (HVS), we can see that for some images, when the codebook size equal to 256, the original image equal to the decompressed image Figures 4 (a,b) and 5 (a,b) then presents some of our test images decompressed using DChT and DWhT, respectively. From these images, we confirm that the quantization step enormously influences the compression system, especially as regards the choice of codebook size. For the same simulation with the same configurations, the settings such as PNSR, MSE and CR may be slightly different. This is because we assumed in our program during the learning phase, that if no vector is close to the code word, we use a random vector by default.

Figure 4a: Head images compressed and decompressed using DChT.

Figure 4b: Abdomen images compressed and decompressed using DChT.

Figure 5a: Head images compressed and decompressed using DWhT.

Figure 5b: Abdomen images compressed and decompressed using DWhT.
Regarding the Figures 4 (a,b) and 5 (a,b), we can say using a subjective evaluation as Human Vision System (HVS), there is no difference between original and decompressed image for a codebook size equal to 256. For this codebook size, we get an average of PNSR equal to 32, MSSIM equal to 0.950 and, it becomes difficult to see the difference between these images.
Figures 6 (a-d) and 7 (a-d) show the MSSIM and MAE according to the codebook size, respectively. On the Figures 6 (a-d) and 7 (a-d), we see that the compression using the DChT outperform the compression using the DWhT. Regarding the Tables 1 and 2, the compression and decompression time for DChT are high than the compression and decompression time for DWhT. The time is an important evaluation characteristic of an algorithm. So we can notice that the compression performs with DWhT and our training method (K-means and split method) for vector quantization give the satisfactory compromise between all evaluation parameters and quality of the reconstructed image. We tested our algorithm on four medical images. Now we give a big data architecture based on Spark framework to compress many images at the same time. Spark framework is increasingly used finally to implement architectures enable to perform these tasks. This because it facilitates the implementation of algorithms with its embedded libraries. In the architecture of Figure 8, the images that are input are already diagnosed, validated and stored in small databases (DB) dedicated to each kind of image. As an example case, we took the database containing the images "Pelvis" patients. This DB is finally divided into several clusters to apply a parallel programming. The Map function allows searching for images having the same spectral properties and, to group them together using the Reduce by Key function. The Reduce by Key function keeps images that have the same spectral property together. Then, the compression is applied to these images with a codebook length adapted to each category of image group. At the end of this architecture, we have the Reduce function which prepares the compressed data and saves the compressed index and the dictionary in the clusters. Hence a DB intended for the backup of the compressed image data.

Figure 6a: Pelvis MSSIM according to codebook size of medical images test.

Figure 6b: Head MSSIM according to codebook size of medical images test.

Figure 6c: Abdomen MSSIM according to codebook size of medical images test.

Figure 6d: Strange Body MSSIM according to codebook size of medical images test.

Figure 7a: Pelvis MAE according to codebook size of medical images test.

Figure 7b: Head MAE according to codebook size of medical images test.

Figure 7c: Abdomen MAE according to codebook size of medical images test.

Figure 7d: Strange body MAE according to codebook size of medical images test.

Figure 8: Spark map reduce pipeline for biomedical image compression.
Figure 8 defines all the sequence of the compression process of our images in the Spark. Thus, we need to design our algorithms and functions to use. Note here that our developed architecture in Figure 8 can be adapted to stand out all the Spark architecture of the workflow presented in [3].
Discussion
This paper relies on a comparison study, and it was difficult for us to compare our algorithm with a different algorithm found in the literature. Indeed, to perform an optimal comparison, we have to find in the literature, algorithms implemented on the same images as us. However, this is very difficult. To overcome this drawback, we finally implemented our algorithm on the same images as seen in the literature to conclude. Thus, we have seen in literature many works that use vector quantization with a training method to train an optimal codebook. Table 3 presents the comparison between our proposed algorithm and algorithms proposed in [16-18].
In Table 3, we compare our compression algorithm with these three previously cited works according to PSNR and computation time (compression time+decompression time). Figure 9 (a-d) shows the used images for this comparison. Table 3 Performance comparison (PSNR and CT) between the introduced methods and the Horng [18], Chiranjeevi et al. [17] and Chiranjeevi et al. methods.

Figure 9a: Lena images for comparison.

Figure 9b: Peppers images for comparison.

Figure 9c: Baboon images for comparison.

Figure 9d: Goldhill images for comparison.
In Table 3, we observe the variation of PSNR and computation time according to codebook size (64, 128, 256, and 512). We notice that, when the codebook size equal to 64, the PSNR of our method is less than FF-LBG, CS-LBG and BA-LBG methods. However, our methods (DWhT and DChT) achieve with the best computation time (average equal to 4.10 seconds). When the codebook size increase, the introduced method gives good parameters. For example, for codebook size equal to 256, we see that our method outperforms FF-LBG, CS-LBG and BALBG methods in a term of PSNR and computation time. For a codebook size equal to 512, the PSNR of images is infinite with both methods. This proves that compression is achieved with no loss of information and show the efficiency of our both methods. From the observations of Table 3, computational time of both methods is very less compared to all other algorithms but has lesser PSNR and bad reconstructed image (this only for codebook size equal to 64). The average computation time of both methods is around 40 seconds faster than the FF-LBG, CS-LBG and BA-LBG methods.
Figure 10 (a-c) shows us a better comparison using a bar chart of our methods and FF-LBG, CS-LBG and BA-LBG methods in a term of PSNR with a codebook size equal to 64, 128 and 256. We haven’t made a bar chart with a codebook size equal to 512 because using both methods the PSNR equal to infinity. We compared our compression methods with FF-LBG, CS-LBG and BA-LBG methods from [16-18]. Where in this three works, the authors used the Firefly algorithm, Cuckoo search algorithm and Bat algorithm respectively to optimize the codebook for vector quantization to improve the quality of the reconstructed image and computation time. We noticed that for a codebook size equal to 64 or 128, our methods (DWhT and DChT) gives almost the same evaluation parameters with these three methods. However, when the codebook size is 256, our compression methods outperform compression methods presented in [16-18]. To perform all these comparisons, we have applied our compression algorithms on the same images used in these works. The computation time gives us an addition to the effectiveness of our method, which is tiny, compared to the three other methods.

Figure 10a: Comparison between DWhT, DChT, FF-LBG, CS-LBG, BALBG algorithms based on PNSR with codebook size 64.

Figure 10b: Comparison between DWhT, DChT, FF-LBG, CS-LBG, BALBG algorithms based on PNSR with codebook size 128.

Figure 10c: Comparison between DWhT, DChT, FF-LBG, CS-LBG, BALBG algorithms based on PNSR with codebook size 256.
Mata et al. introduced many methods for image compression based on K-means and other optimization methods for vector quantization. We compare here our compression method with the two best compression method introduced by in [13]. Fuzzy K-means Family 2 with Equal-Average Nearest Neighbor Search (FKM2-ENNS) and Modified Fuzzy K-means Family 2 with Partial Distortion (MFKM2-PDS). The comparison is based on two images, Lena and Goldhill using two evaluation parameters, PSNR and SSIM. Table 4 shows a summary of obtained results for this comparison and Figures 11 (a,b) and 12 (a,b) the graphical representations. Regarding Table 4, Figures 11 (a,b) and 12 (a,b), we notice that when the codebook size equals to 64 the Mata Method outperforms ours. This explained because not all the clusters got by generating the codebook are yet equiprobably. However, when the codebook size increases, there is equiprobability between the clusters and therefore our method outperforms that of Mata.

Figure 11a: Comparison between DWhT, DChT, FKM2-ENNS, MFKM2-PDS algorithms based on PNSR of Lena.

Figure 11b: Comparison between DWhT, DChT, FKM2-ENNS, MFKM2-PDS algorithms based on PNSR of Goldhill.

Figure 12a: Comparison between DWhT, DChT, FKM2-ENNS, MFKM2-PDS algorithms based on SSIM in Goldhill.

Figure 12b: Comparison between DWhT, DChT, FKM2-ENNS, MFKM2- PDS algorithms based on SSIM in Lena.
Conclusion
Throughout this paper, we tried to show the importance to build a satisfactory compression scheme to compress biomedical images for big data architecture. We have shown our overall results by comparing performance parameters for the compression algorithms. Our Spark architecture shows us how we can implement the introduced algorithm and compress biomedical images. This architecture is more complete, easier, and adaptable in all the steps as compared with those proposed in the literature. We based the work on a MATLAB environment to simulate our compression algorithm. By calculating the evaluation parameter, we notice that the PSNR, MSSIM and CR give us the good values according to the codebook size. Regarding the obtained parameters during the comparison, we can notice that our method is better than literature method and give the good compromise between all the evaluation parameters. This comparison proves the efficiency of our compression algorithms. This work achieves with eight evaluation parameters, that are many than those used in [13,16-18,53] where the authors used three or four evaluation parameters. As future work, we propose to make a data preprocessing using an unsupervised algorithm finally to have a codebook model and use a supervised learning to reduce codebook computation time for each image during the vector quantization step.
Acknowledgement
The authors are very grateful to anonymous referees for their valuable and critical comments which helped to improve this paper. The authors are very grateful to Mrs. Talla Isabelle from linguistic center of Yaounde, Mr. Ndi Alexander and Mrs. Feuyeu from SUP’PTIC for improving the overall English level and mistakes within our manuscript. The authors would like to acknowledge Dr. Kengne Romanic from UR-MACETS and Inchtech’s Team for their support and assistance during the conception of that work.
Funding and Competing Interests
We wish to confirm that there are no known conflicts of interest associated with this publication and there has been no significant financial support for this work that could have influenced its outcome.
Ethical Approval
This article does not contain any studies with human participants and/ or animals performed by any of the authors.
References
- Bendre MR, Thool VR (2016) Analytics, challenges and applications in big data environment: a survey. JMA 3: 206-239.
- Liu F, Hernandez-Cabronero M, Sanchez V, Marcellin MW, Bilgin A (2017) The current role of image compression standards in medical imaging. Information 8: 131.
- Tchagna Kouanou A, Tchiotop D, Kengne R, Djoufack TZ, Ngo Mouelas AA, et al. (2018) An optimal big data workflow for biomedical image analysis. IMU 11: 68-74.
- Sayood K (2006) Introduction to data compression. Morgan Kaufmann, San Francisco.
- Singh SK, Kumar S (2010) Mathematical transforms and image compression-a review. Maejo Int J Sci Technol 235-249.
- Salomon D, Concise A (2008) Introduction to data compression. Verlag, London.
- Farelle P (1990) Recursive block coding for image data compression. Verlag, New York.
- Starosolski R (2014) New simple and efficient color space transformations for lossless image compression. J Vis Commun Image R 25: 1056-1063.
- Taubman D, Marcellin M (2002) JPEG2000 Image compression fundamentals, standards and practice. KAP.
- Azman A, Sahib S (2011) Spectral test via discrete tchebichef transform for randomness. Int J of Cryptology R 3: 1-14.
- Prattipati S, Swamy M, Meher P (2015) A comparison of integer cosine and tchebychev transforms for image compression using variable quantization. JSIP 6: 203-216.
- Phanprasit T, Hamamoto K, Sangworasil M, Pintavirooj C (2015) Medical image compression using vector quantization and system error compression. IEEJ Trans Electr Electr Eng 10: 554-566.
- Mata E, Bandeira S, Neto PM, Lopes W, Madeiro F (2016) Accelerating families of fuzzy k-means algorithms for vector quantization codebook design. Sensors 16: 11.
- Jiang H, Ma Z, Hu Y, Yang B, Zhang L (2012) Medical image compression based on vector quantization with variable block sizes in wavelet domain. Comput Intell Neurosci 5.
- Lu T, Chang C (2010) A survey of vq codebook generation. JIHMSP 190-203.
- Chiranjeevi K, Jena UR (2016) Image compression based on vector quantization using cuckoo search optimization technique. Ain Shams Eng J.
- Chiranjeevi K, Jena UR (2016) Fast vector quantization using a bat algorithm for image compression. JESTECH 19: 769-781.
- Horng MH (2012) Vector quantization using the firefly algorithm for image compression. Expert Syst Appl 39: 1078-1091.
- Hosseini SM, Naghsh-Nilchi AR (2012) Medical ultrasound image compression using contextual vector quantization. Comput Biol Med 42: 743-750.
- Hussein Abouali A (2015) Object-based vq for image compression. Ain Shams Eng J 6: 211-216.
- Kesavamurthy T, Rani S, Malmurugan N (2009) Volumetric color medical image compression for pacs implementation. IJBSCHS 14: 3-10.
- Mukundan R (2006) Transform coding using discrete tchebichef polynomials. VIIP 270-275.
- Nakagaki K, Mukundan R (2007) A fast 4x4 forward discrete tchebichef transform algorithm. IEEE Signal Processing Letters14: 684-687.
- Ernawan F, Abu NA (2011) Efficient discrete tchebichef on spectrum analysis of speech recognition. IJMLC 1: 1-6.
- Xiao B, Lu G, Zhang Y, Li W, Wang G (2016) Lossless image compression based on integer discrete tchebichef transform. Neurocomputing 214: 587-593.
- Gegum AHR, Manimegali D, Abudhahir A, Baskar S (2016) Evolutionary optimized discrete tchebichef moments for image compression applications. Turk J Elec Eng Comp Sci 24: 3321-3334.
- Abu NA, Wong SL, Rahmalan H, Sahib S (2010) Fast and efficient 4 × 4 tchebichef moment image compression. MJEE 4: 1-9.
- Chirikjian GS, Kyatkin AB (2000) Engineering applications of noncommutative harmonic analysis: with emphasis on rotation and motion groups. CRC Press.
- Karagodin MA, Polytech T, Russia U, OsokinAN (2002) Image compression by means of walsh transform. IEEE MTT 173-175.
- Gersho A (1982) On the structure of vector quantizers. IEEE Trans Inf Theory 28.
- Gray RM (1984) Vector Quantization. IEEE ASSP Magazine 4-29.
- Linde Y, Buzo A, Gray RM (1980) An algorithm for vector quantizer design. IEEE Trans Commun 28: 84-95.
- Le Bail E, Mitiche A (1989) Vector quantization of images using kohonen neural network. EURASIP 6: 529-539.
- Wang Y (2013) Ecg compression using the context modeling arithmetic coding with dynamic learning vector-scalar quantization. Biomed Signal Process Control 8: 59-65.
- Meng J (2008) A 2-d ecg compression algorithm based on wavelet transform and vector quantization. Dig Sig Processing 18: 179-188.
- De A, Guo C (2015) An adaptive vector quantization approach for image segmentation based on som network. Neurocomputing 149: 48-58.
- Laskaris NA, Fotopoulos S (2004) A novel training scheme for neural-network based vector quantizers and its application in image compression. Elsevier Neurocomputing 61: 421-427.
- Wu H, Yang S, Huang Z, He J, Wang X (2018) Type 2 diabettes mellitus prediction model based on data mining. IMU 10: 100-107.
- Thaina A, Tosta A, Neves LA, Do Nascimento MZ (2017) Segmentation methods of h and e-stained histological images of lymphoma-a review. IMU 9: 35-43.
- Setiawan AW, Suksmono AB, Mengko TR (2009) Color medical image vector quantization coding using k-means: retinal image. IFMBE 23: 911-914.
- Franti P, Kaukoranta T, Nevalainen O (1997) On the splitting method for vector quantization codebook generation. Opt Eng 36: 3043-3051.
- Huffman D (1952) A method for the construction of minimum-redundancy codes. IRE 40: 1098-1101.
- Nandi U, Kumar Mandal J (2012) Windowed huffman coding with limited distinct symbols. Procedia Techno 4: 589-594.
- Kartheeswaran S, Dharmaraj D, Durairaj C (2017) A data-parallelism approach for pso-ann based medical image reconstruction on a multi-core system. IMU 8: 21-31.
- Ayoobkhan MUA, Chikkannan E, Ramakrishnan K (2017) Lossy image compression based on prediction error and vector quantisation. EURASIP J Image Video Process 35: 1-13.
- Ananthi VP, Balasubramaniam P (2016) A new image denoising method using interval-valued intuitionistic fuzzy sets for the removal of impulse noise. Sig Pro 121: 81-93.
- Wang Z, Bovik CA, Sheikh HR, Simoncelli EP (2004) Image quality assessment: from error visibility to structural similarity. IEEE TIP 13: 600-612.
- Hore A, Ziou D (2010) Image quality metrics: psnr vs. ssim. IEEE International Conference on Pattern Recognition 2366-2369.
- Wang Z, Bovik CA (2002) A universal image quality index. IEEE Sig Pro Letters 9: 81-84.
- Mathworks. Big data with MATLAB: MATLAB, tall arrays, and spark.
- Mathworks, predictive analytics with MATLAB: unlocking the value in engineering and business data (2018) mathworks 11.
- Grgic S, Grgic M, Cihlar BZ (2001) Performance analysis of image compression using wavelets. IEEE Trans Ind Electron 48: 682-695.
- Tchagna Kouanou A, Tchiotsop D, Tchinda R, Tchapga TC, Kengnou TAN, et al. (2018) A machine learning algorithm for biomedical image compression using orthogonal transforms. IJIGSP 10: 38-53.

Open Access Journals
- Aquaculture & Veterinary Science
- Chemistry & Chemical Sciences
- Clinical Sciences
- Engineering
- General Science
- Genetics & Molecular Biology
- Health Care & Nursing
- Immunology & Microbiology
- Materials Science
- Mathematics & Physics
- Medical Sciences
- Neurology & Psychiatry
- Oncology & Cancer Science
- Pharmaceutical Sciences