ISSN : 2393-8854
Global Journal of Research and Review
Urban Growth and Housing Problems in Karu Local Government Area of Nasarawa State, Nigeria
1Department of Geography, Ahmadu Bello University, Zaria, Nigeria
2Department of Geography, Federal College of Education, Zaria, Nigeria
3Department of Environmental Health Science, Shehu Idris College of Health Sciences and Technology, Makarfi, Nigeria
4Department of Urban and Regional Planning, Nuhu Bamalli Polytechnic, Zaria, Nigeria
Abstract
The study examined urban growth and housing problems in Karu Local Government Area of Nasarawa State in Nigeria. Questionnaire survey was used to acquire primary data which was complemented with secondary data. The respondents for the questionnaire survey comprised of the residents, government officials, and other stake holders in urban and housing development in the area. A total of 300 questionnaires were administered using stratified and random sampling techniques. Data was analyzed using descriptive statistics and correlation analysis. Findings revealed a strong correlation between urban growth and housing problems in the area. The study also identified housing problems such as overcrowding and congestion, poor accessibility, substandard and inadequate housing, as well as insufficient basic amenities and infrastructural facilities in the area. There is the need for government to plan for future urban expansion of Karu in order to avoid urban sprawl leading to more housing problems in the area. One approach to this is the development of satellite towns with good accessibility to the city centre. There is also the need for provision of basic amenities and infrastructural facilities and utilities that are lacking in the area.
Keywords
Urban growth, Urban sprawl, Housing problems, Field survey, Correlation matrix.
Introduction
Urbanization is the increasing number of people in urban areas resulting to the development of towns and cities. This is usually as a result of the movement of people from rural to urban areas leading to population growth in towns and cities [1]. Urbanization is not only characterized by demographic change but involves social change, technological advancement and economic transformation. These changes are influenced by social, political and geographical factors and therefore vary from one geographical location to another.
Urbanization is increasing rapidly in most African countries [2], and the major factors for the rapid increase relate to largescale migration from rural areas to the urban areas for better economic opportunities. Other factors are natural increase of the population, and uneven concentration of investments by governments and private organizations [3,4] in the cities compared to rural areas.
Housing is a residential structure where man lives and grows. It is therefore universally acknowledged as one of the most basic human needs for survival [5] on the surface of the Earth. The demand for housing has been an issue of global concern as the housing provision still remains one of the most difficult problems facing humanity [6]. It is reported that more than one billion people, i.e. about one quarter of the world population live without shelter or in unhealthy and unacceptable housing conditions [7]. The most adversely affected by inadequate or lacks of housing are the urban poor, who constitute the majority in the developing countries [2].
According to a United Nations Report, the developing countries of Africa and Asia consist of cities which now account for over 90 percent of the world urban population growth [2]. Despite the rapid rate of urbanization in developing countries like Nigeria, evidence revealed a rapid decrease in the provision of new housing, as well as poor state and inadequate urban housing infrastructures to support the increasing population [8,9]. Therefore, in developing countries where there is rapid urbanization, the problem of inadequate housing for the people constitutes one of the major challenges to economic development and the welfare of the citizens.
The Draft of the National Urban Development Policy [10] notes that Nigerian towns are growing without adequate planning. Besides, urbanization in Nigeria is characterized by unplanned growth, deteriorating infrastructure and inadequate housing. In addition, Abiodun and Segun (2005) [11] assessed the housing conditions in a typical Nigerian town. They found that most of the houses fall short of the basic requirements of decent accommodation and are therefore not conducive for human habitation.
Moreover, Amao (2012) [12] examined the rate of urbanization, housing quality and environmental degeneration in Nigeria. He discovered that poor housing quality has serious adverse effects on the environment and the health of city residents. Bhatta (2010) [13] highlighted the negative impact of urban growth on the environment which includes increased temperature, poor air quality, impact on water quality and quantity and impact on public health. Similarly, Oyeleye (2013) [14] observed that the challenges of urban growth in Nigeria include housing problems, food insecurity and climate change which all have impact on the environment and livelihood. Similarly, Chindo (2013) [15] analyzed the spatial growth of the greater Karu Urban area. He discovered that the consequences of urban growth could be positive or negative. The positive impact includes increasing GNP and increasing recognition. However, the negative impact includes unplanned growth and dilapidated houses.
The settlements in Karu Local Government Area like many other settlements around the Federal Capital Territory (FCT) Abuja in Nigeria are experiencing unprecedented and rapid rate of urbanization. The relocation of the FCT to Abuja in 1991 and the proximity of the settlements around the territory brought sudden economic prosperity to the area, and these have transformed Karu from a remote rural settlement to a vibrant urban area. As a development corridor to the FCT for more than two decades, Karu has become one of the fastest growing urban areas in Nigeria. It has an annual growth rate of over 40% owing to the rapid rate of urban growth and economic development principally as a result of the influx of migrants from other parts of the country [16]. The objective of this study is to examine the relationship between urban growth and housing problems in Karu Local Government Area with a view to identify the housing problems resulting from urbanization in the area, and proffer solutions to the problems.
Research hypothesis
Ho: there is no significant relationship between urban growth and housing problems in Karu Local Government Area of Nasarawa State in Nigeria.
The study area
Karu Local Government Area of Nasarawa State is located between latitudes 8° 5’ N and 10° 42’ N and longitudes9° 25’E and 7° 54’E of the Greenwich Meridian as shown in Figure 1. Karu is an unplanned area covering a spatial extent of about 800sqkm [17]. It extends from the eastern boundary of the Federal Capital Territory Abuja (Old Nyanya) to Gora about 15 kilometers to Keffi as shown in Figure 1.

Figure 1: Map of Karu showing the area of study
The area has an estimated population of 10,000 in 1991, and is believed to have grown rapidly to an estimated population of 50,000 and 130,000 by 2001 and 2010 respectively; due to continuous migration of people from other parts of the country to this area [18]. Its current population is estimated at 205, 477.
Karu is located within a broad gentle rolling undulating plain with elevation ranging from 300 to 500 meters above sea. The soils derived from this bedrock structure are generally deep and well drained with high fertility rating and variable run-off potential, with variations mainly along the stream-beds where the soils are higher in clay content [18]. The natural vegetation in the area is of the park savannah type, featuring dense tropical woodland with shrubs and grasses; with variations reflecting the influence of local conditions such as relief, soil, and recently the effect of human activities. The area has two distinct seasons (wet and dry), typical of north-central Nigeria. The spatial pattern of rainfall in the study area is slightly influenced by the north central highlands with a mean annual rainfall between 1100mm to about 2000mm [18]
Karu is cosmopolitan in nature with various ethnic groups living together in harmony. The major indigenous ethnic groups in the area are Gbagyi, Koro, Yeskwa, Gwandara and Gade. There are many settlers comprising of Mada, Eggon, Hausa-Fulani, Igbo, Tiv, Yoruba who migrated to take advantage of the economic potentials in the area [19]..
Materials and Methods
Types and sources of data
The method that was used in this study is qualitative approach which includes the use of questionnaire, interviews and observation to obtain primary data.
Secondary sources of data include books, journals, and theses.
The questionnaire was designed to obtain information on the nature of urban growth and housing problems in seven selected districts of Karu. The questionnaire was administered to the households in the area. In addition, interview was carried out with traditional rulers, urban developers, housing experts and staff of Karu Development Planning Authority (KAPDA) in order to obtain appropriate information on the subject of study.
Sampling frame
In order to select respondents for the questionnaire survey, the seven districts of Karu were considered. The districts are Mararaba, One-Man Village, Ado, New Nyanya, Masaka, Kuchikua and Auta balefi. Krejcie and Morgan (1970) [20] method of sampling was used to determine the sample size which is equal to 300. Out of this, 260 questionnaires were administered to the residents in the area. The number of questionnaires administered in each district is proportional to the population size of the district as shown in Table 1. The districts were then stratified and respondents were randomly selected from each stratum. The remaining 40 questionnaires were administered to the stakeholders or experts in the area of study as shown in Table 2.
Table 1. Sampled districts in the area of study
| Districts | Population Size | No of Questionnaires |
|---|---|---|
| Mararaba | 3692 | 52 |
| One man village | 1675 | 22 |
| Ado | 343 | 5 |
| New nyanya | 931 | 14 |
| Masaka | 11286 | 135 |
| Kuchikau | 1845 | 26 |
| Auta balefi | 432 | 6 |
| Total | 20204 | 260 |
Source: Nasarawa State Urban Development Board (NUDB)21
Table 2. Respondents from stakeholders
| District heads | 7 |
| Village heads | 3 |
| Surveyors | 3 |
| Architectural officer | 6 |
| Builders | 4 |
| Demographer | 2 |
| Total | 40 |
Method of data analysis
The data collected for this study was analyzed using descriptive and inferential statistics. Correlation analysis was employed to determine the relationship between urban growth and housing problems in the area. Percentage was used to highlight the nature of the housing problems in the area.
Results and Discussion
Socio- demographic characteristics of the respondents
Ekop (2012) [22] found that there is relationship between housing condition and socio-economic profile of urban dwellers. The following sections outline the socioeconomic profiles of the respondents in this study.
Before the establishment of Abuja as the Federal Capital Territory (FCT) in 1975 and eventual relocation from Lagos to the FCT in 1991, Karu area was a typical agrarian settlement occupied by mostly farmers who specialize in the production of yam and other grains. However, the influx of people from different parts of the country into the area has resulted into significant changes in the socio-economic activities in the area. Table 3 shows that currently, about 37% of the respondents are traders, about 30% are civil servants, and about 7% each are either unemployed or engaged in other jobs such as eateries and communication services. The fact that only about 18.6% of the respondents are now engaged in agriculture is an evidence of urbanization and demographic transformation in the area.
Table 3. Occupation of respondents
| Occupation | Frequency | Percent | Valid Percent | Cumulative Percent | |
|---|---|---|---|---|---|
| Valid | Farmer | 48 | 18.6 | 18.6 | 18.6 |
| Trading | 96 | 37.2 | 37.2 | 55.8 | |
| Civil | 77 | 29.8 | 29.8 | 85.7 | |
| Unemployed | 19 | 7.4 | 7.4 | 93.0 | |
| Others | 18 | 7.0 | 7.0 | 100.0 | |
| Total | 258 | 100.0 | 100.0 |
The income distribution of respondents as shown in Table 4 suggests that 37.6% of the respondents earn N21,000 and above per month, followed by those who earn N11,000- 20,000 which constitute 31%, and 27.5% of them earn N1,000- 10,000 monthly. This indicates that most of the respondents are low income earners and are finding it difficult to live in the region of the FCT which is very expensive. This conforms to the view that inadequate housing in Nigeria is a manifestation of poverty [23] because majority of the people earn low income and could not afford the rising cost of accommodation in towns and cities.
Table 4. Average monthly income of respondents
| Average monthly income | Frequency | Percent | Valid Percent | Cumulative Percent | |
|---|---|---|---|---|---|
| Valid | N1000-10000 | 71 | 27.5 | 28.6 | 28.6 |
| N11000-20000 | 80 | 31.0 | 32.3 | 60.9 | |
| N21000 and above | 97 | 37.6 | 39.1 | 100.0 | |
| Total | 248 | 96.1 | 100.0 | ||
| Missing | System | 10 | 3.9 | ||
| Total | 258 | 100.0 | |||
Education is a human capital asset required for human capital development.
Results of the field survey as presented in Table 5 illustrates that close to 44% of the respondents attended secondary school, followed by those who attended higher educational institutions constituting about 34%, those with primary school education are 15.5%. This study revealed that the literacy level among the inhabitants of Karu is higher than that of slum dwellers in Akure town of southwestern Nigeria, where more than half of the people are illiterate and only about 8% of them have higher educational qualifications [24].
Table 5. Level of education of respondents
| Educational level | Frequency | Percent | Valid Percent | Cumulative Percent |
|---|---|---|---|---|
| Primary | 40 | 15.5 | 15.5 | 15.5 |
| Secondary | 113 | 43.8 | 43.8 | 59.3 |
| Tertiary | 88 | 34.1 | 34.1 | 93.4 |
| Others | 17 | 6.6 | 6.6 | 100.0 |
| Total | 258 | 100.0 | 100.0 |
Nature of urban growth in Karu from 2006 to 2014
The rate of urbanization varies from one place to another because it is influenced by geographical and other factors. For some towns and cities in Nigeria, the rate of urbanization could be described as slow or moderate. However, over 90% of the respondents described Karu urban growth as rapid. This rapid rate of growth is as a result of rural to urban migration as opined by 65% of the respondents, while 12.5% each either attributed the rapid rate of growth of Karu to proximity to Abuja/work place or lower cost of living compared to Abuja. While about 10% of the respondents attributed the growth of Karu to increased economic activities in the area. This is in agreement with the finding of Xizshe et al. (2009) [25] which discovered that urbanization is caused by economic expansion resulting from rural urban migration over time.
Nature of housing in Karu
Table 6 shows that about 62% of the respondents live in rented houses, while 30% of them live in their own houses, and only about 7% of them live in government quarters.
Table 6. Ownership of accommodation
| Frequency | Percent | Valid Percent | Cumulative Percent | ||
|---|---|---|---|---|---|
| Valid | Rental | 159 | 61.6 | 61.6 | 61.6 |
| Owned | 78 | 30.2 | 30.2 | 91.9 | |
| Government quarters | 18 | 7.0 | 7.0 | 98.8 | |
| Others specify | 3 | 1.2 | 1.2 | 100.0 | |
| Total | 258 | 100.0 | 100.0 |
Types of housing units in the area
Results showed that 27.5% of the respondents occupy single rooms in a compound as presented in Table 7, 25.6% of them stay in a self contained two bed room flat, while 22% of the respondents live in a self contained one bed room flat, and only 17% of them stay in a self contained three bed room. This shows that most of the respondents live in single room in a compound because they cannot afford a more decent accommodation.
Table 7. Type of accommodation
| Frequency | Percent | Valid Percent | Cumulative Percent | ||
|---|---|---|---|---|---|
| Valid | Self contained and one bed room flat | 57 | 22.1 | 22.1 | 22.1 |
| Self contained two bed room flat | 66 | 25.6 | 25.6 | 47.7 | |
| Self contained three bed room flat | 44 | 17.1 | 17.1 | 64.7 | |
| Single room in the compound | 71 | 27.5 | 27.5 | 92.2 | |
| Two or more rooms in the compound | 20 | 7.8 | 7.8 | 100.0 | |
| Total | 258 | 100.0 | 100.0 |
In addition, 38% of the respondents reported that they live together as 3-4 people per dwelling unit, about 23% mentioned that they are about 5-6 persons per unit, 12% mentioned 7-8 people per accommodation, only 7% of them live as 9 or more people in a unit, and 19% of them mentioned between 1-2 persons per dwelling unit.
Amenities and utilities in Karu housing units
Close to 60% of the respondents rely on the national grid as their source of power, while about 28% use generators and about 14% of the respondents don’t have power in their dwelling units.
Besides, it was found that most of the households constituting about 39% of them use well as their main source of water, while 38% of the respondents use tap, and about 28% of the respondents rely on water vendors; only about 1% use stream as a source of water.
Moreover, results showed that 60% of the respondents have exclusive kitchen in their homes while 30% of them have shared kitchen; and about 10% of them cook in the compound or in their rooms. This is actually unhealthy for the inhabitants of the house.
Table 8 indicates that 58% of the respondents have flushing type of toilet, 30% of them have pit latrine, while about 9% of them have bucket toilet; and about 3% don’t have any toilet but ease themselves in nearby bushes and available open spaces in the area.
Table 8. Toilet facilities
| Frequency | Percent | Valid Percent | Cumulative Percent | ||
|---|---|---|---|---|---|
| Valid | Flush | 150 | 58.1 | 58.1 | 58.1 |
| Bucket toilet | 24 | 9.3 | 9.3 | 67.4 | |
| Pit latrine | 79 | 30.6 | 30.6 | 98.1 | |
| Others | 5 | 1.9 | 1.9 | 100.0 | |
| Total | 258 | 100.0 | 100.0 |
Urban growth and housing problems in Karu
Considering the nature of housing in the area, over 70% of the respondents indicated their plan to move to a better accommodation. This because 25% of the respondents are not comfortable with their accommodations which are actually located in poor environment; and long distance to work being the reason of 23% of the respondents, high rent as opined by19%, job transfer as mentioned by 12% of the respondents. Other housing problems include lack of toilet or kitchen in some compounds.
Furthermore, the respondents were asked to state the relationship between urban growth and housing problems in the area. About 26% of them complained of crowding of houses with little or no space between them, 12% mentioned the problem of accessibility in the area, and 10% mentioned poorly constructed houses; about 10% said shortage of housing and high rent value, while about 8% mentioned overcrowding and spread of diseases. This is in line with the finding of Oparaocha et al. (2009) [26] which established that poor housing conditions result to some common diseases among children in Owerri town of southeastern Nigeria. About 8% of the respondents mentioned criminal activities as the problems in the area, which Oyeleye (2013)14 observed as part of the challenges of urban growth in Nigeria. According to 7% of the respondents each, the problems of housing are either shortage of infrastructural facilities, or scarcity of houses, or traffic congestion, or lack of amenities and facilities respectively. However, only about 5% of the respondents mentioned environmental degradation as a problem in the area.
Correlation analysis
The correlation analysis was used to test whether there is significant relationship between urban growth and housing problems in Karu. The housing amenities such as toilet, kitchen, water and power supply were tested in relation to dwelling units or houses in the area. The calculated value of correlation coefficient and p-value were obtained by the use of inferential statistics as presented in Table 9.
Table 9. Correlation matrix table
| Problem facing urban and housing in karu | Causes of urban growth in karu | Type of dwellin g unit | Type of kitchen | What type of toilet facility do you have | What is your major source of power | What is the major source of water | ||
|---|---|---|---|---|---|---|---|---|
| Problem facing urban and housing in karu | Pearson Correlation Sig. (1-tailed) N | 1 257 |
.026 .342 257 |
.088 .079 257 |
-.089 .077 257 |
-.058 .178 257 |
.069 .136 257 |
.020 .374 257 |
| Causes of urban growth in karu L.G.A. | Pearson Correlation | .026 | 1 | -.121* | .008 | .075 | -.102 | -.088 |
| Sig. (1-tailed) | .342 | .027 | .447 | .116 | .051 | .079 | ||
| N | 257 | 258 | 258 | 258 | 258 | 258 | 258 | |
| What type of dwelling unit | Pearson Correlation | .088 | -.121* | 1 | .287** | .306** | .252** | .160** |
| Sig. (1-tailed) | .079 | .027 | .000 | .000 | .000 | .005 | ||
| N | 257 | 258 | 258 | 258 | 258 | 258 | 258 | |
| Type of kitchen | Pearson Correlation | -.089 | .008 | .287** | 1 | .378** | .214** | .132* |
| Sig. (1-tailed) | .077 | .447 | .000 | .000 | .000 | .017 | ||
| N | 257 | 258 | 258 | 258 | 258 | 258 | 258 | |
| What type of toilet facility do you have | Pearson Correlation | -.058 | .075 | .306** | .378** | 1 | .354** | .232** |
| Sig. (1-tailed) | .178 | .116 | .000 | .000 | .000 | .000 | ||
| N | 257 | 258 | 258 | 258 | 258 | 258 | 258 | |
| What is your major source of power | Pearson Correlation | .069 | -.102 | .252** | .214** | .354** | 1 | .305** |
| Sig. (1-tailed) | .136 | .051 | .000 | .000 | .000 | .000 | ||
| N | 257 | 258 | 258 | 258 | 258 | 258 | 258 | |
| What is the major source of water | Pearson Correlation | .020 | -.088 | .160** | .132* | .232** | .305** | 1 |
| Sig. (1-tailed) | .374 | .079 | .005 | .017 | .000 | .000 | ||
| N | 257 | 258 | 258 | 258 | 258 | 258 | 258 |
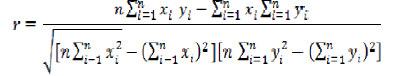
The correlation coefficient of the set of observation {(xi, yi,), i= 1…, n} was obtained using the formula:
Test of hypothesis
H0 = There is no significant relationship between urban growth and housing problems in karu local government area.
H1 = There is significant relationship between urban growth and housing problems in Karu local government area.
Conclusion
Since Pearson correlation = 0.026 which is between positive (+1) and negative (-1), is less than p-value of 0.342 as shown in Table 9, we therefore reject H0 and conclude that there is significant relationship between urban growth housing problems in the area.
H0 = There is no significant relationship between toilet types and the dwelling unit
H1 = There is significant relationship between toilet types and the dwelling unit.
Conclusion
Since p-value = 0.306 in this case, we therefore reject H0 and conclude that there is significant relationship between dwelling unit and toilet types.
H0 = There is no significant relationship between kitchen types and the types of house.
H1 = There is significant relationship between kitchen types and the types of house.
Conclusion
Since p-value = 0.287, we therefore reject H0 and accept H1 and conclude that is there is significant relationship between dwelling unit and kitchen.
H0 = There is no significant relationship between power supply and the dwelling unit.
H1 = There is significant relationship between power supply and the dwelling unit.
Conclusion
Since p-value = 0.252, we therefore reject H0 and conclude that power supply has a strong relationship with a dwelling unit.
H0 = There is no significant relationship between water supply and the dwelling unit.
H1 = There is significant relationship between water supply and the dwelling unit.
Conclusion
Since p = 0.162, we therefore, reject H0 and conclude that there is a significant relationship between dwelling unit and water supply in the area.
Solutions to the urban growth and housing problems in Karu area
Results of the field survey indicated that 31% of the respondents suggested the establishment of satellite towns with good road network to the city centre as a solution to problem of urban growth and housing problems in Karu, 25% advised that development of houses in the area should conform with the development standards of the Nasarawa State Urban Development Board (NUDB)21, close to 15% stressed the need for construction of more housing units in the area; while 14% suggested that more spacing of houses will reduce overcrowding of places and avoid the spread of diseases, and 9% of the respondents suggested the provision of infrastructures in rural areas to reduce rural urban migration. Other solutions as suggested by the respondents include provision of security, regular maintenance of government quarters, provision of access roads all over the town, and environmental education in the area.
Conclusions
Correlation analysis was used to test the relationship between urban growth and housing problems in Karu Local Government Area of Nasarawa State. Urban growth was found to be positively correlated with housing problems in the area. This corroborated with the views of the residents in the area who identified the housing problems in order of prominence as overcrowding of houses leading to spread of diseases, poor accessibility resulting to congestion, poorly constructed housing leading to proliferation of dilapidated houses, shortage of housing resulting to high rent value in the area.
Recommendations
Nasarawa State Urban Development Board (NUDB) should enforce the development control standards in the area. The board should also study the current growth pattern in the area in order to plan for future urban expansion and avoid haphazard urban sprawl in the area. The development of satellite towns with good road network to the city centre is hereby proposed to achieve orderly growth and development of the city and its regions. Provision of basic amenities and infrastructural facilities and utilities is very necessary to reduce housing problems in the Karu area.
References
- United Nations Department of Public Information, 2008: Achieving the Millennium Development Goals in Africa- Recommendations of the MDG Steering Group. Retrieved from: https://www. mdgafrica.org.pdf, on March 2009.
- UN-Habitat, 2006: Milestones in the evolution of human settlements policies: 1976-2006, State of the world cities. The MDGs and urban sustainability. 30 years of shaping the Habitat Agenda. UK: Earthscan.
- Ajala, O.A., 2005: Environmental Impact of Urbanization: The challenges to Urban Governance in Nigeria. In Fadare, W., Ajayi, A., Amole, D. and Babalola, B. (eds.). Proceedings of the Conference on Globalization and Culture in Nigeria.
- Jiboye, A.D. and Omoniyi, S.S., 2010: Environmental Sustainability and urban growth in Nigeria. Proceedings of International Conference on Engineering Research and Development, 1(2). Port- Harcourt, Nigeria.
- Akingbohungbe, D. O. and Akinluyi, M.L., 2012: Residents’ Perception of off Campus students’ Housing Performance in Ile-Ife, Nigeria. Journal of Environment and Earth Science. Vol. 2, No. 7, pp 69-76.
- Konadu-Agyemang, K., Noonam, J.M., and McCord, D., 1994: Social Housing and Social Integration in the Durham Region of Ontario, Canada. Ekistics, 367, 145-155.
- United Nations, 1997: The State of World Population. UNFPA – United Nations Population Fund.
- Aguda, A.S. and Ajala, O.A., 1998: Servicing Large and Medium-Sized Urban Centres. Ife Social Sciences Review, 15(1), 125.
- Jiboye, A., 2009: The Significance of Households’ Characteristics on Housing Quality in Nigeria. J. Geogr. Plann. Sci. (2): 1-10.
- NUDP, 2004: Draft National Urban Development Policy, Nigeria.
- Abiodun, P. B. and Segun, A. O., 2005: An Assessment of Housing Status in a Typical Nigerian Town. Journal of Applied Sciences, 5 (3): 437-440.
- Amao, F. L., 2012: Urbanization, housing quality and environmental degradation in Nigeria. Journal of Geography and Regional Planning, Vol.5 (16), 422-429.
- Bhatta, B., 2010: “Analysis of Urban Growth and Sprawl from Remote Sensing Data”. Advances in Geographic Information Science. Berlin Heidelberg: Springer- Verlag.
- Oyeleye, O. I., 2013: Challenges of urbanisation and Urban Growth in Nigeria. American Journal of Sustainable Cities and Society.
- Chindo, M. M., 2013: Geographical Study of the Spatial Growth of the Greater Karu Urban Area, Nasarawa State. Unpublished MSc thesis, Department of Geography, Ahmadu Bello University, Zaria, Nigeria.
- Rikko, S. L. and Laka, I. S., 2013: Monitoring urban sprawl in greater Karu urban area (GKua), Nasarawa state Nigeria. Journal of Environmental and Earth Science, Vol. 3(13).
- KAPDA, 2001: Karu Planning Development Area Report. Nasarawa, Nigeria.
- Yari, K., Madziga, B., Sani, M., 2002: Karu Governance and Management Institutions, Landuse Management and Urban Services Management. Karu Cities Alliance Initiative Technical Report for the UN-Habitat Component of Karu Development Strategy.
- Nasarawa State, 2010: Nasarawa State. Department of Geography and Planning, University of Jos, Nigeria.
- Krejcie, R.V. and Morgan, D.W., 1970: Determining sample size for research activities. Texas A and M. University: 607- 610.
- NUDB, 2014: Nasarawa State Urban Development Board. Lafia, Nigeria.
- Ekop, G., 2012: An assessment of the interrelationships among housing quality variable sets in Calabar metropolis. Journal of Geography and Reginal Planning, 5(14), pp. 375-380.
- Olotuah, A. O., 2009: “Demystifying the Nigerian Urban Housing Question”. Inaugural Lecture Series 53, delivered at Federal University of Technology, Akure, Nigeria.
- Omole, K. F., 2010: An Assessment of Housing Condition and Socio-economic Life Styles of Slum Dwellers in Akure, Nigeria. Contemporary Management Research, 6(4), pp. 273-290.
- Xizshe, P., Xiangning, C. and Yuan, C., 2009: Urbanization and its consequences. EOLSS, Vol. 2(2).
- Oparaocha, T., Evangeline, B. and Adrew, 2009: Assessment of housing conditions and association between housing conditions and some common diseases of the under- fives in Owerri municipal council, Imo state, Nigeria. African Journal of Applied Zoology & Environmental Biology, Vol. 11, 16-20.

Open Access Journals
- Aquaculture & Veterinary Science
- Chemistry & Chemical Sciences
- Clinical Sciences
- Engineering
- General Science
- Genetics & Molecular Biology
- Health Care & Nursing
- Immunology & Microbiology
- Materials Science
- Mathematics & Physics
- Medical Sciences
- Neurology & Psychiatry
- Oncology & Cancer Science
- Pharmaceutical Sciences