ISSN : 2574-0431
Synthesis and Catalysis: Open Access
Synthesis and Catalysis of Mixed Oxides on Mesoporous Mayenite for Biodiesel Production from Castor Oil (Ricinus communis)
Jerry L. Solis1,2*, Lucio Alejo1 and Yohannes Kiros3
1Centro de Tecnología Agroindustrial, Universidad Mayor de San Simón, Cochabamba, Bolivia
2Centro de Biotecnología, Universidad Mayor de San Simón, Cochabamba, Bolivia
3Department of Chemical Engineering, KTH Royal Institute of Technology, SE 100 44 Stockholm, Sweden
- *Corresponding Author:
- Jerry L. Solis
Centro de Biotecnología
UMSS Universidad Mayor de San Simon Cochabamba, Bolivia
Tel: +46 (0) 7283 80991
E-mail: jlsv2@kth.se
Received Date: October 01, 2018; Accepted Date: October 08, 2018; Published Date: October 22, 2018
Citation: Solis JL, Alejo L, Kiros Y (2018) Synthesis and Catalysis of Mixed Oxides on Mesoporous Mayenite for Biodiesel Production from Castor Oil (Ricinus communis). Synth Catal 3:5. DOI: 10.4172/2574-0431.100023
Abstract
Environmental concern has been driving the search for substitutes to the fossil based energy sources and has been pushing forward research for bolstering second generation biodiesel production processes. However, various challenges emerge from the use of such feedstocks, eg. in transesterification processes. The high content of free fatty acids and moisture in the precursor triglycerides are the major restraints for the transesterification reaction. For instance, Ricinus oil can be exploited by the use of a heterogeneous catalyst capable of maintaining high activity. This study shows the development of lithium and tin oxides catalysts supported on mayenite (Ca12Al14O33) for the transesterification of Ricinus oil with methanol (CH3OH). A basic characterization procedure was carried out to establish the quality of the obtained ricinus oil. Once the ricinus oil properties were assessed it was used for the transesterification reaction by catalysts synthesized with mixtures of Li2O, CaO, and SnO2 in different mass ratios. The best performance for the binary mixtures was obtained with 70/30 and 90/10% wt of CaO/SnO2 mass ratios at a temperature of 60°C with a methanol to oil molar ratio of 12:1 and a catalyst load of 5% wt in respect to oil. Furthermore, catalysts with Li2O and SnO2 were synthesized in mass ratios from 50/0 to 0/50% wt on a mesoporous mayenite. The synthesized catalysts were analysed by surface characterization techniques, such as N2-physisorption, NH3-desorption, and scanning electron microscopy (SEM). Furthermore, a central composite design with a response surface methodology was used to optimize the yield. The response surface methodology led to a maximum biodiesel yield of 85% with bare SnO2 on mayenite with 6% wt of a catalyst load in respect to oil, 60°C of a temperature, and 4:1 of a methanol to oil molar ratio. X-ray powder diffraction (XRD) and thermogravimetric analysis (TGA) were used to determine the state of the catalysts after carrying out the aging test of the catalysts in CH3OH.
Keywords
Biodiesel; Castor oil; Heterogeneous catalysts; Mayenite; SnO2; LiO2; CaO; Mixed oxides
Abbreviations
AOCS: American Oil Chemists’ Society; BET: Brunauer, Emmett, and Teller; BJH: Barret, Joyner, and Halenda; CCC: Central Composite Circumscribed; DIW: Deionized Water; DOE: Design of Experiment; FFA: Free Fatty Acid; GC: Gas Chromatography; PDF: Powder Diffraction File; SEM: Scanning Electron Microscopy; TGA: Thermogravimetric Analysis; TPD: Thermal Programmed Desorption; WCO: Waste Cooking Oil; XRD: X-ray Powder Diffraction.
Introduction
Amidst the increase of the regulations for lower combustion emissions and the evidence that a fossil fuel based economy is unsustainable through time, research for renewable and sustainable sources for our energy demands must be continuously enhanced. In a range of processes that take advantage of the energy content of biomass, the production of biodiesel still represents a huge opportunity to overcome the future energy demand. The combustion of biodiesel not only decreases gases such as CO, CO2, and sulphur oxides, but also is an opportunity to exploit other precursors that are otherwise unused or discarded as waste [1,2]. Non-edible oils and waste oils including waste cooking oil (WCO) among others have been identified as sustainable resources [3,4]. However, various challenges emerge from the use of such feedstocks for biodiesel production through transesterification processes, e.g. presence of high free fatty acid, high moisture content, and particulates.
Commonly called castor bean, the species Ricinus communis are originally from North-East Africa and the Middle East, but have spread throughout the tropics. The castor bean is a perennial herbaceous plant that belongs to the euphorbia family [5]. The species have drought and dresistance properties, which allows the plants to be grown on impaired, contaminated, or abandoned land [6,7]. The plant grows up to 3 m high, while the seeds vary in size from 15 to 25 mm long, along with a spiny or smooth epidermis. The oil content of the seeds may vary among the species and the breeding but it commonly ranges from 45 to 55% wt [8-10]. The content of the toxic protein, Ricin, also varies in between the species with an average of 1.6 and 35.0 mg of ricin per gram of mature seed. The plant cake has also been demonstrated to be useful for animal feed and production of refined chemicals [11-14], while the oil can be used for biodiesel production among other uses [1].
Ricinus oil is normally obtained by mechanical extrusion of the seeds from the plant Ricinus communis. The applications of the obtained oil have been vastly extended from cosmetics to high performance engine lubricants (Castrol R30 and R40) [9]. The industrialization of this specie has also led to an increased introduction for new crops, reaching the status of invasive pest in areas such as Hawaii, Australia, and the Galapagos Islands. Furthermore, the adaptability of the plant and the several applications of its products has induced the intensive introduction of the plant around the tropical areas of the world. The renewable policies have been increasingly motivating the implementation of crops like Castor bean for biodiesel production in several places [15]. One example is Brazil, where the policies have been intensively supporting the increase of the liquid biofuels production. As a result, the castor bean production is becoming steady and ever improved even where it was not traditionally grown [16-18]. Through governmental policies, the global market for Ricinus products has achieved 1378000 tonnes by the year 2014 culminating in 1777000 tonnes by 2016 [17] and is still projected to increase more by the years to come.
The main constituent of the ricinus oil is the ricinoleic acid, formally called 12-hidroxy-9-cis-octadecenoic acid. Ricinus oil has been reported to contain from 80 to 90% wt of this free fatty acid (FFA). It is noteworthy to specify that the hydroxyl group in the ricinoleic acid provides different properties for the oil including higher viscosity, polarity, lubrication, and miscibility [19]. These properties have also implications in the transesterification reactions, since the viscosity could cause mass transfer limitations, while the miscibility could increase the ease of interaction between the catalysts active sites and the reactants, i.e. ricinus oil and methanol. A possible hindering effect might be driven by the hydroxyl group, which should be considered as an important factor for the catalyst components and the catalytic reaction mechanism [20-22]. Previous studies describe the risks and difficulties associated with castor oil based biodiesel from the catalytic-reaction point of view. Such studies are guidelines for the increase in the sustainability and quality of the energy production as second generation feedstock [23-25]. Biodiesel production based on Ricinus oil has been studied by different reaction systems; i.e. homogeneous and heterogeneous catalysts, supercritical methods and enzymatic methods [22,26- 30]. Previously published work shows the suitability and the stability of the mayenite structure that offers the macro-porosity needed for the triglyceride and methanol molecules to interact at the catalyst active sites [31,32]. Likewise, lithium and tin oxides were previously reported to be catalytically active towards the biodiesel production from feedstock with high free fatty acid content [33-35]. This study deals with the production of biodiesel from Ricinus oil (Castor oil) with single or mixed oxide catalysts supported on mayenite, which has the advantages as a second generation feedstock. A set of analytical and characterization methods were used to substantiate the surface properties and morphological factors. The methods included X-ray powder diffraction, N2-physisorption, NH3-desorption, and others that describe the quality of the synthetized materials and products.
Experimental
Materials
The oil used for all the experiments was Ricinus oil (Ricinus communis) obtained from the local market in Santa Cruz, Bolivia. The reagents used for the catalyst syntheses and transesterification experiments include methanol puriss p.a. (≥ 99.8% GC, Sigma-Aldrich), aluminium nitrate nonahydrate ACS (≥ 98.0%, Sigma-Aldrich), isopropyl alcohol (≥ 99.7% FCC, Sigma-Aldrich), calcium hydroxide ACS (≥ 95.0%, Sigma-Aldrich), calcium carbonate (≥ 99.0 %, Sigma-Aldrich), lithium hydroxide monohydrate (≥ 98.5% BioXtra, Sigma-Aldrich), tin (II) chloride dihydrate ACS (≥ 98.0%, Sigma-Aldrich) and deionized water (DIW).
Ricinus oil characterization
The obtained Ricinus oil was dried for 24 h at 104°C to evaporate any possible water content present in the oil as it is obtained by cold-pressing of the seeds. The analysis of the Ricinus oil was on the physicochemical properties that include viscosity (ISO 12058), density (AOCS 985.19), iodine number (AOCS Cd 1-25), acidity by titration in mg of KOH (AOCS Ca 5a-40), peroxide value (AOCS Cd 8-53), saponifiable matter (AOCS Ca 5b-71), and relative moisture (AOCS Ca 2c-25) [36].
Synthesis of the Catalysts
Calcium and tin oxide catalysts
The catalysts for the transesterification reactions were mixed oxides of calcium (CaO) and tin (SnO2). The oxide mixture was synthesised considering the final catalyst compositions as shown in Table 1.
| CaO | SnO2 | |
|---|---|---|
| Catalyst | wt. % | wt. % |
| T1 | 50 | 50 |
| T2 | 70 | 30 |
| T3 | 90 | 10 |
Table 1: Catalysts based on the mixture of CaO and SnO2.
The tin oxide precursor (SnCl2) was dissolved in 70 mL of iso-propanol. On the dissolved SnCl2 solution, CaCO3 was added under continuous agitation. The mixtures were left for 2 h under continuous agitation. Afterwards, the solutions with the precipitates were placed in the oven for 20 h at 104°C until the sample reaches dryness. Once the sample was completely dry, it was ground in a mortar and placed in the furnace to follow the calcination scheme showed in Table 2. The calcination scheme was planned to reach the oxide formation temperatures, e.g. a temperature of 850°C for the CaCO3 decomposition to CaO [37,38]. At the end of the calcination, the obtained oxides were stored in tightly sealed vessels and kept until further analysis and use.
| Step | Temperature | Heat rate | Dwell time |
|---|---|---|---|
| °C | °C/min | min | |
| 1 | 300 | 5 | 120 |
| 2 | 550 | 5 | 120 |
| 3 | 850 | 2 | 300 |
Table 2: Thermal profile description for the catalyst synthesis.
Lithium and tin oxide catalysts
The catalysts for the next round of transesterification reactions were mixed oxides of lithium (LiO2) and tin (SnO2). The synthesized catalyst compositions are presented in Table 3. The lithium hydroxide as a precursor for Li2O was dissolved in 200 mL of DIW at room temperature. Meanwhile, the tin chloride was dissolved in 200 mL of ethanol 70% volume separately. When both solutions were dissolved, they were mixed together and 200 mL of DIW was added under continuous agitation and the mixtures were left agitating at room temperature overnight. Finally, the mixtures were placed in the oven until they reached dryness at 104°C for 20 h.
| Li2O | SnO2 | |
|---|---|---|
| Catalyst | wt. % | wt. % |
| T4 | 30 | 70 |
| T5 | 20 | 80 |
| T6 | 10 | 90 |
Table 3: Catalysts containing lithium and tin oxides mixtures.
Following this step, the mixtures were placed in the furnace for calcination [39] as described in Table 2. After the calcination was finished, the oxides were allowed to reach room temperature and were stored.
Mayenite support synthesis and impregnation of LiO2 and SnO2
The synthesis of mayenite was carried out by dissolving the precursors (calcium hydroxide and aluminium nitrate) in a 12:14 molar ratio. The procedure to prepare 20 g of mayenite started with the mixture of calcium hydroxide with 100 mL of DIW. The mixture was heated up to a temperature of 50°C and agitated for 30 min. The aluminium nitrate was mixed with 70 mL of iso-propanol and 30 mL of ethanol in a separate beaker. The Al(NO3)3 solution was continuously stirred for 30 min at a temperature of 50°C. Once both reagents showed quasi-homogeneous character, the suspended Ca(OH)2 was poured into the Al(NO3)3 solution. A volume of 100 mL of DIW was added to the mixture, as the temperature was increased up to 140°C and stayed for 30 min. The mixture was then placed into the oven at a temperature of 70°C for 6 h and further increased up to 104°C for 18 h. Once the mixture was completely dry, it was ground and placed into the furnace to heat up to 300°C in a rate of 5°C/min, dwelled for 2 h, then increased to 550°C at a rate of 5°C/min and it stayed for 2 h. The last temperature step was to increase the temperature up to 850°C in a rate of 2°C/min for a dwell time of 5 h.
After the mayenite was synthesized, the addition of the active phases was carried out to have the catalyst compositions described in Table 4. The lithium hydroxide (LiOH) was dissolved in deionized water, while the tin chloride (SnCl2) was dissolved in ethanol. After total dissolution of the chemicals, they were mixed together with mayenite for wet-impregnation. The mixtures were then placed into the oven for 24 h at 104°C. Once the mixtures were dry, the samples were placed into the furnace to follow the calcination scheme described in Table 2.
| Mayenite | LiO2 | SnO2 | |
|---|---|---|---|
| Catalyst | wt. % | wt. % | wt. % |
| CAT1 | 50 | 50 | 0 |
| CAT2 | 50 | 40 | 10 |
| CAT3 | 50 | 30 | 20 |
| CAT4 | 50 | 20 | 30 |
| CAT5 | 50 | 10 | 40 |
| CAT6 | 50 | 0 | 50 |
Table 4: Catalyst composition from CAT1 to CAT6.
Characterization of the catalysts
The catalyst surface properties were determined by N2 physisorption (Micromeritics ASAP 2000) at a temperature of 77 K applying the BJH and BET methods. The samples were pre-treated in high vacuum (2 mmHg) at a temperature of 523 K prior to the physisorption analyses. The powder X-ray diffraction (XRD) analyses were carried out in a Rigaku Miniflex 300 W X-ray diffractometer with a Cu-Kα radiation source (λ = 1.5406 Å) in a 2θ degree span from 10° to 90°. The resulting diffractograms were interpreted through the PDF database software Diffrac Version 4.0.
The thermal profile of the mayenite synthesis was analysed by TGA following the calcination scheme described in Table 2. The equipment used for the TGA was a Netzsch STA449 F3 with a synthetic air flow of 50 mL/min throughout the whole heating procedure. The thermal stability of the synthesized catalysts CAT1-CAT6 was also evaluated by TGA. The procedure for the thermal stability started at room temperature and reached a final temperature of 850°C at a temperature rate of 10°C/min, with a N2 flow of 50 mL/min supplemented with synthetic air flow of 50 mL/min.
The relative acidity of the synthesized oxides was measured by thermal programmed desorption of NH3 (NH3-TPD) in a Micromeritics AutoChem 2910 equipment. The program included the pre-treatment of the samples at 450°C in He atmosphere. Afterwards, NH3 gas flow was maintained through the samples for 60 min in a volumetric flow of 30 ml/min, then the remaining NH3 was purged with a He flow of 50 ml/min for 30 min. The next step was the desorption of the NH3, which was carried out at an temperature rate of 10°C/min to 800°C and a dwell step for 10 min. The particle morphology of the catalysts was also analysed by scanning electron microscopy (SEM) Zeiss Ultra 55 in a range from 1 μm to 200 nm.
Transesterification and reaction optimization
The Transesterification experiments were carried out with the catalysts from T1 to T6. The reaction conditions followed the variables shown in Table 5, where the batch reactor was a three-neck round-bottom flask connected to a cold water jacket allowing the condensation of methanol under atmospheric pressure. The temperature was controlled by the use of a water bath and the agitation rate was controlled with a submergible magnetic stirrer within the water bath. The time variable for the experiments was during 1 and 2 h of reaction time, respectively. At the end of the transesterification reaction, the mixture was left to settle down. Once the catalysts with glycerol (by-product) were precipitated, an aliquot of the biodiesel phase was extracted and was analysed by gas chromatography (GC). The GC analyses were performed in an Agilent GC 6890 using HP-FFAP polyethylene glycol capillary column (30 m x 530 μm x I.D. 1 μm) at an oven temperature of 215°C with helium as the carrier phase at a volumetric flow of 7.2mL/min and a split ratio of 80:1. The equipment has a flame ionization detector (FID) working at 300°C. An aliquot of 113 μL of the biodiesel phase was mixed with 11 μL of propyl acetate (internal standard) and 500 μL of n-heptane for each experiment product. The quantification of the biodiesel yield was done by fitting the GC results in a mathematical model of a standard calibration curve made with different concentrations of fatty acid methyl esters (FAME).
| Variable | Units | Value |
|---|---|---|
| Agitation | rpm | 400 |
| Temperature | °C | 60 |
| CH3OH:Trygliceride | - | 12 |
| Catalyst load | % | 5 |
Table 5: Ricinus oil transesterification base test conditions.
The synergic advantages between the oxide mixtures for the transesterification were identified with the catalysts T1 to T6 Table 1 and the catalysts CAT1 to CAT6 Table 4; i.e. CaO, SnO2, and Li2O. Once the catalyst with higher activity was identified by these individual experiments, a design of experiment (DOE) consisting of a central composite circumscribed (CCC) was carried as described in Table 6. The main objective of the DOE was to test the maximum activity of the solid catalyst in the transesterification in an isothermal regime. Accordingly, the catalyst load had to be reduced to an average of 1% wt relative to the ricinus oil. The variables considered in the DOE were named XT, XM, and XC, where T stands for temperature (°C), M for the methanol to oil molar ratio (moleCH3OH: moleOIL), and C the catalyst load (wt. %), respectively. The statistical significance was tested for a 95% confidence interval with 20 observations.
| Experiment | XT | Xm | XC |
|---|---|---|---|
| # | ⁰C | mole | wt. % |
| 1 | 55 | 6 | 0.75 |
| 2 | 55 | 6 | 1.25 |
| 3 | 55 | 12 | 0.75 |
| 4 | 55 | 12 | 1.25 |
| 5 | 65 | 6 | 0.75 |
| 6 | 65 | 6 | 1.25 |
| 7 | 65 | 12 | 0.75 |
| 8 | 65 | 12 | 1.25 |
| 9 | 50 | 9 | 1 |
| 10 | 70 | 9 | 1 |
| 11 | 60 | 3 | 1 |
| 12 | 60 | 15 | 1 |
| 13 | 60 | 9 | 0.5 |
| 14 | 60 | 9 | 1.5 |
| 15-20 | 60 | 9 | 1 |
Table 6: DOE for the ricinus oil transesterification.
Catalyst reuse potential
The potential of the catalysts reusability was tested through aging procedure, which consisted in placing the catalyst in a methanol-only environment. The aging of the catalyst was carried with a catalyst load of 5% wt with an agitation rate of 400 rpm at a temperature of 70°C in methanol, since the conditions were intended to be more severe than the regular reaction conditions. After an aging time of 6 h, the catalyst-CH3OH mixture was placed in the oven at 70°C to dryness for XRD analysis and TGA analysis under the conditions previously described.
Results and Discussion
Characterization of the ricinus oil
The ricinus oil characterization showed in Table 7 confirms the quality of the oil since the physical and chemical properties are according to the data reported in the literature.
| Experiment | XT | Xm | XC |
|---|---|---|---|
| # | °C | mole | wt. % |
| 1 | 55 | 6 | 0.75 |
| 2 | 55 | 6 | 1.25 |
| 3 | 55 | 12 | 0.75 |
| 4 | 55 | 12 | 1.25 |
| 5 | 65 | 6 | 0.75 |
| 6 | 65 | 6 | 1.25 |
| 7 | 65 | 12 | 0.75 |
| 8 | 65 | 12 | 1.25 |
| 9 | 50 | 9 | 1 |
| 10 | 70 | 9 | 1 |
| 11 | 60 | 3 | 1 |
| 12 | 60 | 15 | 1 |
| 13 | 60 | 9 | 0.5 |
| 14 | 60 | 9 | 1.5 |
| 15-20 | 60 | 9 | 1 |
| Property | Units | Value | Reported |
| Viscosity | cSt | 84.96 | 95.93 |
| Density | g/cm3 | 0.96 | 0.94 |
| Iodine number (Wij) | g I2/100 g | 75 | 80-145 |
| Acidity | % | 1.56 | 1.0-5.6 |
| Peroxide number | mEq/kg | 151.4 | 158.64 |
| Saponifiable matter | ppm | 162.46 | 177-188 |
| Moisture content | % | 0.1 | 0.15–0.30 |
Table 7: Physical and chemical properties of the used ricinus oil and comparison with the found literature (8-10).
The ricinus oil was extracted from the seed by cold-pressing technique, which in accordance to Ogunniyi (2006) results in a better grade oil. Most of the measured values lie within the reported literature. Among the important differences worth mentioning are the viscosity, which was found lower than the reported average values [10]. Such difference, in addition to the lower saponifiable matter, peroxide number, and iodine number might be a result of the species variations as well as the environmental differences between the Ricinus crops from the region of Santa Cruz, Bolivia and the Ricinus crops found in the literature.
Characterization of the catalysts
The TGA analysis of synthesized mayenite shows to follow the thermal decomposition of the used precursors as illustrated in the Figure 1. The initial loss of mass starts from a temperature of 200°C to 300°C, where in such temperature range the nitrous oxides leave the mixture in gaseous form according to Song et al. [40]. The dehydration of physically adsorbed H2O from the Ca(OH)2 was reported to occur at the same temperature range [41]. The second mass loss was found to occur between 400 and 550°C, where it has been reported to be the temperature range for the formation of CaO and Al2O3 from Ca(OH)2 and Al(NO3)3, respectively [41,42]. The mass loss continues up from a temperature of 600 to 800°C, which is caused mainly by the formation of the mayenite crystal phase from the calcium and aluminium oxides [43].

Figure 1: TGA analysis during mayenite synthesis.
The XRD analysis of the synthesized mayenite showed in Figure 2 has the diffraction pattern for Ca12Al14O33 (PDF-00-009-0413). The mayenite XRD results also suggest that as a support, the synthesized material has CaO (PDF-01-070-5490), CaCO3 (PDF-00- 060-0483), CaCl2 (PDF-00-024-0223), and γ-Al2O3 (PDF-01-074- 4629) phase formations. Following the N2-adsorption isotherm, the BET surface area showed that mayenite has 5.8369 m2/g placing the support in the mesoporous classification [44,45]. The calculated BJH pore volume was determined to be 0.068 cm3 /g and the pore diameter to be 47.03 nm.

Figure 2: XRD diffractograms of the synthesized mayenite, CAT1, CAT2, and CAT3.
After the catalyst support was characterized, the synthesized catalysts from CAT1 to CAT6 were analysed. The N2-adsorption analyses shown in Table 8 for the catalysts CAT1 and CAT6 described the difference in surface area change. The increase of lithium and tin effects are opposite, while the former decreases the surface area, the latter increases it conferring the catalyst a range of pore size variability from 14.12 to 28.74 nm.
| Units | Mayenite | CAT1 | CAT6 | |
|---|---|---|---|---|
| Surface area (BET) | m2/g | 5.84 | 1.5092 | 7.79 |
| Pore volume (BJH) | cm3/g | 0.068 | 0.012 | 0.081 |
| Pore size (BJH) | nm | 47.035 | 14.14 | 28.74 |
Table 8: BET and BJH by N2-physisorption of mayenite, CAT1, and CAT6.
The XRD peaks shown in Figure 2 strongly suggest that not only species such as cubic Li2O (PDF-00-012-0254) and tetragonal SnO2 (PDF-00-046-1088) are formed on the surface but the diffractogram also shows the presence of species like crystalline tetragonal SnO (PDF-00-055-0837) and cubic CaO (PDF-00-001- 1160).
Additionally, Figure 3 shows the XRD analysis for the catalysts CAT4, CAT5, and CAT6 in comparison with the mayenite diffractogram. The main expected species are included in the diffractograms as specified in the legend and consistently to their respective powder diffraction files (PDF). The diffractogram of the CAT6 shows the presence of the species Li2O and SnO2 following their respective PDF files. The signals appearing at 23° and 43° 2θ degrees are identified to be tetragonal synthetic cassiterite (PDF- 00-041-1445) [46].

Figure 3: XRD diffractograms of the synthesized mayenite, CAT4, CAT5, and CAT6.
The TGA results of the synthesized catalysts, shown in Figure 4, suggest that the catalysts CAT1 and CAT5 are the most stable, both having a mass loss percentage of less than 15% wt On the contrary, the TGA analyses of the catalysts CAT2, CAT3, CAT4, and CAT6 indicate a significant mass loss and showed that their surface is not stable and still go under notable mass loss percentage of 78.0, 74.6, 75.4, and 79.8% wt, respectively. Specifically, in the case of the catalysts from CAT1 to CAT5 (mayenite with Li2O) the TGA analyses suggests that some water could be desorbing at temperatures from 100 to 170°C [47]. The catalysts CAT1, CAT3, CAT4, and CAT5 show a stable mass from 170 to 850°C. Conversely, the catalyst CAT2 undergoes through a mass loss that starts at a temperature of 370 up to 470°C possibly due to the conversion from Li2O and Li-MII oxide as reported by Cao et al. [48]. In the same way, the catalyst CAT6 shows a slight mass increase after the dehydration step (from 300 to 430°C) which can be attributed to the formation of Sn complexes such as CaSnO3 on the mayenite surface [49,50].

Figure 4: TGA analysis of the catalysts from CAT1 to CAT6.
The NH3-TPD analyses of the mayenite and catalyst CAT6 were done as shown in Figure 5. The analysis shows the presence of acid sites (weak and strong) on the support and the catalyst CAT6. Mayenite has weak acidic sites characteristically desorbing NH3 at a temperature range from 300 to 380°C and a majority of strong acidic sites that desorb NH3 from 500°C to 800°C. The NH3-TPD analysis of the CAT6 shows that the addition of the Sn-species result in is a shift in the acidity and a decrease in the acidic strength. The relative difference of surface acidity decrease between mayenite and CAT6 is 41.9%. Contrary to the SnO2 acid character, the resulting lower acidity of CAT6 relative to mayenite might be in the formation of other species on the mayenite surface. In the case of γ-Al2O3, detected by the XRD analyses (Figure 2), the increase in temperature could lead to the formation of α-Al2O3, which has an amphoteric nature. The phase change from gamma to alpha alumina is reported to start from a temperature of 760°C [51]. Furthermore, the presence of the SnO2 on the mayenite support has shown to shift the molar ratio between low acidic sites and high acidic sites from 0.029 on bare mayenite to 0.774 on the SnO2 impregnated mayenite, i.e. the catalyst CAT6 has higher density of weak acid sites enhancing the reaction of ricinus oil with CH3OH.

Figure 5: TPD-NH3 analysis of mayenite and CAT6.
The SEM micrographs of the CAT6 in Figure 6 depicts the surface morphology, where the formation of near nanoscale particles is visible. The crystals formed on the surface have needle form resulting in the sharp signals showed in CAT6-XRD (Figure 3). It was further estimated that the 60.4% of the surface needle-like crystals are between 250 and 350 nm length. The cavern-like found in the surface are in agreement to the BET results regarding the mayenites’ mesoporous nature.

Figure 6: SEM micrograph of the CAT 6.
Catalyst test and DOE results
The activity tests of the catalysts were carried out using the catalysts T1 to T6 determining the best oxide mixtures for biodiesel production from ricinus oil. The mixture of CaO/SnO2 in a mass ratio of 70/30 led to the highest biodiesel yield, as shown in Figure 7, reaching 29.5% in a reaction time of 2h. The second higher result was achieved by the catalyst T3, which showed biodiesel yields of 16.40 and 17.0% for reaction time of 1h and 2h, respectively. These results suggests that the reaction time in this case marginally influences the conversion to biodiesel. Previous studies reported that the use of CaO/SnO2 mixtures for the transesterification reactions lead to biodiesel yields from 25% rising upwards [52]. However, the report by Xie and Zhao [53] showed a yield of 89.3% of biodiesel production was achieved from soybean oil after 6h of reaction at 70°C with a catalyst load of 8% wt and a methanol to oil ratio of 12:1. The harsher conditions show that the oxide mixture must be accompanied by other elements related to improve the reaction yields. On the other side, no previous study was found on the transesterification of ricinus oil with a mixture of Li2O and SnO2 catalyst.

Figure 7: Biodiesel production with the catalysts from T1 to T6.
The results showed in Figure 7 indicate that a mixture of the oxides between CaO/SnO2 is more active than Li2O/SnO2. For that reason, the effect of Li2O/SnO2 over mayenite support had to be tested. Accordingly, the transesterification experiments with the catalysts from CAT1 to CAT6 were carried out and the results are exhibited in Figure 8. The catalyst CAT6 had the highest activity for biodiesel production reaching a yield of 34 % in comparison with the other catalysts lower activities. Consequently, the reaction optimization using the DOE was carried out with the catalyst CAT6. The review by Andrade et al. [54-56] reported the production of biodiesel from ricinus oil with yields that vary from 67.5 to 97.0% with the use of enzymes but with longer reaction times (from 8 to 24 h) and at lower temperatures (from 35 to 50°C). Using the supercritical methods, the reported biodiesel yields vary from 95.22 to 96.5% and even if such methods produce high yields of biodiesel, their energy demand is often high. The reaction conditions for supercritical methods often require higher amount of alcohol versus oil for the alcoholysis [30]. At the same time, the process conditions include higher temperatures and pressures but shorter reaction times [28,57].

Figure 8: Biodiesel productions with the catalysts from CAT1 to CAT6.
The heterogeneous methods that were found in the literature include the use of a handful of solid supports with several dopants. Carvalho et al. [58] reported biodiesel yields of 96.4 and 95.3% using reactants of bare ricinus oil and a blend with babassu oil, respectively, catalysed by a mixture of Sr species. The report by Cao and Zhao [59] deals with a KOH/NaY solid catalyst under mild reaction conditions reaching 86.9% of biodiesel yield. Our work, however, is an attempt to utilize low-cost mixed oxides either alone or supported on mayenite, albeit the use of low catalyst concentrations.
The non-linear regression for the DOE was carried out resulting in equation Equation 1. The goodness of the model described by Equation 1 is R2 = 0.93 within the limits of the factor levels. The model described by Equation 1 shows that the factors methanol to oil molar ratio (XM) and catalyst load (XC) have more influence over the biodiesel yield than the temperature (XT) factor. Such factors have statistical significance with a calculated probability (pValue) of t = -2.20, p = 0.046; t = -2.26, p = 0.041; t = -9.4 x 10¹⁰, p = 8.18 x 10-137; and t = -100.95, p = 3.31 x 10⁻²⁰ for the 4th, 5th and 6th terms, respectively. Thus, the interaction between XM and XC is negative but statistically significant, as well as the effects of the squared temperature (XT2). The effect of the molar ratio (XM) is inversely proportional, suggesting that the increase of methanol to oil molar ratio is hindering the catalytic reaction. In contrast, the catalyst load alone (XC) failed to have statistical significance showing a calculated probability of t = -1.16 and p = 0.26 for the XC coefficient.
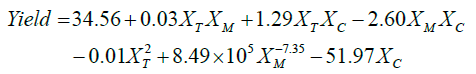 (1)
(1)
The response surface analysis of the interaction effects between the factors was carried with Matlab cftool and is displayed in Figure 9. The interaction effect between the factors XM and XC, Figure 9a showed that the catalyst load in the reaction has a limited effect opposed to methanol to oil molar ratio which has the highest reaction yield at the minimum level. Moreover, the reduction of the methanol to oil ratio to increase the reaction yield, as suggested by the Equation 2 from response analysis, might be a result of the catalyst losing its crystalline phases. The goodness of the fit obtained show an R-square equal to 0.78.

Figure 9: Response surface analysis of the interaction between XC vs XM (a), XM vs XT (b), and XC vs XT (c)
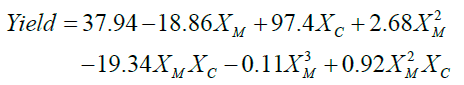 (2)
(2)
The effect of the factors XM and XT, shown in Figure 9b showed that their interaction results in an increase of the biodiesel yield when the methanol to oil molar ratio is decreased (XM), while the temperature effects is suggested to be linear through the established limits. Equation 3 shows that the temperature (XT) factor has a rather low effect on the final yield and that the methanol to oil molar ratio (XM) is the limiting factor. However, the yield is decreased by the increase of methanol to oil ratio, such occurrence might be related to the resistance of the catalysts towards the high presence of hydroxyl groups from methanol and ricinoleic acid showing a probable leaching of the catalysts active phase.
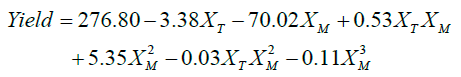 (3)
(3)
Furthermore, the interaction between the treatments catalyst load (XC) and temperature (XT), shown in Figure 9c, results in an increase of the yield only with the extreme levels of the XT factor, i.e. low temperature and high temperature. The catalyst load factor (XC) coefficients in Equation 4 suggest that at any higher catalyst load, the yield will increase.
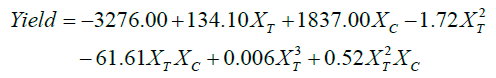 (4)
(4)
The consideration of the results showed in the response surface analysis motivated further experiments with 4:1 methanol to oil molar ratio, since the reaction requirement is an excess of m at 60°C of temperature but increasing the catalyst load (XC) in the reactions. A catalyst increase to 3, 6 and 9% wt of CAT6 led to considerable higher biodiesel yields as described in Figure 10. Where 85% yield of biodiesel was obtained at the intermediate load. This implies that at lower or higher concentrations of catalyst the mas transfer of the reactants and products is either too low or is hindered.

Figure 10: Biodiesel production yields with higher CAT6 load.
Catalyst reusability
The catalyst reusability test (aging) showed that the catalysts CAT1 and CAT6 were unstable under methanol-only environment. The contrast between CAT1 and CAT1-Aged (Figure 11), suggests that mayenite is left alone without any LiO2 (PDF-00-012-0254) on its surface. The XRD diffractogram comparison between fresh CAT6 and CAT6-Aged (Figure 12) indicates that the only stable phase was SnO2 which is comparable with the pattern PDF-00-046-1088 in defined narrow peaks. The stability of the catalyst CAT6 is also poor in terms of the support strength since the peaks identifying mayenite are considerably weaker after the aging treatment. Especially the intensity of the peaks is reduced, suggesting a decrease of the crystal face dimensions on the mayenite surface resulting from the CH3OH treatment.

Figure 11: XRD diffractogram after the aging effect in CAT1.

Figure 12: XRD diffractogram after the aging effect in CAT6
The thermogravimetric analyses of the catalysts CAT1 and CAT6 after the aging tests are depicted in Figure 13. The mass loss suggests the catalyst CAT1 has a stable phase up to 250°C and then it loses a total of 25% wt. On the other hand, the mass loss from CAT6 that starts at 150°C indicates the formation of hydroxide species on the catalyst surface. The catalyst CAT6 stabilizes at 550°C of temperature after the aging procedure, suggesting that the phases of CAT6 are more stable than the phases of CAT1.

Figure 13: TGA analyses of the methanol aged CAT1 and CAT6.
Conclusion
The catalysts from mixed oxides (CaO/SnO2 and Li2O/SnO2) are catalytically active materials for the heterogeneously catalysed biodiesel production. This study confirms that CaO and SnO2 have high activity in the transesterification reaction of ricinus oil. The best combination of such oxides resulted to be 70% wt of CaO with 30% wt of SnO2. However, the disposition of such mixture over a mayenite support proved to be challenging as well as idealistic. The best catalyst towards the ricinus oil biodiesel production was CAT6, which is based on 50% wt of SnO2 over mesoporous mayenite. The highest yield obtained by the response surface methodology was at 60°C, with a methanol to oil molar ratio of 4:1, and a catalyst content of 1% wt with respect to the oil mass. The surface response analysis showed more insight on the resulting highest yield and suggests that less temperature (XT), less methanol to oil molar ratio (XM), and more catalyst load (XC) could increase the transesterification yields. Such conclusion is supported by further analysis of the results. Since the second highest yield was achieved at a temperature of 55°C and considering the boiling point of methanol (64.7°C), it might be possible that the methanol phase change to vapour for the reactions carried out at the temperatures 65 and 70°C might be hinder the transesterification yields. Based on the statistical analysis, the biodiesel yields increased up to 85% by increasing the catalyst load to 6% wt leaving the catalyst stability to be further improved.
Acknowledgement
This work was possible thanks to the financial support of the Swedish International Development Cooperation Agency (SIDA); KTH Royal Institute of Technology; and UMSS – Universidad Mayor de San Simon.
Funding
This work was possible thanks to the financial support of the Swedish International Development Cooperation Agency (SIDA); KTH Royal Institute of Technology; and UMSS – Universidad Mayor de San Simon.
Competing Interests
The author(s) declare(s) that they have no competing interests.
Ethics Approval and Consent to Participate
I, and all co-authors, declare that the information presented in this document has been obtained and presented in accordance with academic rules and ethical conduct. Consequently, we carefully added the citations and references for all material and results that are not original to this work.
Consent for Publication
I, and all co-authors, agree that the article, if editorially accepted for publication, will be held under the corresponding licence agreement.
Availability of Data and Material
Not applicable
Author’s Contributions
JLS carried out all the catalyst syntheses, catalyst and oil characterization, biodiesel production and characterization analyses, and drafted the manuscript. LA participated in the design of the study and helped in drafting the manuscript. YK conceived the study, and participated in its design and coordination. YK also helped in the interpretation of the results and drafting the manuscript. All authors read and approved the final manuscript.
References
- Ozcanli M, Serin H, Saribiyik OY, Aydin K, Serin S (2012) Performance and Emission Studies of Castor Bean (Ricinus Communis) Oil Biodiesel and Its Blends with Diesel Fuel. Energy Sources, Part A: Recovery, Utilization, and Environmental Effects 34: 1808-14.
- Kiss A, Omota F, Dimian A, Rothenberg G (2006) The heterogeneous advantage: biodiesel by catalytic reactive distillation. Top Catal 40: 141-50.
- Ong HC, Silitonga AS, Masjuki HH, Mahlia TMI, Chong WT (2013) Production and comparative fuel properties of biodiesel from non- edible oils: Jatropha curcas, Sterculia foetida and Ceiba pentandra. Energy Convers Manag 73: 245-255.
- Yatish KV, Lalithamba HS, Suresh R, Dayananda GN (2018) Sodium phosphate synthesis through glycerol purification and its utilization for biodiesel production from dairy scum oil to economize production cost. Sust Energy & Fuels 2: 1299-304.
- https://www.missouribotanicalgarden.org/PlantFinder/PlantFinderDetails.aspx?kempercode=b459
- Dias JM, Araújo JM, Costa JF, Alvim-Ferraz MCM, Almeida MF, et al. (2013) Biodiesel production from raw castor oil. Energy 53: 58-66.
- Boda RK, Majeti NVP, Suthari S (2017) Ricinus Communis L. (castor bean) as a potential candidate for revegetating industrial waste contaminated sites in peri-urban Greater Hyderabad: remarks on seed oil. Environ Sci Pollut Res Int 24: 19955-64.
- Azad AK, Rasul MG, Khan MMK, Sharma SC, Mofijur M, et al. (2016) Prospects, feedstocks and challenges of biodiesel production from beauty leaf oil and castor oil: A nonedible oil sources in Australia. Renew Sust Energy Rev 61: 302-18.
- Ogunniyi DS (2006) Castor oil: A vital industrial raw material. Bioresour Technol 97: 1086-91.
- Scholz V, da Silva JN (2008) Prospects and risks of the use of castor oil as a fuel. Biomass and Bioenergy 32: 95-100.
- Sousa N, Cabral G, Vieira P, Baldoni A, Aragao F, et al. (2017) Bio-detoxification of ricin in castor bean (Ricinus communis L.) seeds. Sci Rep 7: 15385.
- Madeira JV, Macedo JA, Macedo GA (2011) Detoxification of castor bean residues and the simultaneous production of tannase and phytase by solid-state fermentation using Paecilomyces variotii. Bioresour Technol 102: 7343-48.
- Fernandes KV, Deus-de-Oliveira N, Godoy MG, Guimaraes ZAS, Nascimento VV, et al. (2012) Simultaneous allergen inactivation and detoxification of castor bean cake by treatment with calcium compounds. Braz J Med Biol Res 45: 1002-10.
- Borja MS, Oliveira RL, Silva TM, Bezerra LR, Nascimento NG, et al. (2017) Effectiveness of calcium oxide and autoclaving for the detoxification of castor seed meal in finishing diets for lambs. Anim Feed Sci Technol 231: 76-88.
- Rojas-Sandoval J, Acevedo-Rodríguez P (2018) Ricinus communis (castor bean) Wallingford, UK: CAB International: CABI [Available from: https://www.cabi.org/isc/datasheet/47618.
- Da Silva César A, Otávio Batalha M (2010) Biodiesel production from castor oil in Brazil: A difficult reality. Energy Policy 38: 4031-39.
- https://www.fao.org/faostat/en/#data/QC
- Pivetta L, Tomaz C, Fioreze S, Lara-Fioreze A, Pivetta L, et al. (2017) Growth performance of castor bean hybrids under different plant densities 1. Revista Ceres 64: 399-412.
- Conceiçao MM, Candeia RA, Silva FC, Bezerra AF, Fernandes Jr VJ, et al. (2007) Thermoanalytical characterization of castor oil biodiesel. Renew Sust Energy Rev 11: 964-75.
- Kouzu M, Kasuno T, Tajika M, Sugimoto Y, Yamanaka S, et al. (2008) Calcium oxide as a solid base catalyst for transesterification of soybean oil and its application to biodiesel production. Fuel 87: 2798-806.
- Jin H, Kolar P, Peretti SW, Osborne JA, Cheng JJ (2017) Kinetics and Mechanism of NaOH-Impregnated Calcined Oyster Shell-Catalyzed Transesterification of Soybean Oil. Energies 10: 18.
- Farobie O, Matsumura Y (2017) State of the art of biodiesel production under supercritical conditions. Prog Energy Combust Sci 63: 173-203.
- Rizo Edwin G, Suryani S, Mailin M, Clarence MO, Ann A, et al. (2016) Green biodiesel production: a review on feedstock, catalyst, monolithic reactor, and supercritical fluid technology. Biofuel Res J 3: 431-47.
- Gui MM, Lee KT, Bhatia S (2008) Feasibility of edible oil vs. non-edible oil vs. waste edible oil as biodiesel feedstock. Energy 33: 1646-53.
- Martinez-Guerra E, Gude VG (2017) Assessment of sustainability indicators for biodiesel production. Appl Sci 7: 869-83.
- Thirugnanasambandham K, Shine K, Agatheeshwaren A, Sivakumar V (2016) Biodiesel production from castor oil using potassium hydroxide as a catalyst: Simulation and validation. Energy Sources, Part A: Recovery, Utilization, and Environmental Effects 38: 2898-905.
- Armendariz J, Lapuerta M, Zavala F, García-Zambrano E, Del Carmen Ojeda M, et al. (2015) Evaluation of eleven genotypes of castor oil plant ( Ricinus communis L.) for the production of biodiesel. Ind Crops Prod 77: 484-90.
- Torrentes-Espinoza G, Miranda BC, Vega-Baudrit J, Mata-Segreda JF (2017) Castor oil (Ricinus communis) supercritical methanolysis. Energy 140: 426-35.
- Varma MN, Madras G (2007) Synthesis of biodiesel from castor oil and linseed oil in supercritical fluids. Ind Eng Chem Res 46: 1-6.
- Narayan RC, Lamba N, Javed A, Madras G, et al. (2017) Kinetics of esterification of 10-undecenoic and ricinoleic acids with near-critical and supercritical methanol. Sustainable Energy & Fuels 1: 1425-36.
- Solis J, Berkemar A, Alejo L, Kiros Y (2017) Biodiesel from rapeseed oil ( Brassica napus ) by supported Li2O and MgO. International J Energy Environ Eng 8: 9-23.
- Nayebzadeh H, Haghighi M, Saghatoleslami N, Tabasizadeh M, Binaeian E, et al. (2018) Influence of carbon source content on the structure and performance of KOH/Ca12Al14O33-C nanocatalyst used in the transesterification reaction via microwave irradiation. J Alloys Compd 743: 672-81.
- Solis JL, Alejo L, Kiros Y (2015) Calcium and tin oxides for heterogeneous transesterification of Babasssu oil (Attalea speciosa). J Environ Chem Eng 4: 4870-77.
- Lam MK, Lee KT, Mohamed AR (2010) Homogeneous, heterogeneous and enzymatic catalysis for transesterification of high free fatty acid oil (waste cooking oil) to biodiesel: A review. Biotechnol Adv 28: 500-18.
- Nuithitikul K, Limtrakul J (2012) Comparison in Catalytic Activities of Sulfated Zirconia and Sulfated Tin Oxide for Converting Free Fatty Acids in Crude Palm Oil to Their Methyl Esters. Int J Chem React Eng 10: 29.
- Firestone D (2004) Official methods and recommended practices of the AOCS. Champaign, Ill: American Oil Chemists Society.
- Chen H, Liu N (2010) Application of non-arrhenius equations in interpreting calcium carbonate decomposition kinetics: Revisited. J Am Ceram Soc 93: 548-53.
- Al-Gaashani R, Radiman S, Tabet N, Daud AR (2012) Optical properties of SnO2 nanostructures prepared via one-step thermal decomposition of tin (II) chloride dihydrate. Materials Science & Engineering B 177: 462-70.
- Kudo H (1979) The rates of thermal decomposition of LiOH(s), LiOD(s) and LiOT(s). J Nuclear Materials 87: 185-88.
- Song KC, Woo KJ, Kang Y (1999) Preparation of alumina fibers from aluminum salts by the sol-gel method. Korean J Chem Eng 16: 75-81.
- Mirghiasi Z, Bakhtiari F, Darezereshki E, Esmaeilzadeh E (2014) Preparation and characterization of CaO nanoparticles from Ca(OH)(2) by direct thermal decomposition method. J Ind Eng Chem 20: 113-17.
- Ude SN, Rawn CJ, Peascoe RA, Kirkham MJ, Jones GL, et al. (2014) High temperature X-ray studies of mayenite synthesized using the citrate sol-gel method. Ceram Int 40: 1117-23.
- Li C, Hirabayashi D, Suzuki K (2011) Synthesis of higher surface area mayenite by hydrothermal method. Mater Res Bull 46: 1307-10.
- Rouquerol J, Avnir D, Everett DH, Fairbridge C, Haynes M, et al. (1994) Guidelines for the Characterization of Porous Solids. Stud Surf Sci Catal 87: 1-9.
- Zdravkov B, Čermák J, Šefara M, Janků J (2007) Pore classification in the characterization of porous materials: A perspective. Central Eur J Chem 5: 385-95.
- Handbook of Mineralogy. Mineralogical Society of America 2003. Available from: https://www.handbookofmineralogy.org/
- Cheng J, Guo L, Xu S, Zhang R, Li C (2012) Submicron γ-LiAlO2 Powder Synthesized from Boehmite. Chinese J Chem Eng 20: 776-83.
- Cao K, Shen TT, Wang KP, Chen DM, Wang WL, et al. (2017) Influence of different lithium sources on the morphology, structure and electrochemical performances of lithium-rich layered oxides. Ceramics International 43: 8694-702.
- Fan CH, Song XY, Yu HY, Yin ZL, Xu HY, et al. (2007) Shape-controlled synthesis of CaSnO3 micro crystals via a precursor route. Materials Letters 61: 1588-91.
- Novinrooz A, Sarabadani P, Rezainik Y (2009) Synthesis and Processing of SnO2, CaSnO3 and Ca2SnO4 Nanopowders by Solid-State Reaction Technique. Iranian J Chem Chem Eng 28: 113-19.
- Wefers K, Misra C (1987) Oxides and hydroxides of aluminum. Alcoa laboratories- Aluminum Company of America 100.
- Soares AB, da Silva PRN, Stumbo AM, Freitas JCC (2012) Use of Heterogeneous CaO and SnO2 Catalysts Supported on Rice Husk Ash to Produce Biodiesel. Quimica Nova 35: 268-73.
- Xie WL, Zhao LL (2013) Production of biodiesel by transesterification of soybean oil using calcium supported tin oxides as heterogeneous catalysts. Energy Convers Manag 76: 55-62.
- Andrade TA, Errico M, Christensen KV (2017) Influence of the reaction conditions on the enzyme catalyzed transesterification of castor oil: A possible step in biodiesel production. Bioresour Technol 243: 366-74.
- Maleki E, Aroua M, Sulaiman N (2003) Castor oil - a more suitable feedstock for enzymatic production of methyl esters. Fuel Process Technol 112: 129-32.
- Yang JS, Jeon GJ, Hur BK, Yang JW (2005) Enzymatic methanolysis of castor oil for the synthesis of methyl ricinoleate in a solvent-free medium. J Microbiol and Biotechnol 15: 1183-88.
- Roman-Figueroa C, Olivares-Carrillo P, Paneque M, Palacios-Nereo FJ, Quesada-Medina J. et al. (2016) High-yield production of biodiesel by non-catalytic supercritical methanol transesterification of crude castor oil (Ricinus communis). Energy 107: 165-71.
- de Carvalho LMG, de Abreu WC, Silva MdGdOe, Lima JRdO, de Oliveira JE, et al. (2013) Heterogeneous Catalysis Afford Biodiesel of Babassu, Castor oil and Blends. J Braz Chem Soc 24: 550-558.
- Cao CY, Zhao YH (2013) Transesterification of Castor Oil to Biodiesel Using Koh/Nay as Solid Base Catalyst. Int J Green Energy 10: 219-29.

Open Access Journals
- Aquaculture & Veterinary Science
- Chemistry & Chemical Sciences
- Clinical Sciences
- Engineering
- General Science
- Genetics & Molecular Biology
- Health Care & Nursing
- Immunology & Microbiology
- Materials Science
- Mathematics & Physics
- Medical Sciences
- Neurology & Psychiatry
- Oncology & Cancer Science
- Pharmaceutical Sciences