Study and Analysis of the Concentrations of Tropospheric Ozone in the City of Medellin and the Aburra Valley and Their Relationship with Atmospheric Phenomena
Enrique Posada1*, Carlos Hernández1 and Miriam Gómez2
1Hatch Indisa, Medellín, Colombia
2Colombian Polytechnic Jaime Isaza Cadavid, Colombia
- *Corresponding Author:
- Enrique Posada
Hatch Indisa, Medellín, Colombia
Tel: (574) 444 61 66 188
E-mail: enrique.posada@hatchindisa.com
Received Date: October 30, 2017; Accepted Date: December 07, 2017; Published Date: December 15, 2017
Citation: Posada E, Hernández C, Gómez M (2017) Study and Analysis of the Concentrations of Tropospheric Ozone in the City of Medellin and the Aburra Valley and Their Relationship with Atmospheric Phenomena. Environ Toxicol Stud J 1:5.
Abstract
In this study, data from 9 sampling stations distributed along the Valley of Aburrá region was analyzed, as reported by the regional air quality monitoring network and the CALAIRE laboratory, between 2014 and 2015. Variations in ozone hourly concentrations are presented, including those between sampling stations, showing the average and maximum values, grouped by hour of day and by day of the week. The total set of data and the peak-hour’s behavior were also analyzed. Correlations were established with meteorological phenomena (sunshine, rainfall and cloud cover). Out of more than 100, 000 hourly data values, only a 1.29% exceeds the quality standard of 61 ppb. From this point of view, the situation should not be considered as a serious one from the point of view of public health, although it should be monitored and studied in relationship to climate and vehicular sources. Quality Air indexes were also determined. Based in a comparative analysis with 25 cities in the world, it was also found that the average annual concentration of ozone in Medellin is inferior to many other of the cities studied.
Keywords
Reaction photochemistry; Solar radiation; Ozone air quality index; Ozone; Valle de Aburrá; Climate; Correlations; Cloud cover; Precipitation; Variations; Ozone concentrations
Methodology
Pollution due to the presence of tropospheric ozone is an issue of vital importance in understanding the atmospheric panorama of the city of Medellín and its metropolitan area. The Regional Air Quality Network has monitored ozone concentrations for several years. For this study, data from 9 sampling stations located in the city of Medellín (Universidad de Medellín, Universidad Nacional, Universidad de Antioquia, Museo de Antioquia, Miraflores, Villahermosa) and nearby municipalities (Barbosa, Bello, Itagüí, Caldas), along the Aburrá Valley, from the Parque de las Aguas in Copacabana in the north, to the Corporación Lasallista in Caldas, in the south. Measurements went from January 1, 2014 to August 30, 2015. Data analysis was based on hourly measurements throughout the day. Data sets were tabulated in days, hours and parts per billion (ppb).
The study shows the variation of the ozone concentrations throughout the day, as well as the variation between sampling stations, showing the average concentrations and the maximum concentrations, grouping the data by hour of the day and by day of the week. It also shows a general average of all stations and an analysis of the peak hours of ozone concentrations throughout the valley. In addition, correlations were established with meteorological phenomena (solar brightness, rainfall and cloud cover), based on meteorological information from the Instituto de Hidrología, Meteorología y Estudios Ambientales (IDEAM). Information on ozone concentrations comes from the Air Quality Laboratory (CALAIRE) of the Universidad Nacional de Colombia, sede Medellin. The purpose of this study is to have a perspective on the magnitude of the ozone pollution problem in the región and examine them from the point of view of public health.
Ozone forms in the atmosphere by photochemical reactions in the presence of sunlight and precursor pollutants such as nitrogen oxides (NOx) and various volatile organic compounds (COVs). It is one of the main atmospheric pollutants present in highly industrialized urban areas and in cities with a high number of vehicles such as the city of Medellín. Ozone formation occurs most frequently in the morning and noon and begins to decrease at the end of the afternoon [1].
At the beginning of the formation process, NOx (mostly NO2) found in the air, decomposes into NO and into elementary oxygen, in the presence of solar radiation of short wavelengths (less than 430 nm),
NO2 → NO+O2 (1)
Elementary oxygen ion is extremely active and is the one that forms ozone, reacting with the oxygen present in the air.
O+O2→ O3 (2)
However, ozone can also be decomposed by reacting with NO, forming nitrogen dioxide and molecular oxygen.
2NO+O3 → NO2+O2 (3)
Now enters photochemical pollution, that occurs when the photosynthetic cycle described in reactions (1), (2) and (3) is altered either by events that consume NO or that favor the production of nitrogen dioxide [2].
2NO2+O2 → NO+O3 (4)
From the previous reaction, it is observed that in hours of maximum radiation (near noon) the highest levels of ozone occur, while at night these levels are decreased. As can be seen later in the data presented, this is what happens in the region.
Results and Discussion
Analysis of hourly data
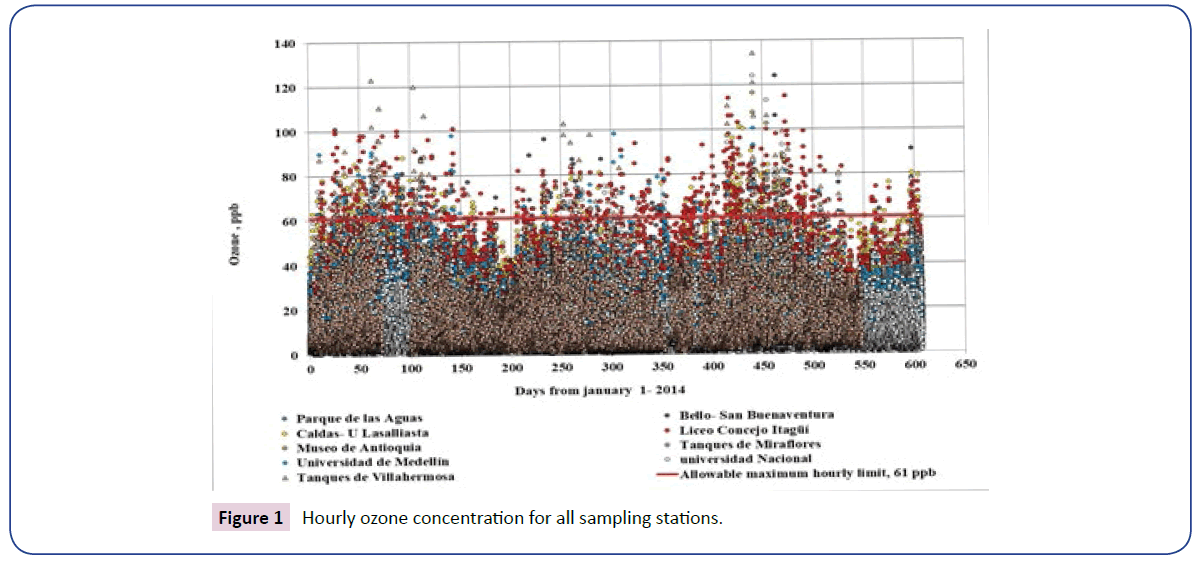
Time measurements were available for more than 600 days, which can be graphically displayed as data clouds as shown in Figure 1. Table 1 shows the overall results of the study, based on the averages and standard deviations for all the hourly data of all the stations studied.
| Sampling station | Hourly mean, M | Standard deviation, DS | Max. ppb | % hourly data >61 ppb |
1 % high value | Average of hourly 1 % high values |
|---|---|---|---|---|---|---|
| Parque de las Aguas | 16, 6 | 13, 0 | 77, 4 | 0, 10 | 46, 4 | 52, 1 |
| Bello-U San Buenaventura | 15, 7 | 13, 5 | 124, 0 | 0, 49 | 54, 0 | 65, 2 |
| Universidad Nacional | 10, 5 | 11, 7 | 124, 0 | 0, 52 | 52, 0 | 63, 6 |
| Tanques de Villahermosa | 15, 1 | 15, 7 | 134, 2 | 1, 46 | 67, 0 | 81, 1 |
| Museo de Antioquia | 10, 6 | 11, 2 | 116, 2 | 0, 57 | 50, 5 | 66, 1 |
| Tanques de Miraflores | 20, 9 | 12, 9 | 60, 0 | 0, 00 | 51, 2 | 54, 4 |
| Universidad de Medellín | 14, 8 | 13, 7 | 100, 6 | 0, 92 | 60, 0 | 69, 5 |
| Liceo Concejo de Itagüí | 20, 1 | 18, 7 | 115, 0 | 4, 03 | 77, 0 | 87, 0 |
| Caldas-U Lasallista | 17, 1 | 17, 0 | 101, 3 | 1, 90 | 67, 0 | 75, 1 |
| All stations | 15, 7 | 14, 2 | 134, 2 | 1, 29 | 64, 0 | 75, 3 |
Table 1: Hourly ozone average concentration in the sampling stations (ppb).
In total, more than 100.000 data have been examined, with more than 12.000 each in almost all the stations. The average concentration was 15, 7 ppb, with a median of 11, 4 ppb and a standard deviation of 14, 1 ppb. The standard deviation, which indicates how wide the dispersion of data is, is on average similar to the mean value.
A first way of to visualize how high the levels of pollution are, is to compare against the limits established in the country (a maximum allowable limit of 80 μg/m3 (41 ppb) for intervals of 8 hours; and 120 μg/m3 (61 ppb) for an interval of 1 hour).
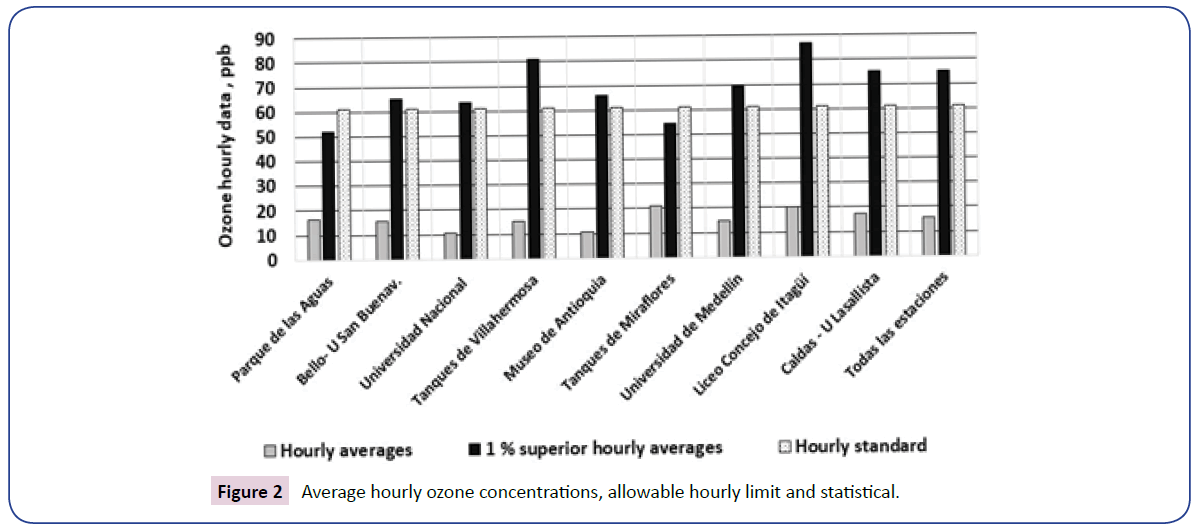
Table 1 and Figures 2-4 show the results for each station examined from the point of view of the percentage of times in which the time limit of 61 ppb is exceeded.
From another point of view, Figure 2 shows the frequency in which daily hourly data exceed the limit of 61 ppb of the total sample, 1, 29% of the data exceeds the hourly norm. In the Liceo Concejo de Itagüí station, this occurs for 4% of the hourly data. From the point of view of the hourly standards, the situation should not be considered as a serious one, rather as a one that merits vigilance and study. This should be done considering and analyzing the ways in which the city and the region are subjected to climate impacts and affected by sources of ozone pollution (which in this case are considered to be, primarily, vehicular sources). It is observed that the stations located at the city center (Museo de Antioquia) and at Universidad Nacional (a zone of high traffic); register the lowest concentrations of ozone. This can be considered surprising, since the ozone precursors are mostly exhaust gases from vehicles and these areas are exposed to high flows of traffic at different times of the day. The highest values are found in the southern part of the valley (Itagüí and Caldas) and the lowest in the north (Parque de las Aguas, Bello). It is worth noting that the winds have a prevailing tendency to blow towards the south of the valley. Tables 2 and 3 show the result according to the day of the week. It is observed that the results are quite similar for the different days, showing the highest values on Saturday and Sunday in all stations and the lower ones on Mondays.
| Average hourly values | Mon. | Tue | Wed. | Thu | Fri | Sat | Sun | Average |
|---|---|---|---|---|---|---|---|---|
| Parque de las Aguas | 16, 4 | 16, 3 | 16, 1 | 16, 7 | 16, 6 | 17, 1 | 17, 2 | 16, 6 |
| Bello-U san Buenaventura | 15, 4 | 15, 4 | 15, 4 | 15, 7 | 15, 4 | 16, 3 | 16, 8 | 15, 7 |
| Universidad Nacional | 10, 0 | 10, 5 | 10, 1 | 10, 2 | 10, 0 | 10, 4 | 12, 0 | 10, 5 |
| Tanques de Villahermosa | 14, 8 | 15, 8 | 15, 3 | 14, 6 | 14, 9 | 15, 0 | 15, 3 | 15, 1 |
| Museo de Antioquia | 10, 2 | 10, 4 | 10, 5 | 10, 4 | 10, 6 | 10, 0 | 12, 1 | 10, 6 |
| Tanques de Miraflores | 18, 8 | 21, 5 | 21, 9 | 22, 4 | 21, 7 | 21, 2 | 19, 4 | 21, 0 |
| Universidad de Medellín | 14, 6 | 14, 6 | 14, 3 | 14, 5 | 14, 4 | 15, 4 | 16, 1 | 14, 8 |
| Liceo Concejo de Itagüí | 20, 0 | 20, 2 | 19, 7 | 20, 4 | 19, 8 | 20, 8 | 19, 9 | 20, 1 |
| Caldas U Lasallista | 16, 6 | 17, 0 | 17, 1 | 17, 7 | 17, 0 | 17, 3 | 17, 1 | 17, 1 |
| Averages | 15, 2 | 15, 5 | 15, 3 | 15, 5 | 15, 3 | 15, 8 | 16, 2 | 15, 5 |
Table 2: Hourly ozone concentrations (ppb) according to the day of the week.
| Sampling station | Mon. | Tue | Wed. | Thu | Fri | Sat | Sun | Cutting value at 1 % |
|---|---|---|---|---|---|---|---|---|
| Parque de las aguas | 50, 3 | 55, 4 | 50, 8 | 52, 4 | 51, 9 | 51, 5 | 52, 6 | 46, 4 |
| Bello-U san Buenaventura | 63, 7 | 62, 3 | 71, 7 | 63, 3 | 67, 6 | 61, 9 | 61, 0 | 54, 0 |
| Universidad Nacional | 61, 6 | 67, 1 | 66, 0 | 58, 7 | 65, 1 | 58, 5 | 59, 2 | 52, 0 |
| Tanques de Villahermosa | 80, 5 | 90, 0 | 81, 7 | 74, 1 | 81, 9 | 75, 0 | 74, 4 | 67, 0 |
| Museo de Antioquia | 55, 0 | 84, 9 | 66, 1 | 61, 1 | 68, 6 | 58, 0 | 58, 0 | 50, 5 |
| Tanques de Miraflores | 41, 0 | 46, 0 | 52, 1 | 55, 7 | 56, 2 | 53, 7 | 54, 7 | 51, 2 |
| Universidad de Medellín | 66, 9 | 74, 4 | 68, 5 | 73, 6 | 67, 8 | 68, 6 | 64, 7 | 60, 0 |
| Liceo Concejo de Itagüí | 88, 0 | 87, 3 | 85, 3 | 85, 8 | 84, 8 | 87, 5 | 79, 6 | 77, 0 |
| Caldas U Lasallista | 72, 7 | 73, 2 | 79, 5 | 72, 9 | 74, 6 | 73, 9 | 75, 3 | 67, 0 |
| Averages higher 1 % data | 64, 4 | 71, 2 | 69, 1 | 66, 4 | 68, 7 | 65, 4 | 64, 4 | 64, 0 |
Table 3: Hourly ozone values (ppb) in the higher 1% for each day of the week.
Table 3 shows the averages of the values that are within the higher 1% of the data, that is, the averages of the high values, for each day of the week. It can be seen that the days with the highest concentrations in such high ranges are from Tuesday to Thursday.
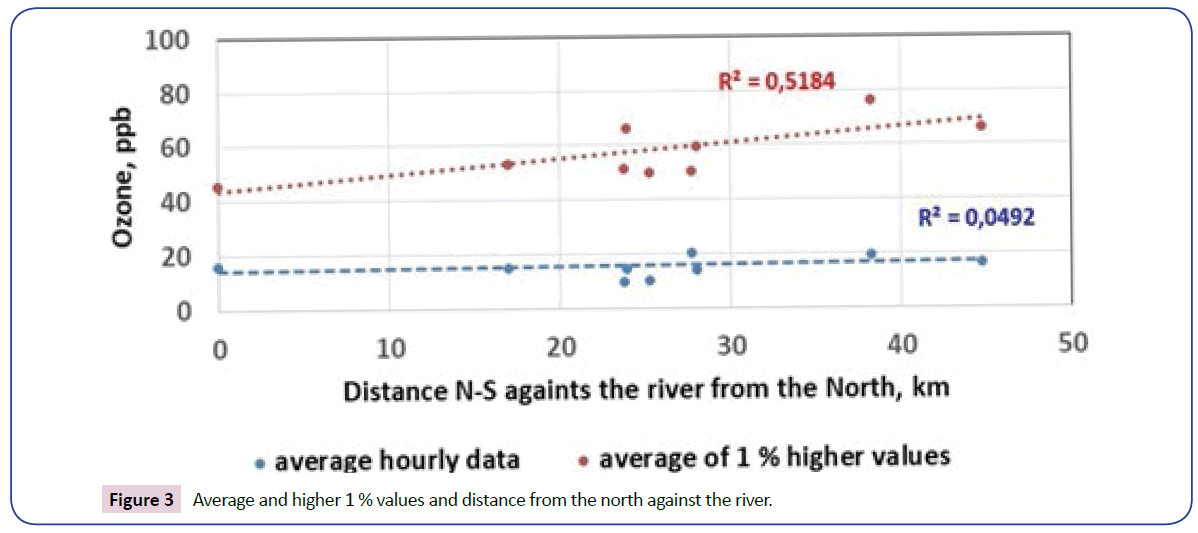
Table 4 shows the geographical positions of the stations with respect to two directions: The position along the Medellín River, which flows through the Valley in the south-north direction and the perpendicular distance from the river in the (approximate) east (-) and west (+) and compares them to hourly and maximum ozone concentrations. The great urban accumulations of the valley begin in Bello (about two km north of the second station, Bello-U San Buenaventura) and they extend a great distance, all the way to about two kilometers south of the Liceo Concejo de Itagüí station. Figure 3 shows the observed behavior.
| Sampling station | Distance along the river N to S km |
Distance normal to river (E to W), W+, km | Hourly ozone average, ppb | Average of the higher 1% hourly values ppb |
|---|---|---|---|---|
| Parque de las Aguas | 0, 00 | 0, 20 | 16, 6 | 46, 4 |
| Bello-Universidad San Buenaventura | 17, 00 | 1, 94 | 15, 7 | 54, 0 |
| Universidad Nacional | 23, 79 | 2, 43 | 10, 5 | 52, 0 |
| Tanques de Villahermosa | 23, 92 | -2, 82 | 15, 1 | 67, 0 |
| Museo de Antioquia | 25, 29 | -0, 94 | 10, 6 | 50, 5 |
| Tanques de Miraflores | 27, 77 | -2, 85 | 20, 9 | 51, 2 |
| Universidad de Medellín | 28, 07 | 3, 82 | 14, 8 | 60, 0 |
| Liceo Concejo de Itagüí | 38, 29 | 2, 98 | 20, 1 | 77, 0 |
| Caldas-U Lasallista | 44, 75 | 0, 30 | 17, 1 | 67, 0 |
Table 4: Position of the stations and hourly and higher 1 % concentrations.
It should be noted that the wind in the region tends to blow in a north-south direction, coming from the north. It is observed the values of ozone concentrations are higher, especially in the range of the upper range concentrations, as the station is more urban, reaching a peak towards Itagüí and then decrease slightly to the south. This shows that the combined effect of human activities and wind is related to ozone concentrations.
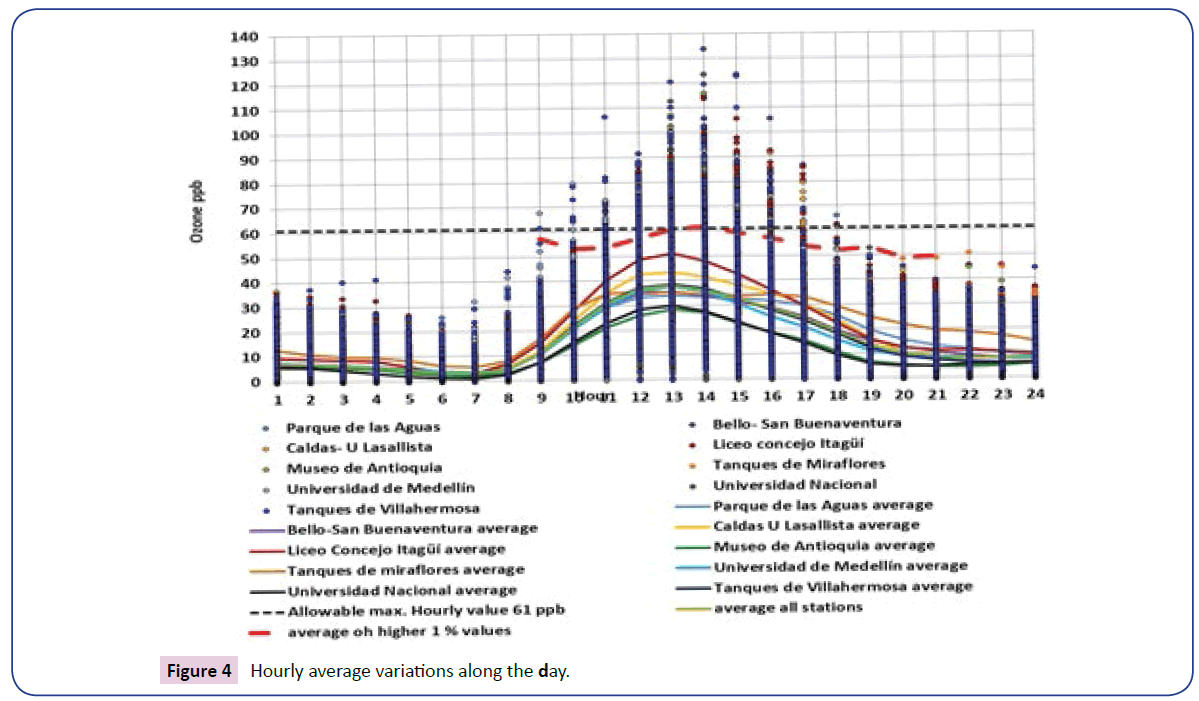
When performing the hourly study (Figure 4), it was observed that the different sampling station have a similar behavior at the peak of the day brightest hours, between 11 in the morning and 3 in the afternoon. If the average hourly values of each of the 9 stations are joined with lines as shown in figure 4, it can be seen that a peak appears at hour 13 and a minimum towards hour 7. This behavior is cyclical and similar for all sampling stations.
It is evident that the solar brightness affects the formation of ozone, the luminous intervals of the day being associated with the highest concentrations. The decrease of the concentrations presents in principle when large COVs are generated, coming from the high peaks of morning flow, which at that time occur with low solar intensity. Ozone acts as an oxidant of COVs, thus causing its consumptions and decreasing its concentrations, in the interval of 5 to 7 (in the morning). Although it can be considered that the industrial sector also generates some ozone and volatile and NOx emissions that can favor the formation of ozone, given that these sources tend to work continuously (furnaces and boilers), it could be concluded that their impacts on ozone concentrations in the region are small [3]. This taking into account that always every day and season, very low ozone values are reported between 4 am and 8 am.
When examining the hourly data of each day for the nine sampling stations, it is possible to appreciate a clear cyclic tendency in the behavior of the concentrations, with the appearance of a peak between 9 am in the morning and 5 pm in the afternoon.
Table 5a shows the percentages of hours in which the hourly average standard of 61 ppb is violated for each station and for the whole and the average values of the concentrations that exceed said norm.
| Sampling station | Number of hourly values | Percentage of values higher than the allowable hourly value (61 ppb) | Average of values that violate the norm, ppb |
|---|---|---|---|
| Parque de las Aguas | 14.360 | 0, 14 | 67, 4 |
| Bello-San Buenaventura | 13.529 | 0, 54 | 72, 6 |
| Universidad Nacional | 13.897 | 0, 54 | 70, 4 |
| Tanques de Villahermosa | 12.072 | 1, 52 | 75, 6 |
| Museo de Antioquia | 4.937 | 0, 65 | 75, 6 |
| Tanques de Miraflores | 939 | 0, 00 | ND |
| Universidad de Medellín | 13.966 | 0, 97 | 70, 3 |
| Liceo concejo Itagüí | 14.230 | 4, 08 | 72, 7 |
| Caldas U Lasallista | 13.397 | 1, 96 | 69, 8 |
| Total | 101.327 | 1, 35 | 72, 2 |
Table 5: Statistics of values that violate the hourly maximum allowable value.
| Sampling station | Averages of eight hour set from 8 am to 5 pm (ppb) | % of days violating the 41 ppb average 8 hour set norm |
|---|---|---|
| Parque de las Aguas | 28, 28 | 1, 82 |
| Bello-U San Buenaventura | 28, 53 | 4, 50 |
| Universidad Nacional | 21, 65 | 1, 19 |
| Tanques de Villahermosa | 29, 63 | 11, 39 |
| Museo de Antioquia | 20, 66 | 1, 40 |
| Tanques de Miraflores | 31, 72 | 5, 13 |
| Universidad de Medellín | 28, 12 | 5, 74 |
| Liceo Concejo Itagüí | 38, 66 | 38, 94 |
| Caldas-U Lasallista | 33, 92 | 21, 48 |
| All stations | 29, 02 | 11, 58 |
Table 6: Statistical results for the eight hour set for 8 am to 5 pm.
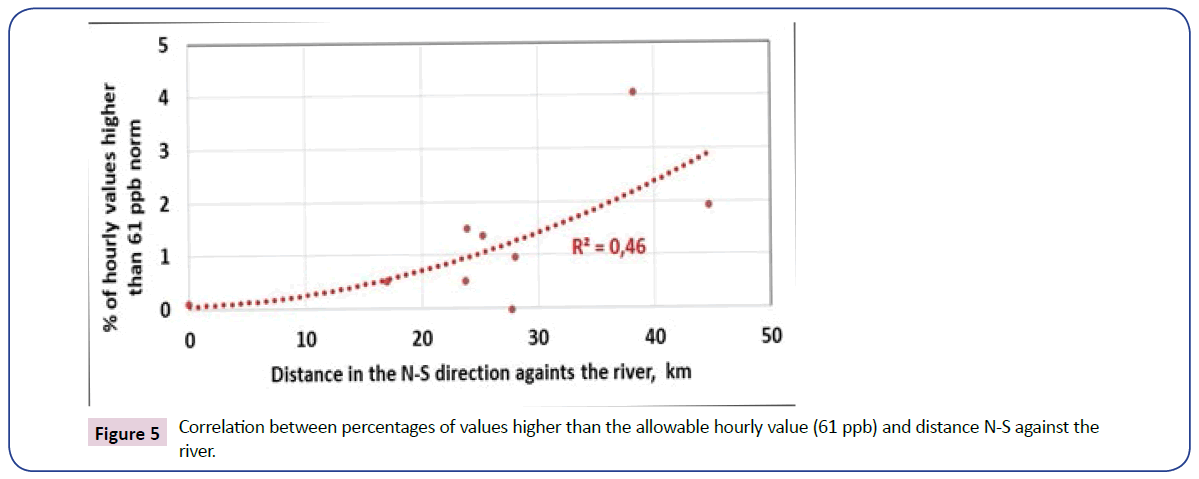
Figure 5 shows that those percentages tend to increase with wind direction, which is aligned with the distance N-S against the Medellín River.
Analysis of hourly data considering 8 hour averages
The standards for ozone are usually specified as values for a set of 8 hours, which will be referred to here as an eight-hour set concentration. Comparing the data for hours from 9 am to 4 pm which is the most severe of the 8-hour periods, against the eight-hour norm of 41 ppb, it is observed that, on average, none of the stations exceeded this limit. The closest case to the limit is that of the Liceo Concejo de Itagui station with an average of the this eight hour set of 38.7 ppb, 5.7% less than the value of the norm (Table 6).
| Parameter | Values |
|---|---|
| Ozone, daily average, M, ppb, all Sampling stations | 15, 5+/-4, 0 |
| Cloudiness, daily average, octets | 6, 7+/-1, 2 |
| Sun brightness, daily average, sunny hours | 5, 3+/-2, 8 |
| Precipitation, daily average mm H20 | 3, 8+/-7, 8 |
Table 7: Climate and ozone statistics.
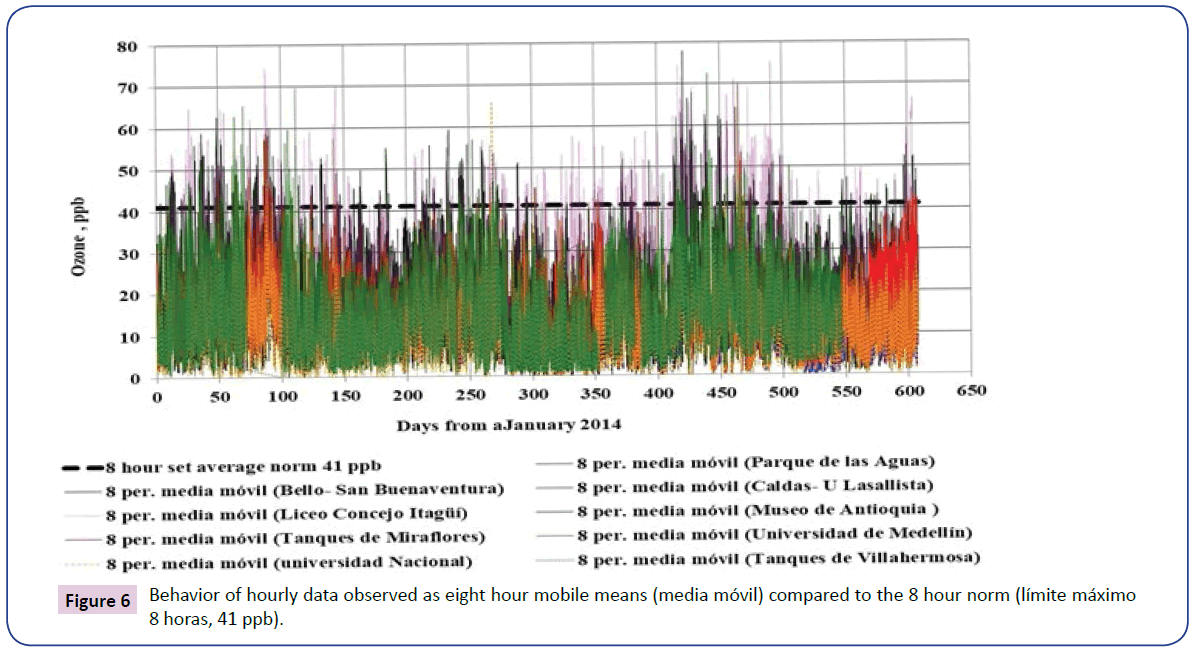
Figure 6 shows the total data reported as cumulative mobile means of 8 hours. The averages of 8 hours that exceed the norm correspond to instances of violation of said norm. It is observed that such a violation occurs with some frequency, but it is not something that happens constantly.
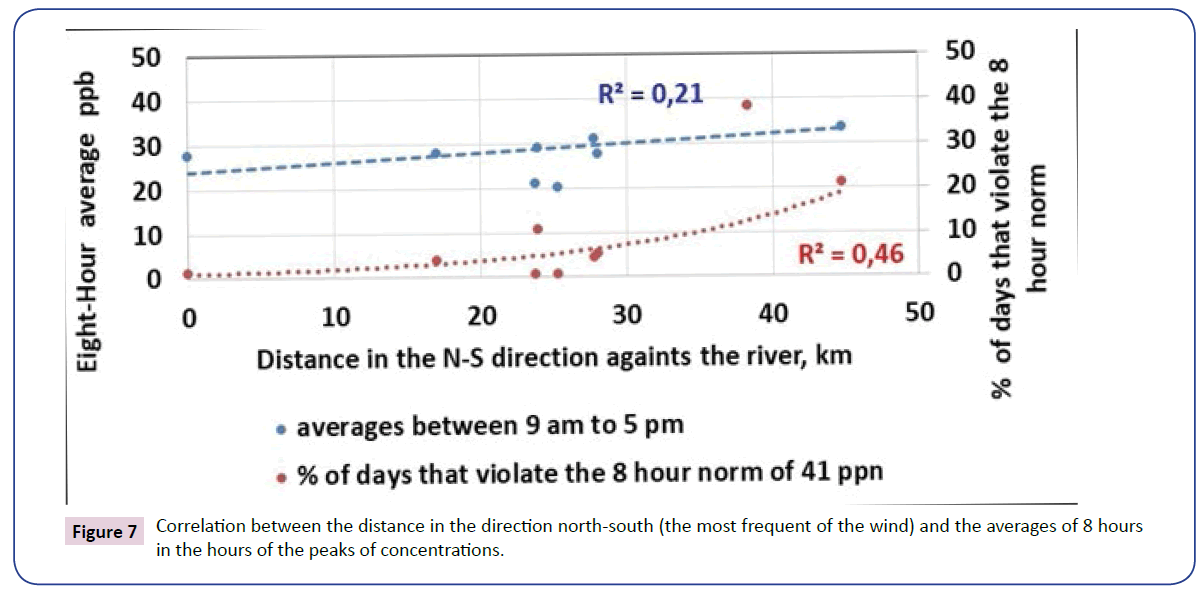
Figure 7 shows the relationship between the average 8-hour set at critical periods at the nine sampling stations and their distances in the north to south directions against the river. In similar fashion with the average hourly concentrations, it is found that the average data concentrations of 8 hours in the critical period and the violation frequencies of the 8-hour norm tend to increase with the distance from the north, which follows the predominant direction of the winds. In the present case, the correlation is even greater. This means that a certain cumulative effect of the impact of vehicular activity is appreciated as the wind advances north to south, in its passage through the metropolitan area. It should be noted that to the north, from the Parque de las Aguas, the cumulative concentration of vehicles is much lower, while it reaches its highest rate of accumulated growth in Itagui.
Analysis of relationships between ozone concentrations and some climatic phenomena
In addition to the study of the concentrations for the different days of the week and the hourly study, a study of the impact of some climatic factors was also carried out. The factors studied were precipitation of rainfall, in mm of water; solar brightness, in daily hours of sunshine (in the area the day has a fairly constant duration throughout the year, which is 12 hours) and cloudiness. The duration of solar brightness or heliophagy in hours, represents the total time during which light strikes directly over some locality, between dawn and dusk.). In the determination of cloudiness, the sky is divided into eight parts, each of which is an octet, an eighth of heaven. A normalized observation calibrates the amount of sky covered by clouds and in this way the number of octets of the moment is determined. Between zero and two octets the sky is clear or little cloudy. From three to five, partly cloudy sky, six cloudy, seven very cloudy and eight covered.
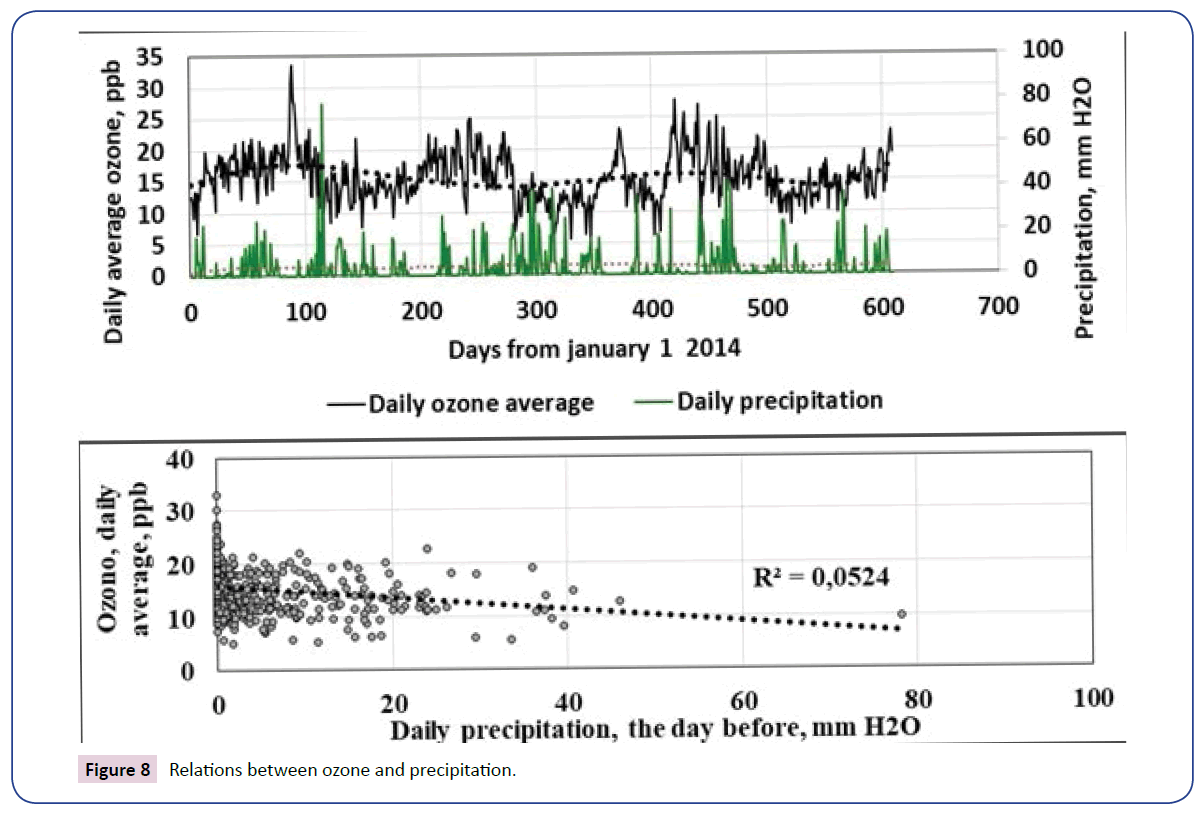
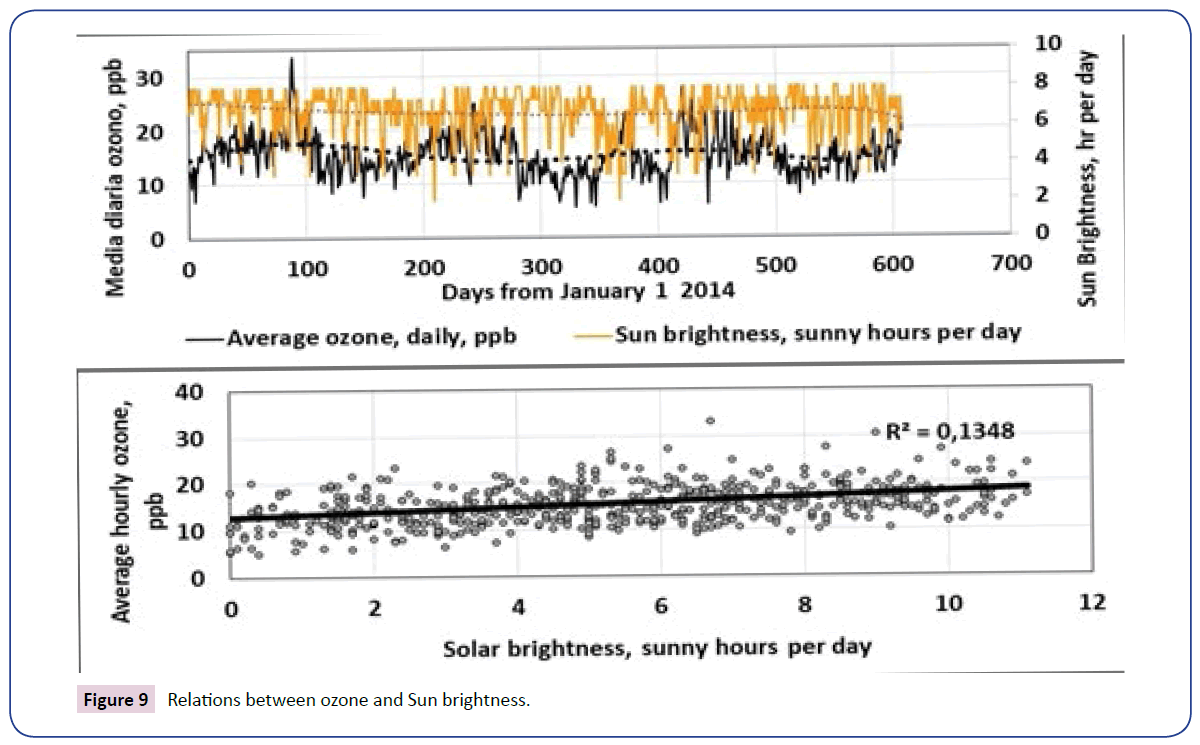
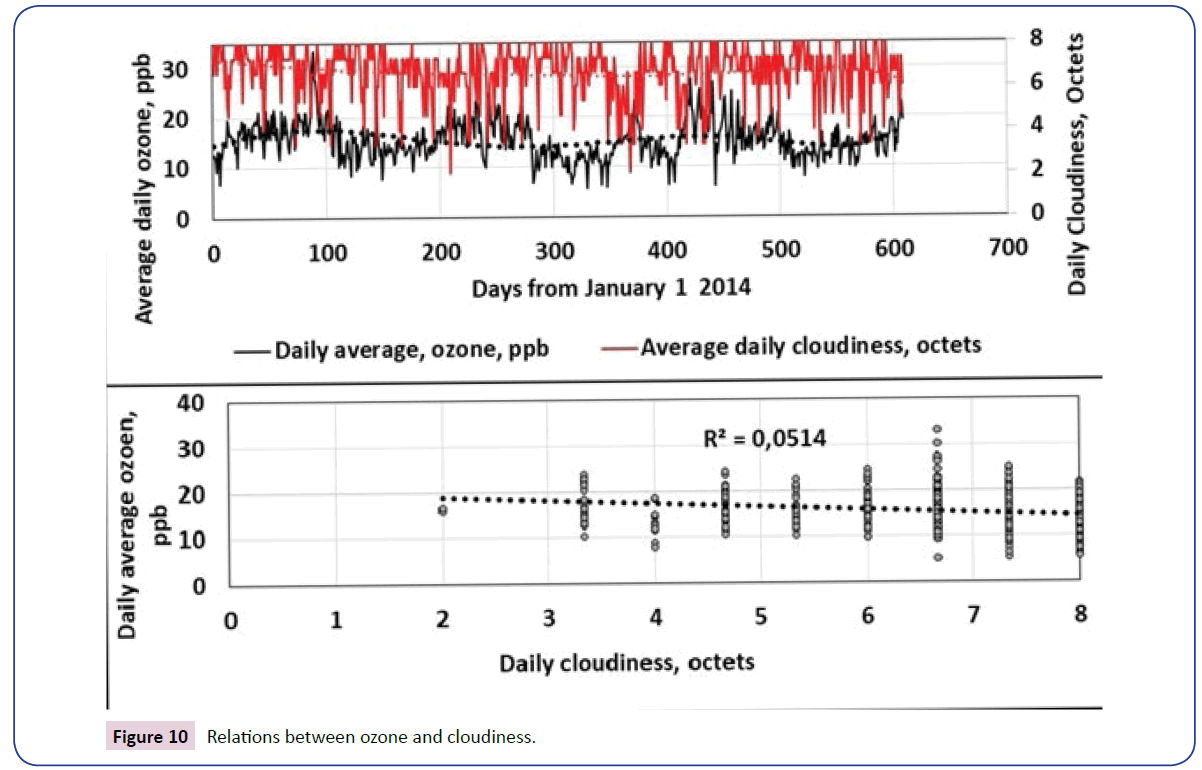
The data for these variables were reported by the meteorological station located at the Olaya Herrera Airport, towards the center of the Valley, in the same N-S distance as the station of the University of Medellin, approximately. The following Figures 8-10 and Table 7 show the statistics of these variables during the time of the ozone measurement.
It is seen, from Figures 8-10, that the relationships between climate variables and ozone are not clear, at least as observed from the statistical behavior in the study period. For the average values, there are very slight influences of precipitation (higher precipitation, lower average concentrations), solar brightness (higher brightness, higher average concentrations) and cloudiness (higher cloudiness, lower average concentrations). But they influences of very low correlation.
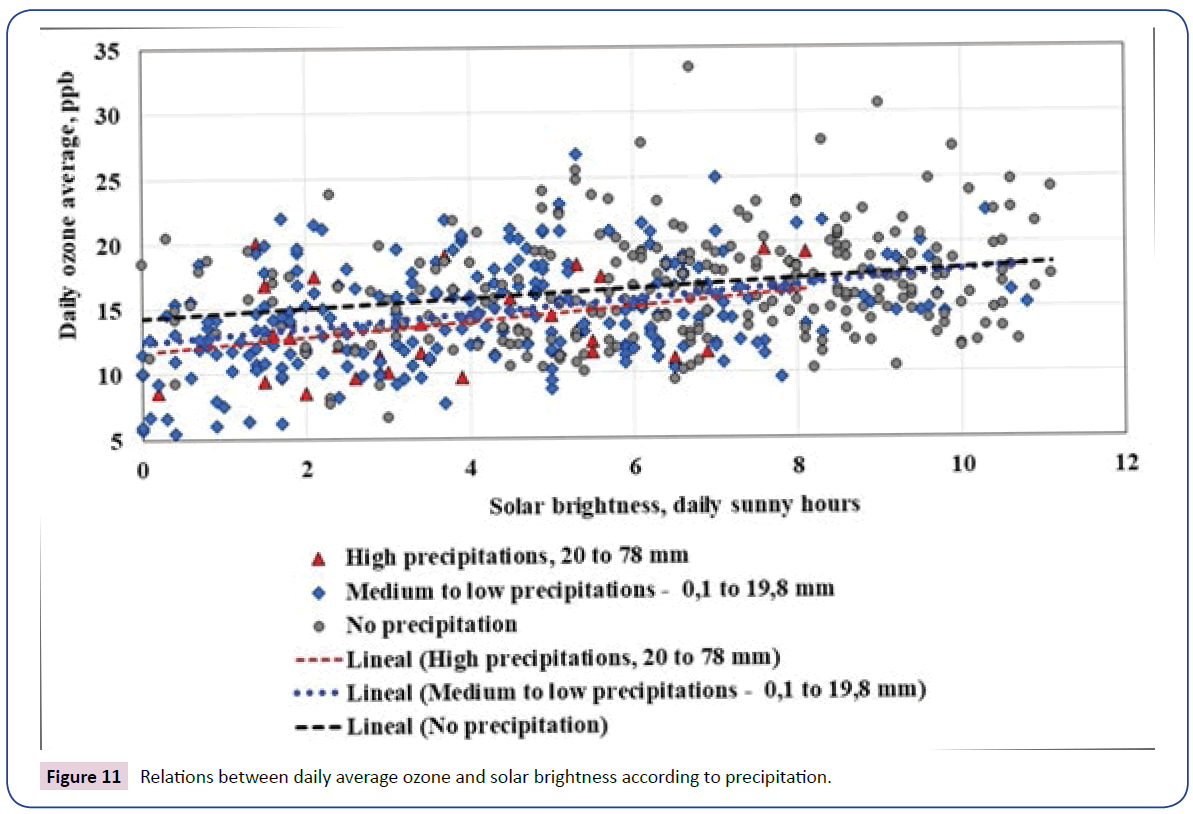
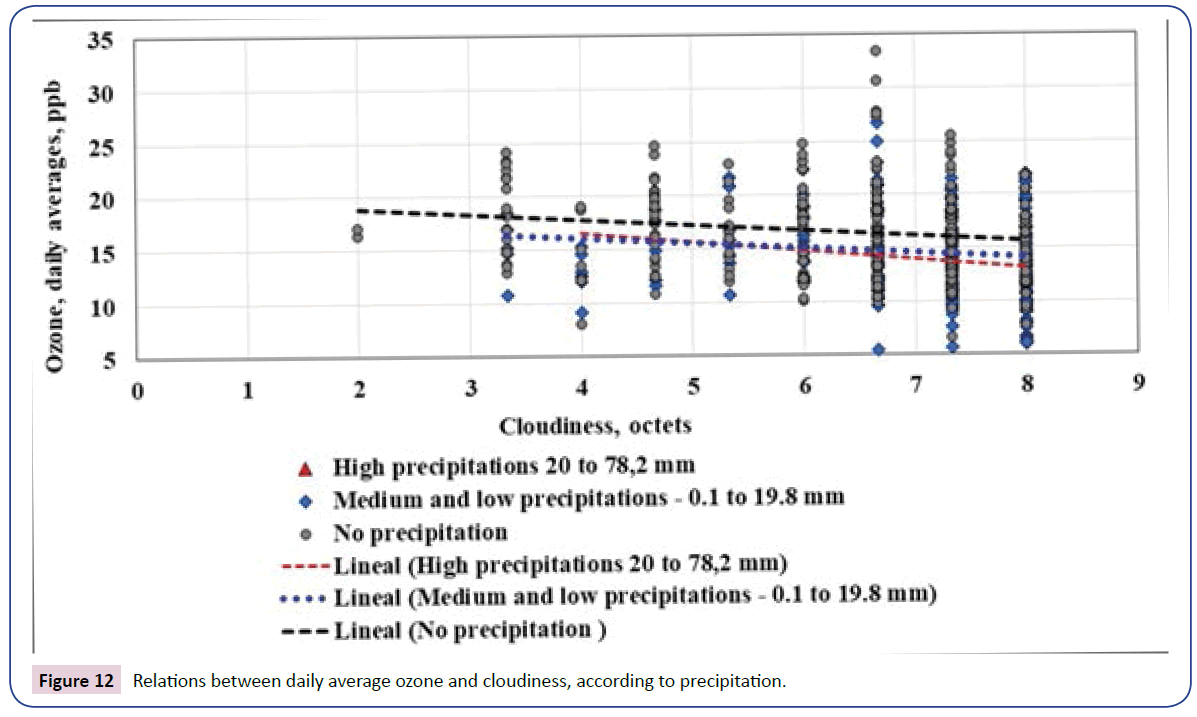
An additional exploration of the data sets was made, organizing them into three groups: days of high precipitation, days of medium or low precipitation and days without precipitation. Figures 11 and 12 show the results obtained, in which the following behavior is observed, for the average daily ozone concentrations. Average daily concentrations of ozone tend to increase with solar brightness and average daily concentrations of ozone tend to decrease with cloudiness. Both graphs show that the lower the precipitation, the higher the concentrations. It can be seen in Figures 11 and 12 that the slopes of the correlation lines are similar for the different levels of precipitation, which indicates that the influences of solar brightness and cloudiness correspond to physical-chemical realities, as expected, given the atmospheric reactions that largely govern the presence of ozone. It should be noted, however, that when studying the maximum daily values reported trying to correlate them with precipitation, solar brightness and cloudiness, no consistent influences of these variables are observed. This indicates that the maximum values correspond to special and specific circumstances of emissions (vehicle flow) and with precipitation, solar brightness or cloudiness associated with certain hours in the different sampling stations, which are not represented consistently by daily average measurements of the climate variables performed at the airport, a single point of the city.
Air quality indices (AQI) for pollution by ozone according to the data studied
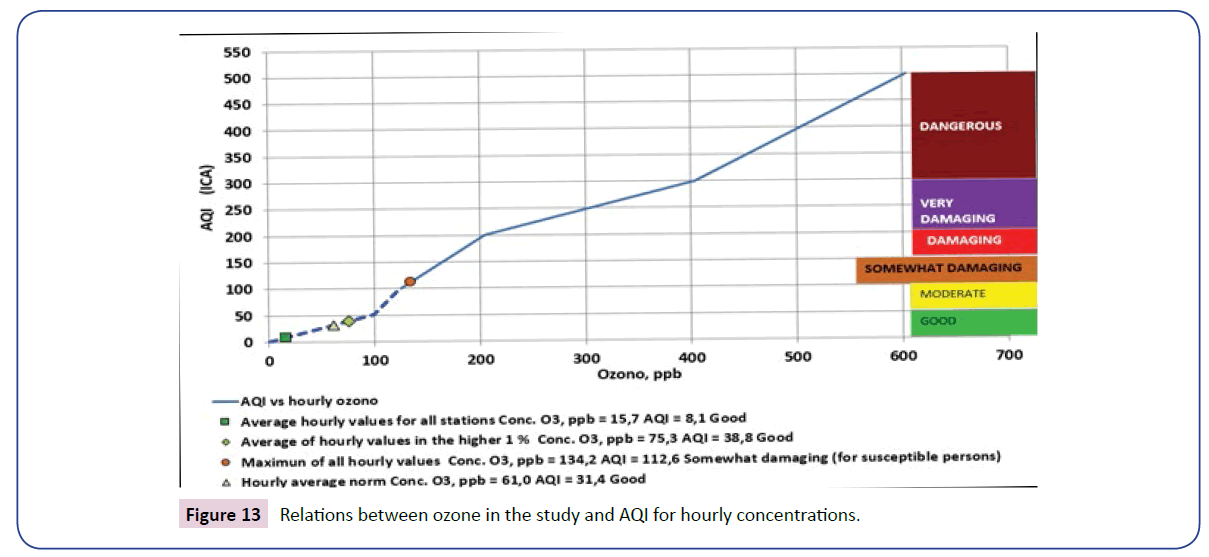
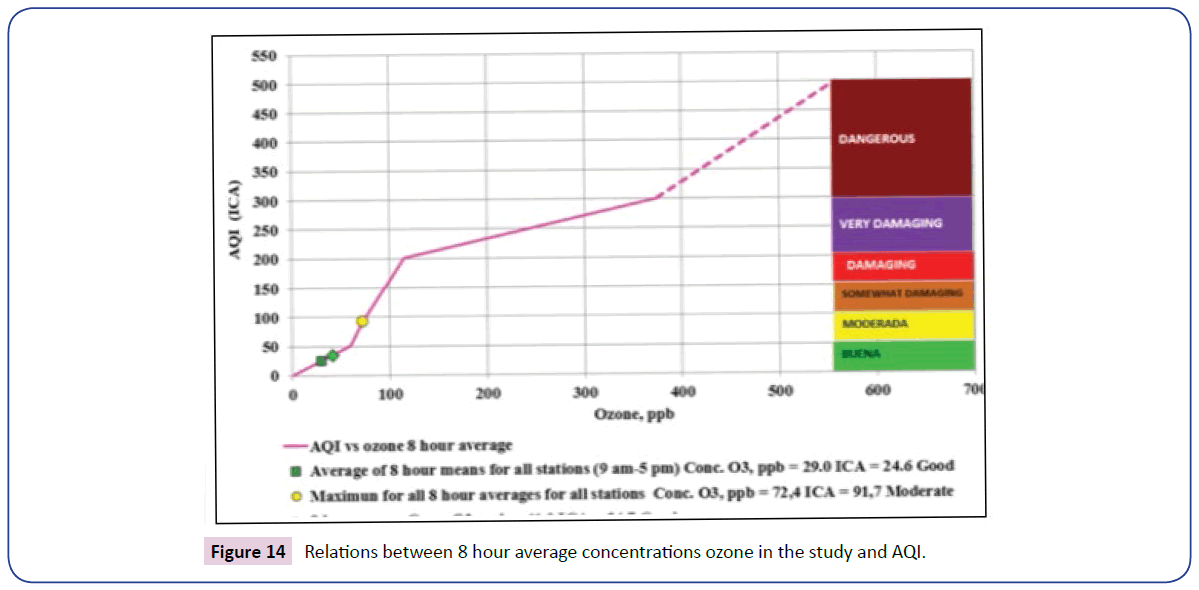
The local environmental authorities use air quality indexes (AQI, called ICA locally) to contribute to the interpretation of the levels of concentrations registered in the region and so understand their effects on public health. For this, numerical ranges are used, associated with colors. This index in Colombia has been adopted based on existing one in other countries, such as the ones generated by EPA, the Environmental Protection Agency of the United States [4].
Figures 13 and 14 and Table 8 show the criteria used for the particular AQI for ozone in its two categories (hourly values and 8 hour-average values).
| Color code and air quality interpretation | ICA (AQI) | Ozone hourly concentration ppb | Ozone 8 hour average concentration |
|---|---|---|---|
| Good | 0 | 0 | 0 |
| 50 | 97 | 59 | |
| Moderate | 51 | 99 | 60 |
| 100 | 123 | 75 | |
| Somewhat damaging (por susceptible people) | 101 | 125 | 76 |
| 150 | 164 | 95 | |
| Damaging (poor) | 151 | 165 | 96 |
| 200 | 204 | 115 | |
| Very damaging (Bad) | 201 | 205 | 116 |
| 300 | 404 | 374 | |
| Dangerous | 301 | 405 | 375 |
| 400 | 504 | 467 | |
| 401 | 505 | 468 | |
| 500 | 604 | 559 |
Table 8: Criteria for finding AQI for ozone in the region.
In Table 8 two zones have been added to the table generated by local authorities, in each type of concentration analyzed, in order to extrapolate to the extreme zones of the table, in which the respective scale is not reported.
Figures 13 and 14 show the AQI (ICA) values for the two ways of observing ozone during the period studied. From them it is deduced that no really harmful situations have been recorded in this period, even considering the situations of maximum hourly concentrations.
The ozone concentrations of the city of Medellín and the Aburra valley in the international context
Table 9 compares different cities in the world in the context of pollution by ozone concentrations, [5-20].
| City | Ozone, ppb |
|---|---|
| Amsterdam | 16, 3 |
| Beijing | 35, 0 |
| Bogotá | 9, 7 |
| Cochabamba | 31, 2 |
| Denver-Aurora | 39, 1 |
| Guadalajara | 39, 0 |
| Hong Kong | 19, 5 |
| Houston | 25, 7 |
| Yakarta | 10, 5 |
| Juárez | 23, 2 |
| La Paz | 16, 0 |
| León | 34, 5 |
| Lima | 17, 5 |
| Los Ángeles | 49, 2 |
| Madrid | 25, 8 |
| Manila | 34, 4 |
| Medellín and Aburrá Valley | 15, 7 |
| México | 29, 7 |
| Monterrey | 27, 6 |
| Montevideo | 20, 9 |
| Quito | 22, 1 |
| San Juan (AMSJ) | 42, 0 |
| Santiago de Chile | 14, 4 |
| Sao Paulo | 18, 0 |
| Tokio | 31, 4 |
| Average | 25, 9 |
| Medellín/Average | 0, 60 |
Table 9: Ozone concentrations in a sample of cities in the world.
It should be noted that it is not an easy task to locate information on ozone concentrations in different cities, which could for sure be valid for comparisons, given the different ways in which such data are reported.
Table 9 shows that Medellín shows lower values than the average of these cities.
Conclusions and Recommendations
It should be noted that the region has a fairly complete network of ozone measurement stations, which is very well operated. The data sets are available for scientific use and are regularly presented on the website of the environmental authority. With this, the region can develop greater awareness and maturity on its special environmental situations. It is expected that the work here presented, based essentially on data collected by the air quality network, will help to develop novel and useful ways to analyze such information. It is recommended that there be new calculation routines that yield statistical information management such as the ones here present.
When performing the hourly study, it is observed that the different seasons have a similar behavior at the peak of the day solar brightness, between 11 am in the morning and 3 pm in the afternoon. It can be seen that there is a peak towards the 13th hour and a minimum towards the 7th hour. The studied stations have a similar behavior, of a cyclical nature.
It is evident that the solar brightness impacts on the formation of ozone, the luminous intervals of the day being associated with the highest concentrations. The decrease of the concentrations must be presented in principle when large COVs are generated, coming from the high peaks of morning vehicle flow, which at that time occur with low solar intensity. Ozone acts as an oxidant of COVs, thus giving rise to lowering the same and decreasing their concentrations in the interval of 5 pm to 7 am (in the morning).
In principle it has been found that the situation of environmental pollution by ozone is, generally, within acceptable limits from the point of view of public health. With some frequency, which is low, situations occur above the established limits. Notwithstanding the above, it is possible to maintain the AQI indices within the category of good, with some small excursions into the moderated category. The calculated air quality indices indicate that the concentrations are within the permissible levels and do not represent an immediate risk to human health.
It is advisable to make a more detailed study of the relationship between mobile sources in the Aburra Valley region and ozone concentrations, in order to characterize the different categories of vehicles as generators of ozone precursors. As a result of this analysis, restriction or control measures may be presented.
It is worth trying to make studies in the atmosphere trying to correlate the concentrations and emissions of particulate matter, NOx and HC to ozone. This will allow for better criteria on how to control ozone concentrations. This is important as it is often mentioned, in various environmental circles of the region, that there are high-risk situations for health in this region due to ozone. The results of the present study do not lead to this conclusion. But it is expected that the situation will deteriorates when considering the growth of the vehicle fleet (including motorcycles) and the presence of episodes of pollution related to PM2.5 such as those presented recently in the region, originated in the complex topography of the valley, in the climate and the low levels of existing air speed and ventilation.
Acknowledgments
Thanks are given to local environmental authority, Área Metropolitana del Valle de Aburrá (AMVA), to the Universidad Nacional de Colombia – Sede Medellín, Facultad de Minas, Laboratorio Calaire and to the Instituto de Hidrología, Meteorología y Estudios Ambientales de Colombia, for providing the data on which this study was based. Likewise, to the Politécnico Colombiano Jaime Isaza Cadavid for providing Hatch Indisa and the main author with many opportunities to collaborate and participate in projects related to the study of the environmental conditions of the Valle de Aburrá region.
References
- Martinez E, Bedoya J (2009) Air Quality in the Valle De Aburrá Antioquia: Colombia. DYNA 76: 7-15.
- World Health Organization (2005) Air Quality guidelines, Global Update 2005. Particulate matter, ozone, nitrogen dioxide and sulfur dioxide.
- Toro MV, Cremades LV, Calbó J (2006) Relationship between VOC and NOx emissions and chemical production of tropospheric ozone in the Aburrá Valley (Colombia). Chemosphere 65: 8-881.
- Internet web page of Área Metropolitana del Valle de Aburrá, local environmental authority. https://www.metropol.gov.co
- Posada E, Gómez M, Almanza J (2017) Comparative analysis and modeling of air quality situations in a sample of cities around the world. Comparison with the case of Medellín. Polytechnical Magazine 13: 25.
- Blaszczak RJ (1999) Nitrogen Oxides (NOx), Why and how they are controlled EPA-456/F-99-006R.U.S EPA North Carolina.
- Kioumourtzoglou MA, Schwartz J, James P, Dominici F, Zanobetti A (2016) PM2.5 and mortality in 207 US cities: Modification by temperature and city characteristics. Epidemiology 27: 221-227.
- Martins LD, Vidotto LHB, Ameida D S de, Squizatto R, Moreira CAB, et al. (2016) The role of medium-sized Cities for Global Tropospheric Ozone Levels. Energy Procedia 95: 265-271.
- Sillman S (1999) The relation between ozone, NOx and hydrocarbons in urban and polluted rural environments. Atmos Environ 33: 1821-1845.
- Camalier L, Cox W, Dolwick P (2007) The effects of meteorology on ozone in urban areas and their use in assessing ozone trends. Atmos Environ 41: 7127-7137.
- Stock ZS, Russo MR, Pyle JA (2014) Representing ozone extremes in European megacities: The importance of resolution in a global chemistry climate model. Atmos Chem Phys 14: 3899-3912.
- Jenkin M, Clemitshaw K (2000) Ozone and other secondary photochemical pollutants: Chemical processes governing their formation in the planetary boundary layer. Atmos Environ 34: 2499-2527.
- Silva AA, Tomaz LM (2013) Surface ozone concentrations and local cloud cover at an urban, tropical site in the Southern Hemisphere. J Atmospheric Sol-Terr Phy 105: 54-60.
- Wałaszek K, Kryza M, Szymanowski M, Werner M, Ojrzyńska H (2017) Sensitivity study of cloud cover and ozone modeling to microphysics parameterization. Pure and Applied Geophysics 174: 491-510.
- Tie X, Madronich S, Walters S, Zhang R, Rasch P, et al. (2003) Effect of clouds on photolysis and oxidants in the troposphere. J Geophys Res Atmos 108: 4642.
- Bloomfield P, Royle JA, Steinberg LJ, Yang Q (1996) Accounting for meteorological effects in measuring urban ozone levels and trends. Atmos Environ 30: 3067-3077.
- Bell ML, McDermott A, Zeger SL, Samet JM, Dominici F (2004) Ozone and short-term mortality in 95 US Urban Communities, 1987-2000. JAMA 292: 2372-2378.
- Latest Findings on National Air Quality: 2002 Status and Trends (2003). U.S. EPA North Carolina.
- Kyle AD, Woodruff TJ, Buffler PA, Davis DL (2002) Use of an index to reflect the aggregate burden of long-term exposure to criteria air pollutants in the United States. Environ Health Perspect 110: 95-102.
- Health effects of outdoor air pollution (1996) Committee of the Environmental and Occupational Health Assembly of the American Thoracic Society. Am J Respir Crit Care Med 153: 3-50.
Open Access Journals
- Aquaculture & Veterinary Science
- Chemistry & Chemical Sciences
- Clinical Sciences
- Engineering
- General Science
- Genetics & Molecular Biology
- Health Care & Nursing
- Immunology & Microbiology
- Materials Science
- Mathematics & Physics
- Medical Sciences
- Neurology & Psychiatry
- Oncology & Cancer Science
- Pharmaceutical Sciences
