ISSN : 2393-8854
Global Journal of Research and Review
Spatiotemporal Characteristics of Ground Water Level Fluctuation in Jaipur Urban Area Rajasthan, India
1Research Scholar, Department of Physical Sciences, Mahatma Gandhi Chitrakoot Gramodaya Vishwavidyalaya, Chitrakoot, M.P.-485780
2Research Fellow, Madhya Pradesh Council of Science & Technology, Vigyan Bhawan, Bhopal Madhya Pradesh-462003
3HOD, Department of Physical Sciences, Mahatma Gandhi Chitrakoot Gramodaya Vishwavidyalaya, Chitrakoot, M.P.-485780
Abstract
Ground water level fluctuation space to space (Spatial) and time to time (Temporal) is a major problem in India and the assessment of spatiotemporal characteristics water level fluctuation trend is very important in the point of view of future development. Water level fluctuation in Jaipur city is a major problem. Water level data is collected by field survey & PHE department and population data from census of India. Analysis of population data shows that city population is increasing by leaps & bound in last few decades and highest population growth is found in 1941-51. Major part of water supply comes from ground water so as the population increases parallely the water requirement pressure became on ground water decade by decade. Water level data of last two decade is collected from different places such as Durgapur, Jhotwara, MES Jiapur, Sirsi, Amer, Gopalpura by pass, Mansrovar, Mehona and Surya nagar. Amer and Mehona show an uneven trend of water level but remaining all places show a continuous depleting trend of water level. Average water level of Jaipur urban area was 28.873 meters (mbgl) in 1995; that is continuous decreasing and reached at 47.488 meters (mbgl) in 2010. Over exploration of ground water, less recharging and shrinkage & dryness of surface water bodies are may be the main reasons of this depleting water level so it is suggested to prepare a plan for proper rainwater harvesting and use this water for different purposes in off monsoon season.
Keywords
Ground water level, Fluctuation, Population growth, Jaipur city.
INTRODUCTION
Rapid industrial development, urbanization and increase in agricultural production have led to freshwater shortages in many parts of the world. To proper supply of water for various purposes like agricultural, domestic and industrial, a greater emphasis is being laid for a planned and optimal utilization of water resources. The water requirement for agriculture, municipal and industries is larger than the annual recharge. This may lead to depletion of ground water. On other hand, continuous withdrawals from groundwater reservoir in excess of replenishable recharge may result in lowering of water table. In Jaipur city due to rapid urbanization and very fast population growth; ground water level is depleting at very fast rate from last decades [1,2].
The process of urbanization is a universal phenomenon taking place the world over, where humans dwell. The urban sprawl growth and changes are studied in the developed countries [3-9] and recent developing countries such as China [10,11] and India [12-14].
The Central Groundwater Board has identified that increasing population; deficient monsoons, unregulated wells, and dependency on loans for costly agricultural inputs have created stress on ground water [15]. In recent time many researchers are used GIS for evaluation and management of groundwater resources of the various terrains [16-20]. Jaipur city is facing the problem of water scarcity and tremendous pressure on ground water due to rapid urbanization [21].
Study area
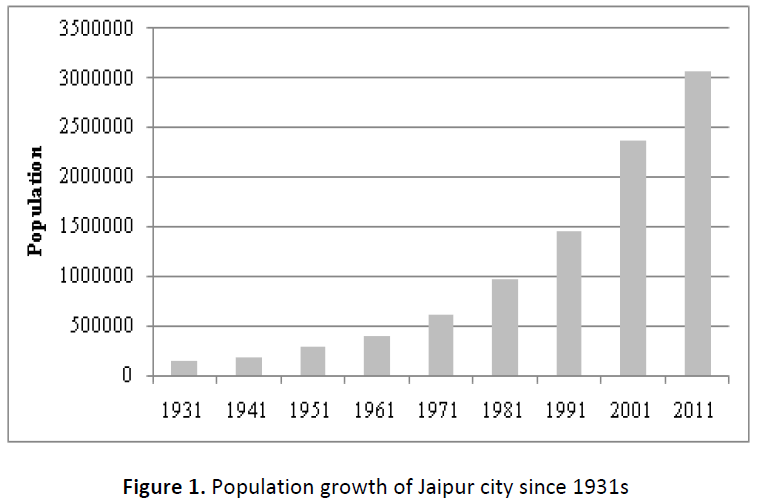
The areal extension of Jaipur Urban area is between North latitudes 26°47’ to 27°02’ and East longitudes 75°36’ to 75°55’; almost in the centre of the district and covers an area of about 470 sq. km. The Jaipur agglomerate has parts of Sanganer (45.5 %), Jhotwara (42.5 %) and Amer (12 %) blocks. Jhotwara block which constitutes the major part of the urban city has a population density of 2745 persons/sq. km. With the increase in the rate of urbanization the population of the city also increased many fold during the last 8 decades. The decadal growth rate of population is highest during 1941 – 51 as 65.59 % followed by 62.77 % during 1991– 2001. The population growth since 1931 is given below in table 1 and shown in Fig. 1.
Table 1: Decadal population growth of Jaipur city
| Decadal population growth % | ||
|---|---|---|
| Years | Population | Decadal growth % |
| 1931 | 150000 | |
| 1941 | 175810 | 17.21 |
| 1951 | 291130 | 65.59 |
| 1961 | 403444 | 38.58 |
| 1971 | 615258 | 52.5 |
| 1981 | 977165 | 58.82 |
| 1991 | 1458438 | 49.26 |
| 2001 | 2374000 | 62.77 |
| 2011 | 3073350 | 29.45 |
Physiographically the city area is characterized by sandy-plains, hills, intermountain-valleys, pediments etc. Major part of the city is covered by the alluvial sandy plains which are dissected at places. In the northern and eastern parts, the Aravalli Hill Ranges, trending north eastsouth west alternating with intermountainvalleys, constitute significant signatures of physiography. The ridges are generally made-up of resistant quartzite rocks. Important among these are the Nahargarh, Amer, Puranaghat and Jhalana Hills. The highest peak of these hills is about 648 meter above mean sea level (msl). The average mean annual rainfall of Jaipur city is 567.70 mm. The highest rainfall has been recorded as 1101.90 mm at Sanganer (1981), 1008 mm at Amer (1995) and 887 mm at Jaipur (1996), where as lowest rainfall has been recorded at Sanganer as 206 mm (1980), at Amer as 235.00 mm (2002) and at Jaipur as 222.40 mm (2002) fig. 2.
MATERIALS AND METHODOLOGY
To the study of water level fluctuation in Jaipur urban area, population data of last decades is taken from census of India and ground water level data from PHE (Public Health Engineering) department of Jaipur urban area. To assess the water level fluctuation, water level data of last 20 years is analyze and saw that as population is increased parallel the requirement of water is also increased that’s why tremendous pressure of water requirement is generated and that water requirement is fulfilled by ground water so day by day ground water level is varying.
RESULT AND DISCUSSION
Population data of Jaipur city since 1931 shows that population is increasing at very fast rate. In 1931 population of Jaipur city is 150000 and after 80 years in 2011 has increased leaps & bound and reached at 8073350 (Fig. 1). Highest decadal growth is found in between 1941-51 which is 65.59 % and least growth rate found in 1931-41 which is 17.3 % (Table. 1).
Water supply data and population data shows that as population increased water supply is also increased and maximum water supply is completed by ground water so tremendous pressure is generate on ground water. In 1980, 108 mld water is explored from ground but in 2010 it increased and reached at 300 mld (Table. 2).
Table 2: Status of water supply in Jaipur city (MLD)
| Years | Surface water | Ground water | Total water supply |
|---|---|---|---|
| 1980 | 27 (Ramgarh Lake) | 108 | 135 |
| 1985 | 29.5 (Ramgarh Lake) | 136.35 | 165.6 |
| 1990 | 11.60 (Ramgarh Lake) | 152.9 | 174.6 |
| 1995 | 11.25 (Ramgarh Lake) | 209.25 | 220.5 |
| 2000 | 32.00 (Ramgarh Lake) | 300 | 332 |
| 2005 | 328 | 328 | |
| 2010 | 50.00 (Ramgarh Lake) | 300 | 350 |
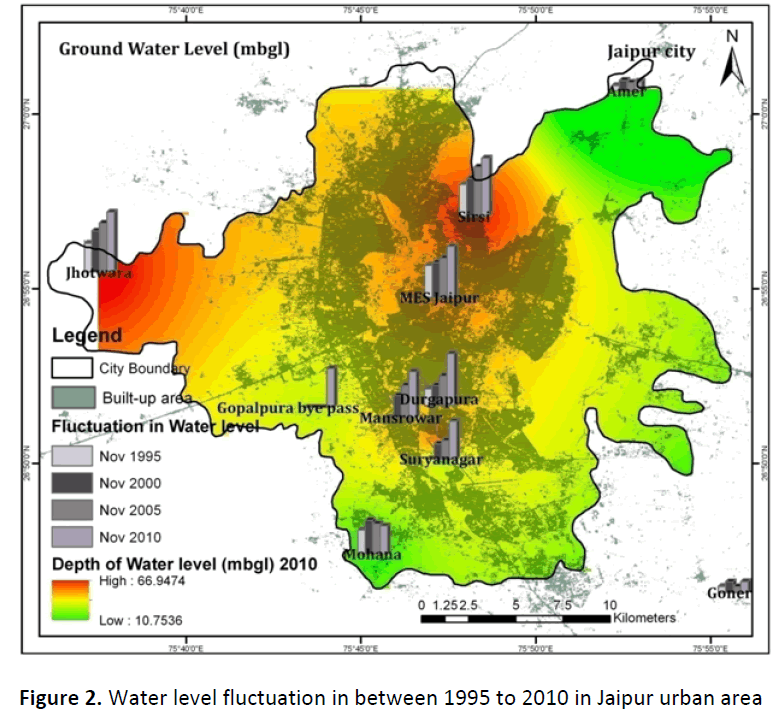
Ground water level data of different places of Jaipur city is taken since Nov 1995 to Nov 2010. These places are Durgapur, Jhotwara, MES Jiapur, Sirsi, Amer, Gopalpura by pass, Mansrovar, Mehona and Surya nagar etc. Analysis of ground water level data shows that water level is continuously decreasing since 1995 with some fluctuation. At some places such as Amer and Mehona shows fluctuation in ground water level but at all places shows a continuous decline in water level (Fig. 2). Average ground water level is also decline with time. Average water level of Jaipur city is 25.873 mbgl in 1995 which is decline with time and reached at 47.488 mbgl in Nov 2010 (Table. 3).
Table 3: Depth of water level in Jaipur city
| Place Name | Depth of Water level (mbgl) | Location | ||||
|---|---|---|---|---|---|---|
| Nov-95 | Nov-00 | Nov-05 | Nov-10 | Latitude (N) | Longitude (E) | |
| Durgapura | 18.98 | 22.8 | 33.54 | 58.4 | 26.845814 | 75.786564 |
| Jhotwara | 32.28 | 46 | 54.7 | 66.95 | 26.953628 | 75.743064 |
| MES Jaipur | 35.95 | 39.14 | 43.97 | 57.35 | 26.912519 | 75.787514 |
| Sirsi | 35.45 | 42.17 | 55.02 | 65.1 | 26.951331 | 75.804003 |
| Amer | 5.73 | 11.77 | 9.31 | 10.75 | 26.985486 | 75.851344 |
| Gopalpura bye pass | 0 | 0 | 0 | 43.5 | 26.879883 | 75.750119 |
| Mansrowar | 0 | 24.62 | 35.95 | 51.45 | 26.855231 | 75.769186 |
| Mohana | 26.85 | 37.87 | 33.73 | 31.5 | 26.781536 | 75.743428 |
| Suryanagar | 0 | 16.82 | 20.59 | 42.4 | 26.835481 | 75.788497 |
| Average | 25.873 | 30.148 | 35.851 | 47.488 | ||
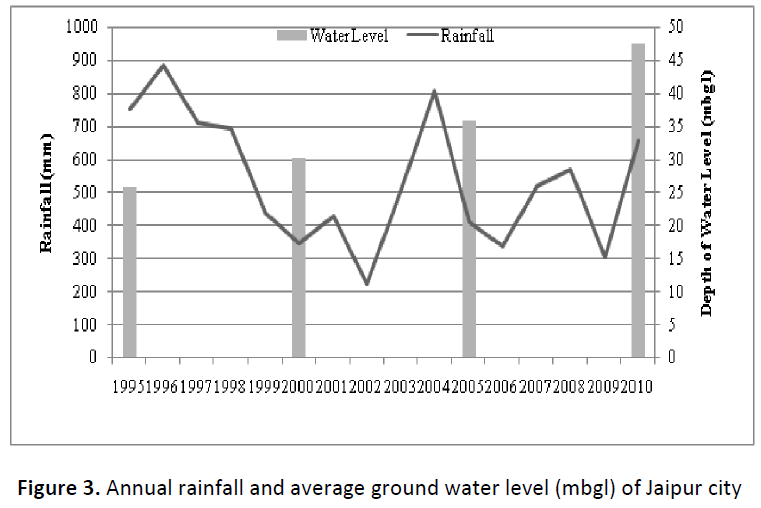
Rainfall data shows that Jaipur has normal quantity with some fluctuation and varies in between 300 mm to 600 mm (Fig. 3). In spite of having normal rainfall, water level is continuously decreasing.
By the analysis of ground water data, table shows that ground water level is continuously decreasing. But rainfall shows that Jaipur has a normal rainfall. As the population increased; amount of water for consumption is also increased and major part of this water supply is come from ground water so ground water exploration is increasing day by day and water level is decline day by day.
CONCLUSION
Study of spatiotemporal characteristics of ground water fluctuation in Jaipur city shows that water level is continuously decreasing from last few decades. Jaipur city is facing the problem of water scarcity for domestic and other purposes. To reduce this problem it must be prepare a rain water harvesting plan to enhance the capacity of ground water recharge and use of this water in off-monsoon season.
REFERENCES
- Jethoo A.S, Poonia M.P (2011). Sustainable Water Supply Policy for Jaipur City, International Journal of Environmental Sciences, 1 (6): 1235-1240.
- Jethoo, A. S. and Poonia, M.P (2011). Water Consumption Pattern of Jaipur City (India), International Journal of Environmental Science and Development, 2 (2).
- The Regionalist (1997). Debate on Theories of David Rusk, 2 (3).
- Sierra Club, 1998. The Dark Side of the American Dream: The Costs and Consequences of Suburban Sprawl.
- Batty M., Xie Y., Sun Z. (1999). The dynamics of urban sprawl. Working Paper Series, Paper 15, Centre for Advanced Spatial Analysis, University College, London.
- Torrens, P.M., Alberti, M. (2000). Measuring sprawl. Working paper no. 27, Centre for Advanced Spatial Analysis, University College, London.
- Barnes K.B., Morgan III, J.M., Roberge, M.C., Lowe, S. (2001). Sprawl Development: Its Patterns, Consequences, and Measurement. Towson University, Towson.
- Hurd, J.D., Wilson, E.H., Lammey, S.G., Civco, D.L. (2001). Characterisation of forest fragmentation and urban sprawl using time sequential Landsat Imagery. In: Proceedings of the ASPRS Annual Convention, St. Louis, MO, April 23–27, 2001.
- Epstein, J., Payne, K., Kramer, E. (2002). Techniques for mapping suburban sprawl. Photogrammetr. Eng. Remote Sens. 63 (9): 913–918.
- Yeh, A.G.O., Li, X. (2001). Measurement and monitoring of urban sprawl in a rapidly growing region using entropy. Photogrammetr. Eng. Remote Sens. 67 (1): 83.
- Cheng, J. & Masser, I. (2003). Urban growth pattern modelling: a case study of Wuhan City, PR China. Landscape Urban Plan. 62, 199–217.
- Jothimani, P. (1997). Operational urban sprawl monitoring using satellite remote sensing: excerpts from the studies of Ahmedabad, Vadodara and Surat, India. Paper presented at 18th Asian Conference on Remote Sensing held during October 20– 24, 1997, Malaysia.
- Lata, K.M., Sankar Rao, C.H., Krishna Prasad, V., Badrinath, K.V.S., Raghavaswamy (2001). Measuring urban sprawl: a case study of Hyderabad. GIS Dev. 5(12).
- Sudhira, H. S., Ramachandra, T. V., and Jagadish, K. S. (2003). Urban sprawl pattern recognition and modelling using GIS. Paper presented at Map India, New Delhi. January 28–31.
- Central Ground Water Board (2006). Dynamic Ground Water Resources of India. Ministry of Water Resources, Government of India, Faridabad. Postel, S. (1999). “Pillar of Sand: Can the Irrigation Miracle last?”. Norton: New York.
- Prasad, R.K., Mondal, N.C. and Singh, V.S. (2008). Evaluation of groundwater resources potential using GIS in Kurmapalli watershed of Andhra Pradesh. J. Geol. Soc. India, 71, 661-669.
- Rokade, V.M., Kundan, P. and Joshi, A.K. (2007). Groundwater Potential Modelling through Remote Sensing and GIS: A case study from Rajura Taluka, Chandrapur District, Maharastra. J. Geol. Soc. India, 69, 943-948.
- Jha, K. Madan and Chawdary, V.M. (2007) Challenges of using remote sensing and GIS in developing nations. Hydrogeology Journal, 15, 197-200.
- Leblanc, M., Favreau, G., Tweed, S., Leduc, C., Razack, M. and Mofor, L. (2007). remote sensing for groundwater modeling in large semiarid areas, Lake Chad Basin, Africa. Hydrogeology J., 15, 97-100.
- Saraf, A.K., Choudhury, P.R., Roy, B., Sharma, B., Vijay, S. and Choudhury, S. (2004). GIS based surface hydrological modelling in identification of groundwater recharge zones. Int. J. Remote Sensing, 25: 5759-5770.
- Teeuw, R.M. (1995). Groundwater exploration using remote sensing and low cost geographical information system. Hydrogeology J., 3 (3): 21-30.
Open Access Journals
- Aquaculture & Veterinary Science
- Chemistry & Chemical Sciences
- Clinical Sciences
- Engineering
- General Science
- Genetics & Molecular Biology
- Health Care & Nursing
- Immunology & Microbiology
- Materials Science
- Mathematics & Physics
- Medical Sciences
- Neurology & Psychiatry
- Oncology & Cancer Science
- Pharmaceutical Sciences


