ISSN : 2393-8854
Global Journal of Research and Review
Phylogenetic Relationships among Different Lines of Rabbits in Egypt
Abstract
Molecular variations were investigated in four rabbit lines namely Alexandria, V-line, New Zealand white and California in order to find special molecular genetic markers which can differentiate among studied lines. Five out of 10 RAPD primers exhibited sufficient variability and were used to characterize the genetic similarity and diversity among studied lines. A total of 198 DNA bands were detected. Phylogenetic analysis using Nei and Hi method generally produced four clusters which were completely distinguished based on the locality of the rabbits. From the phylogenetic tree, the genotypes Alexandria and V-line appeared to be closely related, and also the genotypes V-line and California. So, the results indicated the efficacy of RAPDPCR technique to detect similarity among rabbit genotypes and their applicability in establishing genetic relationships among them.
Keywords
Rabbits, Molecular markers, RAPD-PCR, Phylogenetic tree.
Introduction
Analysis of genetic variation and relatedness between strains is a prerequisite towards effective utilization of molecular DNA markers for the recognition of genetic resources that are economically important [6]. So, more studies are needed to characterize rabbit’s lines genetically and to estimate the genetic variability among them in order to enhance selection and breeding. So, the main object was to determine genetic similarity and diversity in four rabbit genotypes namely Alexandria, V-line, New Zealand white and California. Random amplified polymorphism DNA (RAPD) technique was applied to find out genetic similarity among four rabbit lines. Usage of DNA molecular markers can subscribe significantly to the development and enforcement of genetic improvement programs. Also, RAPD analysis becomes an important technique for identifying the markers linked to economical traits of interest without the necessity for mapping the entire genome [1]. The efficacy of RAPDPCR in detecting polymorphism between rabbit strains and their applicability in population studies and establishing genetic relationships among populations have been reported by Sharma et al. (2001).
Materials and Methods
Experimental Animals
The experimental animals involved in this study were four different lines of rabbits:
a) Alexandria
A synthetic paternal rabbit line was established and progressing at the nucleus breeding rabbit unit of the Poultry Research Center, Faculty of Agriculture, Alexandria University, Egypt [2].
b) V-line
A synthetic maternal line originated at the Department of Animal Science of the Politecnica de Valencia University, Spain and imported to Egypt.
c) New Zealand white
Breed came from a complicated background of different breeding programs across the United States. It is found that this white variety came from the cross breeding of the Flemish Giant, American White, and Angora.
d) Californian
Breed was developed by George West in Southern California. He crossed Himalayan breeds and Chinchilla rabbit breed and then crossed the offspring with New Zealand Whites.
Housing and management
Rabbits of this study were housed in a rabbitry and were fed commercial pelleted diet containing 18% crude protein, 13% crude fiber and 2600 Kcal/Kg. By using high standard hygiene and good management, the happening of dangerous diseases was largely avoided and rabbits have never been treated with any kind of systematic vaccination.
Molecular genetic analysis
Blood collection
Approximately 2 ml of blood sample was collected from central artery vein of the ear under vacuum in centrifuge tubes containing EDTA as anticoagulant for molecular genetic analysis, from each individual of Alexandria (Alex), V-line (V), New Zealand white (NZW) and California (Cal) rabbits. All rabbits used were normal, healthy and sexually fertile.
DNA extraction
DNA was extracted from whole blood following the instruction of the Fermentas Company. The quantity and quality of the isolated DNA was determined by spectrophotometer (at 260 nm to that of 280 nm) and agarose gel electrophoresis.
RAPD-PCR analysis
To resultant RAPD profiles from rabbit DNA, 10 different decamer oligonucleotide RAPD markers from the Operon Technologies were used for genotyping of rabbits in this study (Table 1). Equal amounts of DNA of the individual samples among lines were drawn and mixed together to get a mixed DNA sample. PCR reaction mixture contained 1.5 μl 10X enzyme buffer containing MgCl2, 75 ng genomic DNA, 0.2 μl Taq DNA polymerase (2 units per μl), 2 μl dNTPs (2 mM), 0.5 μl primer (10 pmol) and sdH2O was added to the mix to reach a total volume of 15.0 μl. Amplification of DNA fragments was carried out in a Biometra T Gradient thermal cycler (Rudolf-Wissell-StraBe, Goettingen, Germany). PCR program included three steps. Step 1, was an initial denaturation step at 95°C for 10 minutes. Step 2, was running 35 cycles, each starting with denaturation at 96°C for 30 seconds followed by annealing at 35°C for 30 seconds and lasted by extension at 72°C for 45 seconds. Step 3, was the final extension at 72°C for 5 minutes. Amplification results were separated on 1.5% agarose gel, stained with Ethidium Bromide and visualized under U.V. light [3].
Table 1. List of 10 RAPD primers and their sequences
| N | Primer code | Nucleotide sequence (5'-3') |
|---|---|---|
| 1 | OPA1 | CAGGCCCTTC |
| 2 | OPA7 | GAAACGGGTG |
| 3 | OPA8 | GTGACGTAGG |
| 4 | OPA10 | GTGATCGCAG |
| 5 | OPA12 | TCGGCGATAG |
| 6 | OPA15 | TTCCGAACCC |
| 7 | OPA16 | AGCCAGCGAA |
| 8 | OPA18 | AGGTGACCGT |
| 9 | OPA19 | CAAACGTCGG |
| 10 | OPA20 | GTTGCGATCC |
Scoring and analysis of RAPD patterns
The resolved DNA bands were documented and processed for data analysis; The clear, unambiguous and reproducible band represent across the DNA samples were scored as (1) and absence of bands were recorded as (0) in the RAPD profiles of different genotypes of rabbits.
Genetic similarity and Dendrogram
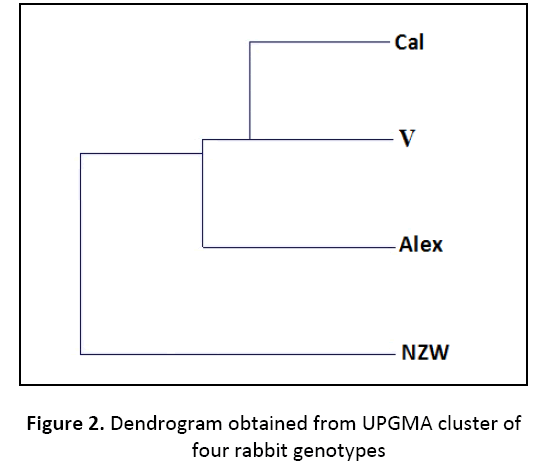
The indexes of similarity were calculated across all possible pair wise comparisons of individuals among lines following the method of Nei and Hi (1979). The similarity matrix was subjected to cluster analysis by un-weighted pair group method for arithmetic mean (UPGMA) cluster analysis algorithm and a dendrogram was generated. The dendrogram was drawn on the basis of shared bands according to nearest neighbor analysis and the generated data were used for calculation of similarity matrix for all primers according to Jaccard`s coefficients [4].
Results and Discussion
Assessment of genetic variation among rabbit genotypes will help in rabbit breeding program improvement. Molecular markers were used in the present study to obtain fingerprints for four different rabbit genotypes.
Genetic similarity among rabbit genotypes
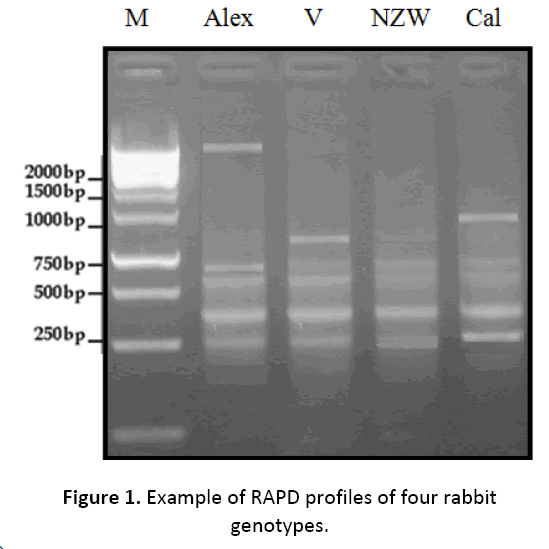
In the present study, genetic variations were detected in four different rabbit genotypes namely Alexandria, V-line, New Zealand white and California using random amplified polymorphic DNA (RAPD-PCR) analysis (Figure 1). Five out of ten RAPD markers (OPA8, OPA10, OPA12, OPA16, OPA18) were employed to assess the genetic variations and phylogenetic relationships among these lines. A total of 198 DNA fragments were detected. The polymorphism percentage based on overall RAPD primers was 41.03% among these genotypes, which presents a kind of genetic diversity. Twenty one bands were polymorphic; however, sixty two bands were monomorphic for all genotypes. From the phylogenetic tree, the genotypes Alexandria and V-line appeared to be closely related, and also the genotypes Vline and California (Table 2). The UPGMA dendrogram, based on Nei’s genetic distance, depicts the relationship among the investigated rabbit genotypes (Figure 2). The results of genetic similarity among the four rabbit genotypes can contribute significantly to the development of genetic improvement programs in rabbits under Egyptian environment conditions.
Table 2. Genetic similarity estimated among four rabbit genotypes
| Alex | V | NZW | Cal | |
|---|---|---|---|---|
| Alex | 1 | 0.4779 | 0.1343 | 0.1012 |
| V | 0.4779 | 1 | 0.1807 | 0.6814 |
| NZW | 0.1343 | 0.1807 | 1 | 0.1300 |
| Cal | 0.1012 | 0.6814 | 0.1300 | 1 |
Conclusion
The present study showed that RAPD analysis is effective method for generating polymorphic DNA markers in Alexandria, V-line, New Zealand white and California rabbits. These polymorphic markers are useful for estimating genetic distances and relationships among these lines. Also, these results represent reliable tools which may have a great impact in rabbit breeding programs and genetic improvement of rabbits.
Acknowledgements
The authors would like to extend our gratitude to the Department of Poultry, Faculty of Agriculture, Alexandria University.
References
- Bardakci, F., 2001. Random Amplified Polymorphic DNA (RAPD) Markers. Turkish Journal of Biology, 25: 185-196.
- El-Raffa, A.M., 2005. Genetic analysis for productive and reproductive traits of V line rabbits raised under Egyptian conditions. Egyptian Journal of Poultry Science. Vol. 25(IV): 1217-1231.
- El-Sabrout, K.; El-Seedy, A.; Shebl, M.K.; Soliman, F.N.K. and Azza, El-Sebai (2014). Molecular markers and productive performance relations for line V and Alexandria rabbits under Egyptian environmental conditions. Int. J. Life Sc.Bt & Pharm. Res., Vol. 3, (1): 345-361.
- Jaccard, P., 1908. Nouvelles recherches sur la distribution florale. Bull. Soc. Vaudoise Sci. Nat. 44:223-270.
- Nei, M. and W.H., Li, 1979. Mathematical model for studying genetic variation in terms of restriction endonuclease. Proceeding of national academy of science U.S.A., 7: 5269-5273.
- Nikkhoo, M., S., Hadi, R., Ghodrat, N., Mozhdeh, F., Farnaz and K., Minoo, 2011. Measurement of genetic parameters within and between breeder flocks of Arian broiler lines using randomly amplified polymorphic DNA (RAPD) markers. African journal of Biotechnology vol. 10 (36) pp. 6830-6837.
- Sharma, D.; Appa-Rao, K.B.; Singh, R.V. and Totey, S.M., 2001. Genetic diversity among chicken breeds estimated through randomly amplified polymorphic DNA. Anim. Biotechnol., 12: 111-120.
Open Access Journals
- Aquaculture & Veterinary Science
- Chemistry & Chemical Sciences
- Clinical Sciences
- Engineering
- General Science
- Genetics & Molecular Biology
- Health Care & Nursing
- Immunology & Microbiology
- Materials Science
- Mathematics & Physics
- Medical Sciences
- Neurology & Psychiatry
- Oncology & Cancer Science
- Pharmaceutical Sciences


