Liver Changes Due To Chronic Fructose Intake Might Be Attenuated With A Return To The Control Diet
1Programa de Doctorado en Ciencias Morfologicas, Facultad de Medicina, Universidad de La Frontera, Temuco, Chile
2Universidad Católica, Facultad de Ciencias de Salud, Temuco, Chile
3Universidad Mayor, Temuco, Chile
4Laboratory of Morphometry, Metabolism and Cardiovascular Diseases, Biomedical Center, Institute of Biology, The University of the State of Rio de Janeiro, Rio de Janeiro, Brazil
5Center of Excellence in Morphological and Surgical Studies (CEMyQ), Universidad de La Frontera, Temuco, Chile
- *Corresponding Author:
- Mariano del Sol
Programa de Doctorado en Ciencias Morfológicas
Center of Excellence in Morphological and Surgical Studies (CEMyQ), Universidad de La Frontera
Temuco, Chile
Tel: (56) 452325571
E-mail: mariano.delsol@ufrontera.cl
Received date: 17 January, 2019; Accepted date: 27 February, 2019; Published date: 08 March, 2019
Citation: Carvallo P, Carvallo C, Barbosa-da-Silva S, Mandarim-de-Lacerda CA, del Sol M (2019) Mean HbA1c comparison among diabetic subgroups treated with oral agents alone, insulin alone and combination of both. Endocrinol Metab Vol.3.No.1:114.
Copyright: © 2019 Carvallo P, et al. This is an open-access article distributed under the terms of the Creative Commons Attribution License, which permits unrestricted use, distribution, and reproduction in any medium, provided the original author and source are credited.
Abstract
Aims: Nowadays, there has been much concern about the role of dietary fructose in the development of metabolic diseases. This study aimed to evaluate if, the effects of fructose intake in the mouse liver are reversible when the consumption is suspended.
Methods: C57/BL6 mice were fed for 16 weeks with the diets: control diet (C group, standard chow for 16 weeks); high-fructose diet of 25% (F25 group); high-fructose diet of 50% (F50 group); F25 for 8 weeks plus control diet for an additional 8 weeks (F25+C group); F50 for 8 weeks plus control diet for an additional 8 weeks (F50+C group).
Results: The glucose intolerance observed in both groups F25 and F50, was reduced after returning to the control diet. In general, after a period of consuming fructose at all the concentrations studied, we measured raised levels of leptin, resistin, IL-6, plasmatic lipids, alanine aminotransferase, and aspartate aminotransferase. However, these levels diminished when the animals switched to the control diet. Also, the increased liver steatosis because of fructose could be controlled after returning to the control diet.
Conclusion: The consumption of fructose at different concentrations is linked to metabolic impairment, like glucose intolerance and decreased insulin sensitivity, and augmented proinflammatory cytokines, which continues after the return to the control diet.
Introduction
Fructose is a pure sugar present in fruit and honey, a significant component of the sucrose (a disaccharide of fructose and glucose), and high-fructose corn syrup (a mix of fructose and glucose), is used for sweet processed products such as juices, cookies, and soft drinks, causing adverse metabolic effects, including nonalcoholic fatty liver disease (NAFLD) [1]. In the liver, the excess of fructose will be converted to fat, preferably metabolized into lipids [2], stimulating de novo lipogenesis, and blocks liver beta-fatty acid oxidation [2], thus triggering insulin resistance (IR) and glucose intolerance [3,4].
NAFLD is a common liver disorder characterized by ectopic fat accumulation in hepatocytes considered a hepatic manifestation of metabolic syndrome estimated to affect one billion individuals worldwide [5]. The significant risk factor for the development of NAFLD is a high caloric intake derived from overconsumption of food and increased consumption of fructose-containing foods and beverages [6]. Importantly, the evolution of NAFLD progress to nonalcoholic steatohepatitis (NASH) [7], cirrhosis and hepatocarcinoma [8].
There is no specific pharmacological treatment for NAFLD, but some nutrients have beneficial effects, like omega-3 fatty acids, that showed protection against NAFLD [9]. The Western diet model was partially protected from developing NAFLD when the diet was supplemented with combined omega-3 fatty acids and flavanols [10]. Also, there is evidence that flavanols, epicatechin, vitamin C and other antioxidants may also protect against fructose-induced metabolic syndrome [11,12]. Vitamin E also had significant preventive and therapeutic effects on NAFLD, improved lipotoxicityinduced hepatic steatosis by suppressing hepatic lipid accumulation and peroxidation [13,14]. It is relevant to consider that the intake of natural fruits containing fructose is not associated with NAFLD [1].
A question still open is the liver's ability to reverse the lesions caused by fructose, when there is a discontinuation of fructose intake. So, the current study attempted to investigate the effect of two different quantities fructose, to compare the hepatic structure lesion and the possible reversion after returning to the control diet.
Materials and Methods
Animal and diet
All the procedures were made according to conventional standards for animal experimentation (National Institutes of Health no. 85-23, revised 1996). The protocol of animal care was approved for the Scientific Ethics Committee of La Frontera University (Protocol Nº 034/16).
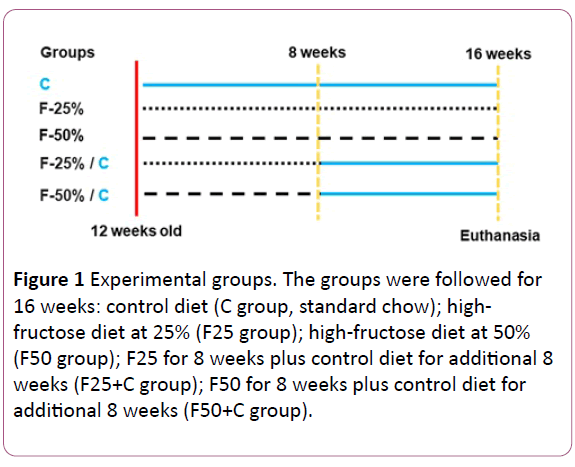
Eight C57BL/6 male mice of four months of age were housed at 20-23ºC temperature, and controlled humidity, with 12h light: dark cycle and had free access to food and water, which were monitored daily. The animals were fed for 16 weeks as follows: control diet (C group, standard chow for 16 weeks); highfructose diet at 25% (F25 group); high-fructose diet at 50% (F50 group); F25 for 8 weeks plus control diet for additional 8 weeks (F25+C group); F50 for 8 weeks plus control diet for additional 8 weeks (F50+C group) (see the experiment timeline in (Figure 1). The diets were elaborated with purified nutrients by PragSolucoes (Jau, SP, Brazil) based on the American Institute of Nutrition's recommendations (AIN 93 M) (Table 1) [15].
| Nutrient (g/kg) | Groups | ||
|---|---|---|---|
| C | F25 | F50 | |
| Casein | 140 | 140 | 140 |
| Corn starch | 620.7 | 383.5 | 146 |
| Sucrose | 100 | 100 | 100 |
| Fructose | --- | 237.15 | 474.7 |
| Soybean oil | 40 | 40 | 40 |
| Fiber | 50 | 50 | 50 |
| Vitamin mix | 10 | 10 | 10 |
| Mineral mix | 35 | 35 | 35 |
| L-cystein | 1.8 | 1.8 | 1.8 |
| Choline | 2.5 | 2.5 | 2.5 |
| Antioxidant | 0.008 | 0.008 | 0.008 |
| Total | 1000 | 1000 | 1000 |
| Energy (kJ/kg) | 15.9 | 15.9 | 15.9 |
| Carbohydrate (% kcal/g) | 76 | 76 | 76 |
| Fructose (% kcal/g) | 0 | 25 | 50 |
| Protein (% kcal/g) | 14 | 14 | 14 |
| Lipid (% kcal/g) | 10 | 10 | 10 |
Table 1 Composition of the diets in the groups control (C), fructose 25% (F25), and fructose 50% (F50). Protein, mineral and vitamin mixtures followed the AIN93 recommendations.
Figure 1: Experimental groups. The groups were followed for 16 weeks: control diet (C group, standard chow); highfructose diet at 25% (F25 group); high-fructose diet at 50% (F50 group); F25 for 8 weeks plus control diet for additional 8 weeks (F25+C group); F50 for 8 weeks plus control diet for additional 8 weeks (F50+C group).
Body mass and food intake
Body mass (BM) was measured weekly, and food intake was monitored daily (the difference between the food supplied and the amount of food left in the cage). The pellets were renewed daily, and the remaining chow was discarded.
Oral glucose tolerance test - OGTT
OGTT was completed at the end of the experiment using a 25% glucose solution (1.0 g/kg) administered by orogastric gavage after a 6-h fasting period to induce glucose overload, and then blood was sampled from the tail vein at 0, 15, 30, 60 and 120 min (glucometer Accu-Chek, Roche, Mannheim, Germany). We determine the area under the curve (AUC) with the trapezoid rule to assess the glucose tolerance [16] (Prism version 7.05 for Windows, GraphPad Software, La Jolla, CA, USA).
Sacrifice and tissue extraction
In the 16th week, the animals were fasted (6-h) and then anesthetized (intraperitoneal sodium pentobarbital, 150 mg/kg). Blood samples were obtained via cardiac puncture and plasma was separated by centrifugation (1200 g/15 min at room temperature). The liver was dissected, weighed and fragments from all lobes were collected and fixed for 48h in recently made fixative (formaldehyde 4% w/v, 0.1 M phosphate buffer, pH 7.2).
Liver
The fragments were embedded in Paraplast Plus (Sigma- Aldrich, St. Louis, MO, USA), sectioned at 5 μm thick, and stained with hematoxylin and eosin. Digital images were taken with a DM750 microscope and ICC50 HD camera (Leica, Wetzlar, Germany). The volume density of steatosis in the liver (Vv [steatosis, liver]) was assessed by point counting in at least ten random fields per animal, as previously described [17]. Briefly, a frame with 36 test points was superimposed on digital microscopic images of the liver using the StePanizer web-based utility [18]. The Vv [steatosis, liver] was obtained as the ratio between the points hitting the fat drops (Pp [steatosis, liver]) and the total points of the system (PT): Vv [steatosis, liver] = Pp [steatosis, liver] / PT [19]. It is important to say that this method was validated for the pathological quantification of hepatic steatosis [20].
Plasma analyses
The total cholesterol (TC), triacylglycerol (TG), alanine aminotransferase (ALT), and aspartate aminotransferase (AST) were measured (spectrophotometer HumaLyzer 3000, Wiesbaden, Germany with commercial kits).
Also, insulin, leptin, resistin, and interleukin (IL) -6 were measured with appropriate ELISA kits (insulin kit EMINS, leptin kit KMC2281, Resistin kit EMRETN, IL-6 kit KMC0061, Thermo Fisher, IL, USA) using the microplate reader (Rayto RT-20100C, Shenzhen, China).
Quantitative insulin sensitivity check index – QUICKI
Insulin sensitivity was evaluated with QUICKI after measuring the fasting glycemia and fasting insulin. QUICKI=1/(log (fasting insulin μ U/mL) + log (fasting glycemia mg/dL)) [21].
Statistical analysis
The differences among groups were analyzed using one-way ANOVA and the Holm-Sidak post-hoc test. We accepted the Pvalue< 0.05 as significant (GraphPad Prism version 7.05 for Windows; GraphPad Software, San Diego, CA, USA).
Results
Body mass
The animals started the study without significant difference in their BM. In the end, the animals showed no significant increase in body mass throughout the experiment (Table 2).
| Data | C | F25 | F50 | F25+C | F50+C |
|---|---|---|---|---|---|
| Body mass (g) | 33.8 ± 1.3 | 32.9 ± 1.2 | 31.3 ± 0.6 | 33.8 ± 1.7 | 32.9 ± 1.4 |
| Liver mass/tibia length (g/cm) | 0.057 ± 0.001 | 0.06 ± 0.004 | 0.006 ± 0.005† | 0.056 ± 0.002 | 0.055 ± 0.001§ |
Table 2 Body mass and liver mass.Mean ± S.D., n = 5 /group (one-way ANOVA and the post-hoc test of Holm-Sidak). P<0.05 when: † compared to the control group, § compared FRU 50%
Table 2 Body mass and liver mass. Mean ± S.D., n = 5 /group (one-way ANOVA and the post-hoc test of Holm-Sidak).
The fructose-rich diet might change in glucose tolerance and insulin sensitivity
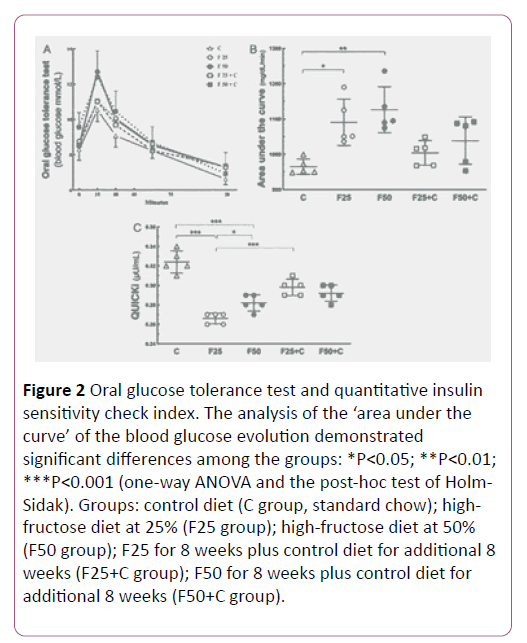
The study performed the OGTT test to evaluate the capacity of the clearance of the glucose overload. The groups F25 and F50 showed glucose intolerance compared to the control group (P=0.02). Also, the F25 group showed glucose intolerance compared to the F25+C group (P=0.04), but no significant difference existed comparing the groups F50+C and F50 (Figure 2).
Figure 2: Oral glucose tolerance test and quantitative insulin sensitivity check index. The analysis of the ‘area under the curve’ of the blood glucose evolution demonstrated significant differences among the groups: *P<0.05; **P<0.01; ***P<0.001 (one-way ANOVA and the post-hoc test of Holm- Sidak). Groups: control diet (C group, standard chow); highfructose diet at 25% (F25 group); high-fructose diet at 50% (F50 group); F25 for 8 weeks plus control diet for additional 8 weeks (F25+C group); F50 for 8 weeks plus control diet for additional 8 weeks (F50+C group).
QUICKI is an empirically-derived mathematical transformation of fasting blood glucose and plasma insulin concentrations that provide a consistent result of the insulin sensitivity index. Our result demonstrated higher QUICKI in F25+C compared to the F25 group (P<0.0001), but not in the comparison between the groups F50+C and F50 (Figure 2).
The fructose-rich diet enhanced plasmatic total cholesterol and triacylglycerol
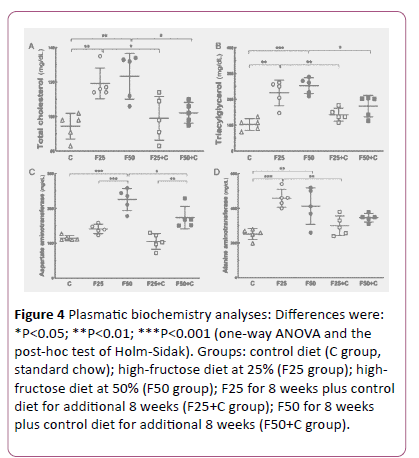
The plasma lipids were altered with excessive intake of fructose. High TC levels were found in both groups F25 (+26%, P=0.009) and F50 (+31%, P=0.002), in comparison with the C group, but after switching to the control diet these groups showed a significant TC reduction: F25 vs. F25+C (-20%, P=0.03), F50 vs. F50+C (-20%, P=0.01) (Figures 3 and 4).
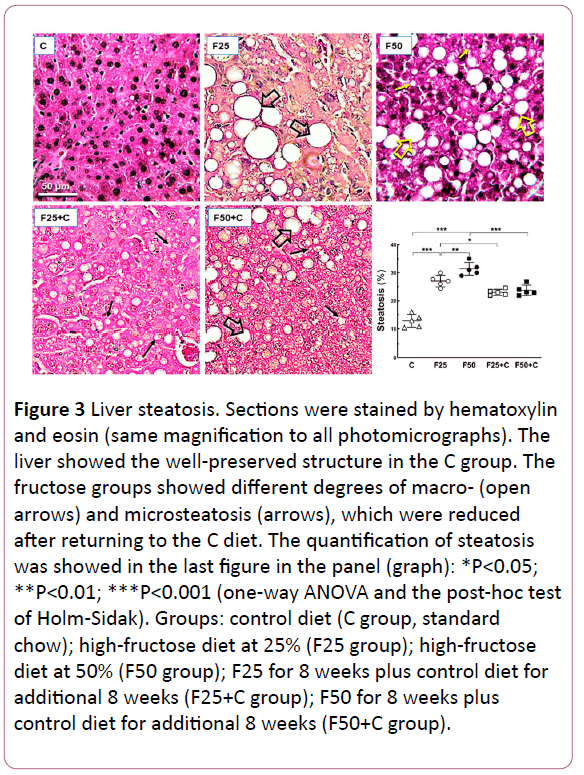
Figure 3: Liver steatosis. Sections were stained by hematoxylin and eosin (same magnification to all photomicrographs). The liver showed the well-preserved structure in the C group. The fructose groups showed different degrees of macro- (open arrows) and microsteatosis (arrows), which were reduced after returning to the C diet. The quantification of steatosis was showed in the last figure in the panel (graph): *P<0.05; **P<0.01; ***P<0.001 (one-way ANOVA and the post-hoc test of Holm-Sidak). Groups: control diet (C group, standard chow); high-fructose diet at 25% (F25 group); high-fructose diet at 50% (F50 group); F25 for 8 weeks plus control diet for additional 8 weeks (F25+C group); F50 for 8 weeks plus control diet for additional 8 weeks (F50+C group).
Figure 4: Plasmatic biochemistry analyses: Differences were: *P<0.05; **P<0.01; ***P<0.001 (one-way ANOVA and the post-hoc test of Holm-Sidak). Groups: control diet (C group, standard chow); high-fructose diet at 25% (F25 group); highfructose diet at 50% (F50 group); F25 for 8 weeks plus control diet for additional 8 weeks (F25+C group); F50 for 8 weeks plus control diet for additional 8 weeks (F50+C group).
Also, high TAG levels were seen in both groups F25 (+118%, P= 0.0002) and F50 (+145%, P<0.0001) compared to the C group. Likewise, the switch to the control diet reduced the TAG levels in these groups: F25 vs. F25+C (-60%, P= 0.01), F50 vs. F50+C (-30%, P=0.02) (Figure 4).
Aspartate aminotransferase and alanine aminotransferase decrease when fructose intake ceased
Liver enzymes are usually indicators of liver condition to diagnose and monitor liver diseases. AST level was higher in the F50 group than in the C group (+ 96.8%, P<0.0001), and lower after the switch to the control diet: F50 vs. F50+C (-23%, P=0.002) (Figure 4).
ALT level was higher in both groups F25 (+82%, P=0.0003) and F50 (+64%, P= 0.004) than in the C group. ALT decreased because the switch to the control diet in F25 vs. F25+C (-35%, P=0.005) (Figure 4).
The fructose-rich diet enhanced liver steatosis
The chronic intake of the fructose-rich diet was associated with liver steatosis, assessed by stereology: F25 vs. C (+106%, P<0.0001); F50 vs. C (+145%, P<0.0001); F50 vs. F25 (+18%, P= 0.02), and the return to the C diet reduced the steatosis in the liver: F25 vs. F25+C (-11%, P=0.04); F50 vs. F50+C (-24%, P=0.04). However, the steatosis in the F25+C and F50+C groups continued higher in comparison with the C group (+91%, both groups, P<0.0001) (Figure 3). Figure
The fructose-rich diet augmented adipokines
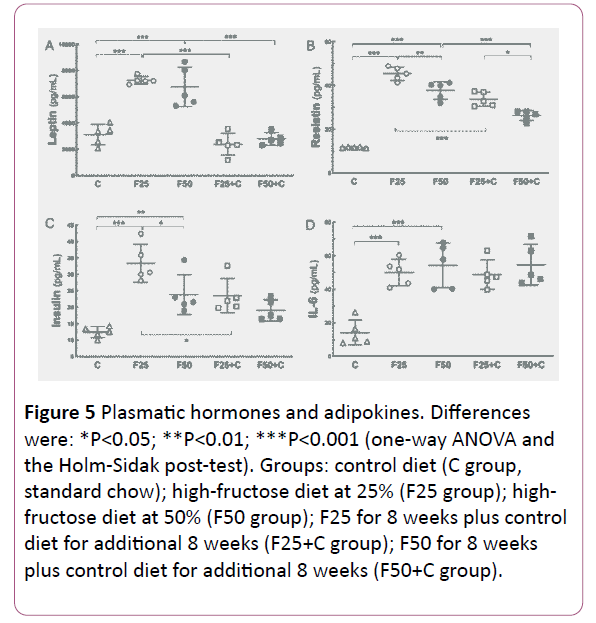
In general, adipokines increased because of fructose intake and diminished when the animals switched to the control diet (Figure 5).
Figure 5: Plasmatic hormones and adipokines. Differences were: *P<0.05; **P<0.01; ***P<0.001 (one-way ANOVA and the Holm-Sidak post-test). Groups: control diet (C group, standard chow); high-fructose diet at 25% (F25 group); highfructose diet at 50% (F50 group); F25 for 8 weeks plus control diet for additional 8 weeks (F25+C group); F50 for 8 weeks plus control diet for additional 8 weeks (F50+C group).
Leptin: Both fructose groups showed increased leptin levels compared to the C group (F25, +133%, P<0.0001; F50, +116%, P<0.0001). The leptin levels decreased when the groups switched to the C diet: F25 vs. F25+C (-67%, P<0.0001); F50 vs. F50+C (-58%, P<0.0001).
Resistin: The resistin levels were higher in the fructose groups compared to the C group (F25, +283%, P<0.0001; F50, +219%, P<0.0001). Also, resistin levels were decreased in the F groups when they returned to the C diet: F25 vs. F25+C (-25%, P=0.0001); F50 vs. F50+C (-30%, P=0.0001).
IL6: The F groups showed higher IL-6 levels compared to the C group (F25, +257%, P=0.0002; F50, +285%, P<0.0001). However, even after switching to the C diet IL6 remained high.
Discussion
We observed here that a high fructose consumption (both 25% and 50%) caused comparable adverse effects on metabolism and liver structure. The fructose led to hepatic steatosis, altered lipid metabolism, and glucose tolerance/insulin sensitivity. We already know that rodents fed a high-fructose diet showed reduced insulin sensitivity associated with impaired glucose tolerance [7,22]. In the current study, it was important to reveal that returning to a balanced control diet over a long period of fructose intake improved all parameters that were altered, except in cytokines and glucose tolerance in HF50+C, if not at the initial levels, at least significantly. The prolonged consumption of fructose alternated by periods of a balanced diet without fructose addition is a common situation in the population, and our results demonstrate that it is beneficial to change eating habits [23,24].
Regarding body mass, previous studies with a similar mice model and high-fructose intake have demonstrated an absence of body mass increase associated with the fructose if both control and high-fructose diets are isoenergetic [25]. However, the animals fed the high-fructose diet showed a compromised liver with deleterious changes associated with dyslipidemia, insulin resistance (IR), and NAFLD with areas of necroinflammation [22,25]. It is important to say that, contrary to what has been considered, the simultaneous consumption of medium chain fatty acids does not attenuate the liver damage caused by the use of a high fructose diet [26].
Fructose is associated with low-grade chronic inflammation since it activates proinflammatory nuclear factor kappa B (NFκB) and proinflammatory cytokines (tumor necrosis factor (TNF) α, IL-1β, and IL-6) [27,28]. Our results demonstrated that fructose intake in both concentrations might affect the levels of leptin, resistin, and IL-6. Even after switching to the control diet resistin and IL-6 remained high.
The high-fructose consumption leads to insulin resistance in rodents [22,29]. In the present study, consistent with the results of the insulin sensitivity index, the glucose tolerance in both fructose groups was severely impaired, and both did not reduce over a period of control diet in the group 50%. The rodents fed fructose for three weeks have the insulin receptor mRNA, and the numbers of insulin receptors on skeletal muscle significantly lower than those in animals supplied a control diet [30]. Also, current findings agree with the hyperinsulinemic state that may enhance the insulin resistance in peripheral tissues and organs, reducing the glucose uptake and lead to a considerable increase in glycemia [31].
There was hepatomegaly in the F50 group, possibly due to an excess of ectopic lipids from de novo lipogenesis as signaled previously [32]. Nowadays, some studies suggest that fructose consumption as a primary contributor to NAFLD is increasing and stimulating de novo lipogenesis [2,33] which may drive the accumulation of liver and visceral fat [34]. Also, both dietary fructose concentrations presented high TAG content and steatosis that already was reported before [35,36]. A metaanalysis, compiling the results of all published studies have evaluated the effects of dietary fructose, revealed that a fructose intake >50 g/day was associated with increased postprandial TAG excursions, while a fructose intake >100 g/day was linked with increased fasting TAG [37].
The key lipogenic enzymes in the liver might be enhanced because of fructose intake, like the factor for transcription SREBP-1c (the primary inducer of hepatic lipogenesis) [38], and the hepatic transcription factor carbohydrate-responsive element binding protein (ChREBP, which upregulates the expression of hepatic fatty acid synthase and acetyl-CoA carboxylase) [39].
More than altering plasma lipid profile, fructose might modulate intracellular lipid deposition ectopic in the liver. We found macro- and microvesicular steatosis in the animals fed a high-fructose diet, whereas, after a fructose interval restriction, the groups presented macrovesicular steatosis. This finding is significant because of the microvesicular steatosis is linked with hepatocyte ballooning, mitochondrial dysfunction, and more severe NAFLD phenotype [40], but switching to the control diet reduce steatosis significantly in both dietary fructose concentration groups. Also, AST and ALT (markers of hepatic injury and liver fibrosis) [41] were altered in our study due to fructose intake, suggesting a hepatocyte impairment in the cytoplasm and mitochondria, which was diminished after returning to the control diet. It is possible that the result is dependent on dietary fructose concentration. Thus, although returning to the control diet is beneficial to the liver, possibly it depends on the extension of time the control diet is offered.
Mitochondrial biogenesis is a critical pathway that is altered because of fructose intake, involving the factors PGC-1α (Peroxisome proliferator-activated receptor gamma coactivator 1-alpha), NRF-1 (Nuclear respiratory factor 1) and TFAM (Transcription factor A, mitochondrial). PGC1α is one of the essential co-activators of mitochondrial biogenesis [42], contributing to fatty acid transport and utilization [43]. The results are still controversial regarding the high-fructose intake and mitochondrial biogenesis. An increase of hepatic mitochondrial biogenesis [26] and skeletal muscle mitochondrial biogenesis were reported [44]. However, another report demonstrated and impaired mitochondrial biogenesis, including reduced hepatic expression of PGC1 alpha and NRF1 in fructosefed rats [45]. Therefore, a significant future step that we can propose for the continuation of the present study would investigate the pathways of lipogenesis, beta-oxidation, and mitochondrial biogenesis in our animals.
Conclusion
The chronic intake of a fructose-rich diet in the mouse model was associated with liver structural changes compatible with the human NAFLD accompanied by glucose intolerance, diminished insulin sensitivity, and enhancement of proinflammatory cytokines, suggestively linked with the fructose concentration ingested. The return to the normal-fructose control diet, after a period ingesting the high-fructose diet, ameliorated the alterations observed and could be more efficient in the long term.
Acknowledgments
This research has received funding from CNPq (Conselho Nacional de Desenvolvimento Científico e Tecnológico, Brazil, grant number 302.920/2016-1) and FAPERJ (Fundação Carlos Chagas Filho do Amparo à Pesquisa do Rio de Janeiro, grant numbers E-26/202.935/2017). The association UERJ/University de la Frontera (UFRO) is funded by FAPERJ (grant number E-26/010.003.093/2014).
References
- Jensen T, Abdelmalek MF, Sullivan S, Nadeau KJ, Green M, et al. (2018) Fructose and sugar: A major mediator of non-alcoholic fatty liver disease. J Hepatol 68: 1063-1075.
- Softic S, Cohen DE, Kahn CR (2016) Role of Dietary Fructose and Hepatic De Novo Lipogenesis in Fatty Liver Disease. Dig Dis Sci 61: 1282-1293.
- Yang ZH, Miyahara H, Takeo J, Katayama M (2012) Diet high in fat and sucrose induces rapid onset of obesity-related metabolic syndrome partly through rapid response of genes involved in lipogenesis, insulin signalling and inflammation in mice. Diabetol Metab Syndr 4: 32.
- Barbosa-da-Silva S, da Silva NC, Aguila MB, Mandarim-de-Lacerda CA. Liver damage is not reversed during the lean period in diet-induced weight cycling in mice. Hepatol Res 2014; 44:450-9.
- Loomba R, Sanyal AJ (2013) The global NAFLD epidemic. Nat Rev Gastroenterol Hepatol 10: 686-690.
- Softic S, Gupta MK, Wang GX, Fujisaka S, O'Neill BT, et al. (2017) Divergent effects of glucose and fructose on hepatic lipogenesis and insulin signaling. J Clin Invest 127: 4059-4074.
- Schultz A, Barbosa-da-Silva S, Aguila MB, Mandarim-de-Lacerda CA (2015) Differences and similarities in hepatic lipogenesis, gluconeogenesis and oxidative imbalance in mice fed diets rich in fructose or sucrose. Food Funct 6: 1684-1691.
- Lytle KA, Jump DB (2016) Is Western Diet-Induced Nonalcoholic Steatohepatitis in Ldlr-/- Mice Reversible? PLoS One 11: e0146942.
- Simopoulos AP (2013) Dietary omega-3 fatty acid deficiency and high fructose intake in the development of metabolic syndrome, brain metabolic abnormalities, and non-alcoholic fatty liver disease. Nutrients 5: 2901-2923.
- Vauzour D, Rodriguez-Ramiro I, Rushbrook S, Ipharraguerre IR, Bevan D, et al. (2018) n-3 Fatty acids combined with flavan-3-ols prevent steatosis and liver injury in a murine model of NAFLD. Biochim Biophys Acta Mol Basis Dis 1864: 69-78.
- Vasdev S, Gill V, Parai S, Longerich L, Gadag V (2002) Dietary vitamin E and C supplementation prevents fructose induced hypertension in rats. Mol Cell Biochem 241: 107-114.
- Hu QH, Zhang X, Pan Y, Li YC, Kong LD (2012) Allopurinol, quercetin and rutin ameliorate renal NLRP3 inflammasome activation and lipid accumulation in fructose-fed rats. Biochem Pharmacol 84: 113-1125.
- Nan YM, Wu WJ, Fu N, Liang BL, Wang RQ, et al. (2009) Antioxidants vitamin E and 1-aminobenzotriazole prevent experimental non-alcoholic steatohepatitis in mice. Scand J Gastroenterol 44: 1121-1131.
- Nagashimada M, Ota T (2018) Role of vitamin E in nonalcoholic fatty liver disease. IUBMB Life.
- Reeves PG, Nielsen FH, Fahey GC (1993) AIN-93 purified diets for laboratory rodents: final report of the American Institute of Nutrition ad hoc writing committee on the reformulation of the AIN-76A rodent diet. J Nutr 123: 1939-1951.
- Tai MM (1994) A mathematical model for the determination of total area under glucose tolerance and other metabolic curves. Diabetes Care 17: 152-154.
- Aguila MB, Pinheiro Ada R, Parente LB, Mandarim-de-Lacerda CA (2003) Dietary effect of different high-fat diet on rat liver stereology. Liver Int 23: 363-370.
- Tschanz SA, Burri PH, Weibel ER (2011) A simple tool for stereological assessment of digital images: the STEPanizer. J Microsc 243: 47-59.
- Mandarim-de-Lacerda CA, Del Sol M (2017) Tips for studies with quantitative morphology (morphometry and stereology). Int J Morphol 35:1482-1494.
- Catta-Preta M, Mendonca LS, Fraulob-Aquino J, Aguila MB, Mandarim-de-Lacerda CA (2011) A critical analysis of three quantitative methods of assessment of hepatic steatosis in liver biopsies. Virchows Arch 459: 477-485.
- Katz A, Nambi SS, Mather K, Baron AD, Follmann DA, et al. (2000) Quantitative insulin sensitivity check index: a simple, accurate method for assessing insulin sensitivity in humans. J Clin Endocrinol Metab 85: 2402-2410.
- Karise I, Ornellas F, Barbosa-da-Silva S, Matsuura C, Del Sol M, et al. (2017) Liver and Metformin: Lessons of a fructose diet in mice. Biochim Open 4: 19-30.
- Della Corte KW, Perrar I, Penczynski KJ, Schwingshackl L, Herder C (2018) Effect of Dietary Sugar Intake on Biomarkers of Subclinical Inflammation: A Systematic Review and Meta-Analysis of Intervention Studies. Nutrients 10: E606.
- Schwingshackl L, Bogensberger B, Hoffmann G (2018) Diet Quality as Assessed by the Healthy Eating Index, Alternate Healthy Eating Index, Dietary Approaches to Stop Hypertension Score, and Health Outcomes: An Updated Systematic Review and Meta-Analysis of Cohort Studies. J Acad Nutr Diet 118: 74-100 e111.
- Schultz A, Neil D, Aguila MB, Mandarim-de-Lacerda CA (2013) Hepatic adverse effects of fructose consumption independent of overweight/obesity. Int J Mol Sci 14: 21873-21886.
- Guimaraes J, Bargut TCL, Mandarim-de-Lacerda CA, Aguila MB (2019) Medium-chain triglyceride reinforce the hepatic damage caused by fructose intake in mice. Prostaglandins Leukot Essent Fatty Acids 140: 64-71.
- Dandona P, Aljada A, Bandyopadhyay A (2004) Inflammation: the link between insulin resistance, obesity and diabetes. Trends Immunol 25: 4-7.
- Velickovic N, Teofilovic A, Ilic D, Djordjevic A, Vojnovic Milutinovic D, et al. (2018) Modulation of hepatic inflammation and energy-sensing pathways in the rat liver by high-fructose diet and chronic stress. Eur J Nutr 2018.
- Balakumar M, Raji L, Prabhu D, Sathishkumar C, Prabu P, et al. (2016) High-fructose diet is as detrimental as high-fat diet in the induction of insulin resistance and diabetes mediated by hepatic/pancreatic endoplasmic reticulum (ER) stress. Mol Cell Biochem 423: 93-104.
- Catena C, Cavarape A, Novello M, Giacchetti G, Sechi LA (2003) Insulin receptors and renal sodium handling in hypertensive fructose-fed rats. Kidney Int 64: 2163-2171.
- Rutledge AC, Adeli K (2007) Fructose and the metabolic syndrome: pathophysiology and molecular mechanisms. Nutr Rev 65: S13-23.
- Crescenzo R, Bianco F, Falcone I, Coppola P, Liverini G, et al. (2013) Increased hepatic de novo lipogenesis and mitochondrial efficiency in a model of obesity induced by diets rich in fructose. Eur J Nutr 52:537-545.
- Hudgins LC, Parker TS, Levine DM, Hellerstein MK (2011) A dual sugar challenge test for lipogenic sensitivity to dietary fructose. J Clin Endocrinol Metab 96: 861-868.
- Jacome-Sosa MM, Parks EJ (2014) Fatty acid sources and their fluxes as they contribute to plasma triglyceride concentrations and fatty liver in humans. Curr Opin Lipidol 25: 213-220.
- Huang D, Dhawan T, Young S, Yong WH, Boros LG, et al. (2011) Fructose impairs glucose-induced hepatic triglyceride synthesis. Lipids Health Dis 10: 20.
- Mastrocola R, Collino M, Rogazzo M, Medana C, Nigro D, et al. (2013) Advanced glycation end products promote hepatosteatosis by interfering with SCAP-SREBP pathway in fructose-drinking mice. Am J Physiol Gastrointest Liver Physiol 305: G398-407.
- Livesey G, Taylor R (2008) Fructose consumption and consequences for glycation, plasma triacylglycerol, and body weight: meta-analyses and meta-regression models of intervention studies. Am J Clin Nutr 88: 1419-1437.
- Shimomura I, Bashmakov Y, Horton JD (1999) Increased levels of nuclear SREBP-1c associated with fatty livers in two mouse models of diabetes mellitus. J Biol Chem 274: 30028-30032.
- Denechaud PD, Dentin R, Girard J, Postic C (2008) Role of ChREBP in hepatic steatosis and insulin resistance. FEBS Lett 582: 68-73.
- Tandra S, Yeh MM, Brunt EM, Vuppalanchi R, Cummings OW, et al. Presence and significance of microvesicular steatosis in nonalcoholic fatty liver disease. J Hepatol 55: 654-659.
- McGill MR (2016) The past and present of serum aminotransferases and the future of liver injury biomarkers. EXCLI J 15: 817-828.
- Scarpulla RC (2011) Metabolic control of mitochondrial biogenesis through the PGC-1 family regulatory network. Biochim Biophys Acta 1813: 1269-1278.
- Lin J, Handschin C, Spiegelman BM (2005) Metabolic control through the PGC-1 family of transcription coactivators. Cell Metab 1: 361-370.
- Crescenzo R, Bianco F, Coppola P, Mazzoli A, Cigliano L, et al. (2013) Increased skeletal muscle mitochondrial efficiency in rats with fructose-induced alteration in glucose tolerance. Br J Nutr 110: 1996-2003.
- Cioffi F, Senese R, Lasala P, Ziello A, Mazzoli A, et al. Fructose-Rich Diet Affects Mitochondrial DNA Damage and Repair in Rats. Nutrients 2017; 9: 4.
Open Access Journals
- Aquaculture & Veterinary Science
- Chemistry & Chemical Sciences
- Clinical Sciences
- Engineering
- General Science
- Genetics & Molecular Biology
- Health Care & Nursing
- Immunology & Microbiology
- Materials Science
- Mathematics & Physics
- Medical Sciences
- Neurology & Psychiatry
- Oncology & Cancer Science
- Pharmaceutical Sciences
