ISSN : 2349-3917
American Journal of Computer Science and Information Technology
Comparison of Dose Statistics of IMRT Plan from Varian Eclipse Treatment Planning System with Novel Python-Based Indigenously Developed Software
Ebenezar Jeyasingh1*, Sougoumarane Dashnamoorthy2, Karthick Rajamanickam, Kathiresan Nachimuthu, Imtiaz Ahmed3, Sachin Kotur4
1Department of Physics, Affiliated to Bharathidasan University, Tiruchirappalli, India
2Department of Physics, Thangam Cancer Research Institute, Tamilnadu, India
3Department of Physics, KLES Belgaum Cancer Research Institute, Karnataka, India
4Department of Physics, HCG MHIO Cancer Centre, Karnataka, India
- *Corresponding Author:
- Ebenezar Jeyasingh
Department of Physics,
Affiliated to Bharathidasan University, Tiruchirappalli,
India,
Tel: 8951768508;
E-mail: dsougoumarane1969@gmail.com
Received date: April 22, 2022, Manuscript No. IPACSIT-22-13285; Editor assigned date: April 25, 2022, PreQC No. IPACSIT-22-13285 (PQ); Reviewed date: May 09, 2022, QC No. IPACSIT-22-13285; Revised date: June 22, 2022, Manuscript No. IPACSIT-22-13285 (R); Published date: June 30, 2022, DOI: 10.36648/2349-3917.10.9.001
Citation: Jeyasingh E, Dashnamoorthy S, Rajamanickam K, Nachimuthu K, Ahmed I, et al. (2022) Comparison of Dose Statistics of IMRT Plan from Varian Eclipse Treatment Planning System with Novel Python-Based Indigenously Developed Software. Am J Compt Sci Inform Technol Vol:10 No:9
Abstract
Radiotherapy treatment plan evaluation relies on the implicit estimation of the tumor control probability and normal tissue complication probability arising from a given dose distribution. This pilot study is to reconstruct the Dose Volume Histogram (DVH) graph from the text file generated from the varian medical system developed eclipse treatment planning system to check the integrity and accuracy of the dose statistic. This study is to verify and compare the dose statistic of the intensity modulated radiotherapy of the head and neck from the eclipse software and the indigenously developed software. The dose statistic data obtained from the python software are consistent and deviations are within acceptable limits from the dose statistic of the eclipse treatment planning system. The in-house software also displays the hotness and coldness of the treatment plan and is capable of storing the dose statistic data generated from the software to the oracle database.
Keywords
Dose Volume Histogram (DVH); Tumor Control Probability (TCP); Normal Tissue Complication Probability (NTCP); Python; MATLAB; Treatment Planning System (TPS)
Introduction
The study of radiobiological effects in the field of radiation oncology is inevitable because of the side effects and late reaction after radiation treatment of 3-Dimentional Radiotherapy (3D-RT), Intensity Modulated Radiotherapy (IMRT), and rapid arc. at present, the linear accelerator vendors like Varian (US), Elekta (SE), Accuray (US), Philips (NL), GE Healthcare (UK), Toshiba (JP), Mitsubishi Heavy Industries (JP), Shinva (CN), Neusoft (CN), Top Grade Healthcare (CN), Huiheng Medical (CN) and Hamming (CN) have incorporated the biological modeling in the Treatment Planning System (TPS) to analyze the Tumor Control Probability (TCP) and Normal Tissue Complication Probability (NTCP). The basic requirement of various radiobiological modeling is the Dose Volume Histogram (DVH) of the patient treatment plan. The researchers facing more problems due to the unaffordability of the TPS from the vendor because of the huge license cost for radiobiological plan evaluation studies. The DVH studies of the TPS can be possible only within the institution and not outside the institution due to institutional license. Much biological evaluation software like SABER (Spatial and Biological Evaluation Radiotherapy), CERR (computational Environment For Radiotherapy Research), HART (The Histogram Analysis in Radiation Therapy), DRESS (Dose-Response Explorer System), and IsoBED (same Biological Equivalent Dose) been developed in MATLAB program and some software like Bio plan (Biological Plan evaluation software), IsoBED are developed from Microsoft Visual Basic which is all commercial in nature. Bo Zhao, et al., developed MATLAB-based software SABER for analyzing biological models and to calculate TCP and NTCP as a function of the prescribed dose. Similarly, IsoBED software developed by Vincente Bruzzaniti et al. using Microsoft Visual Basic 6.0 calculates and evaluates the DVH.
MATLAB software is very much expensive to afford because of the proprietary nature of algorithms, difficulty in code visibility, not as much portability. The biological evaluation software mentioned above were not reviewed the hotness and coldness of the treatment plan. To override the above factor the high-end freely available program Python is used for this study to overcome the shortcoming of mentioned application in existence. Thus introduced in-house developed software from a high-end programming language Python to calculate the Index of Hotness (IOH) and Index of Coldness (IOC) of both sequential boost (SeqB) treatment plans, the technique allows the simultaneous delivery of different dose levels to different target volumes more than a single treatment and Simultaneously Integrated Boost (SIB) treatment plan, the technique allows the simultaneous delivery of different dose levels to different target volumes within a single treatment. The software is capable of storing the data in oracle databases for future reports.
Materials and Methods
Commercial language
MATLAB is a popular numerical computing environment and programming language and refers to the whole package, including the IDE (Integrated Development Environment). The standard library does not contain as much generic programming but does include matrix algebra and an extensive library for data processing and plotting. The fundamental problems are commercial nature, expensive, proprietary nature of algorithms
Being commercial nature of the product the release of the new version every six months with the improved feature will find difficult to afford it. The non-compatible portability and proprietary nature also make it impossible for 3rd parties to extend or create tools for MATLAB in the research field.
To overcome these difficulties and make the program a userfriendly approach it is attempted to use Python programming language as a tool for the fundamental research on DVH analysis and biological plan evaluation.
Highlights of python
Some of the highlights that have been found by using Python than MATLAB are licensed cost, difficulty to view and modify the source, easier to read and to program, transform ideas into code, extensive standard libraries, powerful data types, freely available, cross-platform, classes and functions can be defined anywhere.
Choice of programming language
In Python, the NumPy, SciPy, and Matplotlib packages are freely available and provide all the other functionality of MATLAB. Simulink is one example that is not covered in Python but is not essential for developing biological modelling software. The comparisons of MATLAB and Python are shown in Table 1.
| S. No. | MATLAB | Python |
|---|---|---|
| 1 | MATLAB is a closed-source software program and a proprietary commercial product | Python is an open-source, high-level, general-purpose programming language, totally free |
| 2 | MATLAB has an integrating development environment | Python has not had default development environment |
| 3 | MATLAB does not have a host of libraries | Python have libraries such as Numpy, SciPy and Matplotlib |
| 4 | MATLAB restrictions on portability | Python very portable/easily shared |
| 5 | MATLAB allows matrix manipulations | Python is best suited for web programming |
| 6 | MATLAB plot functions were not so faster | Python plot functions were comparably faster |
Table 1: MATLAB and Python basic comparison.
Its high level built in data structures combined with dynamic typing and dynamic binding make it very attractive for rapid application development. NumPy array is a powerful Ndimensional array object which is in the form of rows and columns and can initialize NumPy arrays from nested Python lists and perform these NumPy operations.
Graphical user interface
Matplotlib is a plotting library for the Python programming language and its numerical mathematics extension of NumPy. It provides an object-oriented Application Programming Interface (API) for embedding plots into applications using generalpurpose Graphical User Interfaces (GUI) toolkits like Tinder, PyQt5, Kivy, wxPython, Libavg, and PySimpleGUI, etc., Python has a lot of GUI frameworks, but Tkinter is the only framework that’s built into the Python standard library and has several strengths. Tinder was created to equip modern developers with a standard interface to the Tk GUI toolkit with Python bindings; most of the visual elements like widgets offer a different level of customizability. Its cross-platform code works on Windows, Mac OS, and Linux. Visual elements are rendered using native operating system elements, so it is considered the de-facto Python GUI framework which is lightweight and relatively painless to use compared to other frameworks. This makes it a compelling choice for building GUI applications in Python, especially for applications where a modern sheen is unnecessary, and the top priority is to build something functional and cross-platform quickly.
The Integrated Development Environment (IDE) used in python is PyCharm, It is created by JetBrains, a company known for creating great software development tools. There are two versions of PyCharm, one community version - free open-source version, lightweight and the other is the professional version which is good for Python and scientific development.
Oracle and data structures
The output of the python software is stored in a table from the Oracle database, which is freely downloadable; the program used Oracle database 19c standard edition 2 release 19.0.0.0.0– production version.
DVH import
After the IMRT optimization using the commercial TPS such as eclipse, the approved DVH can be imported to our software and can be used to compare the dose statistics.
The DVH text file from graphical DVH is in standard format irrespective of the version of the treatment planning system used; currently, version 11.0.31 is used in this program. The size of exported DVH text file is in the range of a few kilobytes and more than a few thousand lines, which reads as an input file to the python program. The program works well for TPS with versions 11.0.31 to 15.06.1
The DVH text file should be exported in relative mode. Once the software is executed, the application reads the text file of the patient's DVH and started storing the structures and target volumes of the DVH into the special arrays called Numpy array, later the stored arrays can be displayed into a graphical DVH. The dosimetric indices like volume, minimum, maximum, and mean doses termed as dose statistics were calculated and widely used for plan evaluation. For example, the serial organlike spinal cord is evaluated on the maximum dose received and parallel organ like parotids are evaluated on the mean dose.
Many software was designed and developed to evaluate the treatment plan biologically since the 2000’s [1]. The developmental phases of the different applications are shown in Figure 1.

Figure 1: Timeline of plan analysis program 10 , 11, 12, 13, 14, 15, 16, 17, 18, 19, 22.
Most of the application is designed by MATLAB and very few by programming language C, Visual Basic, and Java. This is the first application fundamentally developed and designed by the high-end programming language python with front-end Tinder and back-end Oracle to store the output generated from the program [2].
Dose statistical analysis
The patients with head and neck cancer with SIB-IMRT treatment plan DVH in a text file were retrospectively taken for analyses and comparison [3]. The volume, mean dose, minimum dose, and maximum dose for normal and target structures were computed from the Eclipse TPS and compared with reconstructed DVH from in-house Python software were tabulated in Table 2.
| Patient | Primary site | Staging | Organ at risk | Minimum dose (cGy) | Maximum dose (cGy) | Mean dose (cGy) | ||||||
|---|---|---|---|---|---|---|---|---|---|---|---|---|
| Varian eclipse | Python software | % Deviation | Varian eclipse | Python software | % Deviation | Varian eclipse | Python software | % Deviation | ||||
| 1 | Ca hypopharynx | 4A | Brain Stem | 60.7 | 58 | 4.448105 | 2014 | 2009 | 0.24826 | 180.5 | 182 | -0.83103 |
| Spinal Cord | 12.7 | 11 | 13.38583 | 3250.2 | 3241 | 0.28306 | 1651.1 | 1652 | -0.05451 | |||
| Parotid Left | 230.6 | 224 | 2.862099 | 5464.7 | 5460 | 0.08601 | 2332.1 | 2338 | -0.25299 | |||
| Parotid right | 266.5 | 266 | 0.187617 | 5496.9 | 5467 | 0.54394 | 2581.3 | 2583 | -0.06586 | |||
| 2 | Ca tongue | 4A | Brain Stem | 48.3 | 48 | 0.621118 | 737 | 732 | 0.67843 | 119.5 | 120 | -0.41841 |
| Spinal Cord | 625.3 | 624 | 0.2079 | 3281.2 | 3276 | 0.15848 | 2272.3 | 2274 | -0.07481 | |||
| Parotid Left | 172.4 | 168 | 2.552204 | 6230.4 | 6228 | 0.03852 | 2468.2 | 2472 | -0.15396 | |||
| Parotid right | 80.2 | 78 | 2.743142 | 1289.1 | 1284 | 0.39562 | 402.7 | 408 | -1.31612 | |||
| 3 | Ca tongue | 4A | Brain Stem | 109.1 | 106 | 2.84143 | 2567 | 2560.5 | 0.25321 | 323.2 | 328.8 | -1.73267 |
| Spinal Cord | 299.8 | 293.8 | 2.001334 | 3566.3 | 3560.9 | 0.15142 | 2591.5 | 2595.5 | -0.15435 | |||
| Parotid Left | 240 | 237 | 1.25 | 5923.6 | 5918.6 | 0.08441 | 2628.6 | 2630.5 | -0.07228 | |||
| Parotid right | 270.2 | 265.8 | 1.628423 | 5876 | 5876.6 | -0.0102 | 2588 | 2588.4 | -0.01546 | |||
| 4 | Ca pyriform fossae | 4B | Brain Stem | 112.6 | 111.9 | 0.62167 | 2465.7 | 2462.6 | 0.12572 | 294.4 | 300.8 | -2.17391 |
| Spinal Cord | 42 | 41.9 | 0.238095 | 2977.4 | 2973.3 | 0.1377 | 1934.7 | 1937.9 | -0.1654 | |||
| Parotid Left | 387.7 | 384.8 | 0.748001 | 6131.3 | 6135.5 | -0.0685 | 3356.6 | 3358.1 | -0.04469 | |||
| Parotid right | 439.3 | 433.7 | 1.274755 | 6194.3 | 6191.5 | 0.0452 | 3277.2 | 3281.1 | -0.119 | |||
| 5 | Ca cricopharynx | 4A | Brain Stem | 135.5 | 132.9 | 1.918819 | 3134.9 | 3134.2 | 0.02233 | 829 | 832.5 | -0.4222 |
| Spinal Cord | 100.3 | 97.94 | 2.352941 | 3086.5 | 3085.2 | 0.04212 | 1759.9 | 1763 | -0.17615 | |||
| Parotid Left | 1140.5 | 1140.3 | 0.017536 | 6922.9 | 6919 | 0.05633 | 3418.1 | 3421 | -0.08484 | |||
| Parotid right | 638.8 | 636.6 | 0.344396 | 6923.7 | 6919 | 0.06788 | 3448.7 | 3456 | -0.21167 | |||
| 6 | Ca supraglottis | 3 | Brain Stem | |||||||||
| Spinal Cord | 128.9 | 126 | 2.249806 | 3503.8 | 3500 | 0.10845 | 2209.3 | 2212 | -0.12221 | |||
| Parotid Left | 193 | 189 | 2.072539 | 6063.4 | 6062 | 0.02309 | 1280.7 | 1288 | -0.57 | |||
| Parotid right | 179.4 | 175 | 2.45262 | 6179.3 | 6174 | 0.08577 | 1330.2 | 1330 | 0.015035 | |||
| 7 | Ca pyriform fossae | 3 | Brain Stem | 110.8 | 109 | 1.624549 | 4668.7 | 4662.8 | 0.12637 | 1034.2 | 1036 | -0.17405 |
| Spinal Cord | 25.4 | 23 | 9.448819 | 4592.5 | 4592 | 0.01089 | 2467.1 | 2471 | -0.15808 | |||
| Parotid Left | 312.8 | 308 | 1.534527 | 5708 | 5705 | 0.05256 | 3103.5 | 3108 | -0.145 | |||
| Parotid right | 283.1 | 280 | 1.095019 | 7046.1 | 7042 | 0.05819 | 3371 | 3374 | -0.08899 | |||
| 8 | Ca pyriform fossae | 3 | Brain Stem | 90.4 | 84 | 7.079646 | 3413.8 | 3409 | 0.14061 | 2134.8 | 2142 | -0.33727 |
| Spinal Cord | 267 | 266 | 0.374532 | 6555.5 | 6552 | 0.05339 | 2419.8 | 2422 | -0.09092 | |||
| Parotid Left | 271.6 | 266 | 2.061856 | 6401.4 | 6398 | 0.05311 | 2441 | 2450 | -0.3687 | |||
| Parotid right | 1316 | 1321 | 0.379939 | 6909 | 6913.1 | -0.0593 | 3605 | 3604.5 | 0.01387 | |||
| 9 | Ca supraglottis | 3 | Brain Stem | 53.4 | 52 | 2.621723 | 556.1 | 549.3 | 1.2228 | 118.7 | 122.1 | -2.86436 |
| Spinal Cord | 105.3 | 101.7 | 3.418803 | 3372.1 | 3371.7 | 0.01186 | 1727.9 | 1729.9 | -0.11575 | |||
| Parotid Left | 201 | 196.7 | 2.139303 | 5867.9 | 5861.4 | 0.11077 | 1827.4 | 1831.7 | -0.23531 | |||
| Parotid right | 201 | 196.7 | 2.139303 | 5919.3 | 5915.6 | 0.06251 | 2069.7 | 2075.9 | -0.29956 | |||
Table 2: Dose statistic of the DVH structure for the IMRT Plan of head and neck patient from eclipse and Python program.
This basic python code is developed to export the Eclipse DVH text file and to reconstruct the graphical DVH for the physical and biological evaluation of the treatment plan [4]. Apart from the dose statistic, the volumes of the OAR were also determined in the python program to check the compatibility of the original DVH of the Eclipse TPS. The specific window of the software permits to read of the DVH file and correspondingly analysis of DVH is carried out. The volumes and the dose statistic can be visualized for all OARs and PTVs. The python software is brilliant enough to re-size, pan, magnify, export, print the DVH, and storing in the required destination
Python code for calculation of minimum, maximum, and mean dose from the special array called numpy are stored in the dose data bins. The software internally converts the cumulative DVH to differential DVH by the program requirement [5]. We choose cumulative DVH as the software input because the python program is designed to read the cumulative relative DVH as inputs.
The standard deviation between dose statistics of eclipse and in-built software is 0.2380 (deviation are highly negligible) and based on these observations it is understood that the DVH generated from the Eclipse text file are congruent with the DVH regenerated from the in-house developed python software.
Hence the software can be used to perform other physical and biological indexes of the treatment plan from the text file generated from the dose-volume histogram of the Eclipse Treatment Planning System (ETPS).
Results
The Python program reads the DVH text file in relative dose mode (kilobytes size) rather than absolute dose mode (megabytes size) and displayed DVH is processed by the python program in millisecond (less than 1 second).
The text file generated from the DVH of Eclipse TPS from M/s. Varian Medical System for IMRT patients plan is passed as input to the developed program [6].
DVH dose statistic comparison
To check the integrity and accuracy of the python reconstructed dose-volume histogram from the eclipse generated DVH text file of the patient plan, we considered DVH of 10 IMRT Head Neck patient’s treatment approved plan [7].
Patient CT simulation
The Immobilization is achieved with commercially available rigid devices, such as headrest leg abductor and shoulder retractor (POCL, Medical system, Mumbai) and CT scanning was performed in the supine position with the resolution between 0.93 to 0.98 mm in the axial plane and slice thickness of 2.5 mm using a dedicated GE Discovery IQ PET-CT 16 slice machine and exported to via network to eclipse version V15, Planning Target Volumes (PTV) and OAR volumes were contoured by the radiation oncologist.
Treatment parameter
The seven-filed IMRT plan was first generated using the Eclipse TPS for the standard fractionation treatment. The IMRT plan consists of seven beam angles (gantry angles, 51, 102, 153, 204, 255, and 306 degrees) with the entire beam having 6-MV beam quality. The algorithm for dose calculation was performed by Analytical Anisotropic Algorithm (AAA) after the leaf motion calculator [8].
Image verification
Daily CBCT (Cone Beam Computed Tomography) image guidance was applied for all patients using the system integrated into the Clinac iX with on board imaging system. A two-step matching strategy was followed: first, a fully automatic registration based on bony anatomy Bone Matching (BM) was carried out. After BM, the matching was adjusted by a physician through Direct Visualization (DV) of the center of mass shift. After the accomplishment of the matching procedures, the final correction was automatically applied for translations and roll angle rotation (axis of rotation: head-feet), and the patient was subsequently treated and the treatment was delivered for five fractions per week for precise dose delivery.
Clinical results
The minimal dose criterion of 95% of the prescribed dose to the PTV was given the greatest priority during optimization with a Millennium MLC-120 multiyear collimator. The American Association of Physicists in Medicine (AAPM)/Radiation Therapy Oncology Group (RTOG)/Quantitative Analyses of Normal Tissue Effects in the Clinic (QUANTTEC) dose constrain objectives are applied for the OAR. The energy fluence and DVH of the treatment fields after optimization of the treatment plan are shown in Figures 2 and 3.

Figure 2: Energy fluency of the treatment field after optimization of the treatment plan.

Figure 3: DVH of the eclipse treatment planning system.
The dose distributions were calculated on the planning CT scan using 2.5 x 2.5 mm2 grid sizes and the DVH after energy fluency calculation is exported in text format from the Eclipse system.
The output of this comprehensive in-house developed Python software program for calculating dose statistics is shown in Table 3 [9]. From the above tabulation is more evident that the max and mean dose values are within the acceptable deviation (0.3%). The hotness and coldness of the nine cervix patients with the IMRT technique were analyzed in this software and the output is generated as tabulated in Table 3.
| Patient | Primary site | Stage | Target Volume 70 | Target Volume 63 | Target Volume 60 | Target Volume 59.4 | Target Volume 56 | Target Volume 54 | Target Volume 50 | |||||||
|---|---|---|---|---|---|---|---|---|---|---|---|---|---|---|---|---|
| Hot | Cold | Hot | Cold | Hot | Cold | Hot | Cold | Hot | Cold | Hot | Cold | Hot | Cold | |||
| 1 | Ca hypopharynx | 4A | 1.054 | 0.946 | 1.095 | 0.905 | ||||||||||
| 2 | Ca tongue | 4A | 1.005 | 0.995 | 1.039 | 0.961 | ||||||||||
| 3 | Ca cricopharynx | 4A | 1.008 | 0.992 | 1.058 | 0.942 | 1.09 | 0.91 | ||||||||
| 4 | Ca tongue | 4A | 1.006 | 0.994 | 1.078 | 0.922 | 1.11 | 0.89 | ||||||||
| 5 | Ca pyriform fossae | 3 | 1.004 | 0.996 | 1.04 | 0.96 | 1.078 | 0.922 | ||||||||
| 6 | Ca pyriform fossae | 3 | 1.007 | 0.993 | 1.041 | 0.959 | 1.08 | 0.92 | ||||||||
| 7 | Ca pyriform fossae | 4B | 1.008 | 0.992 | 1.057 | 0.943 | 1.092 | 0.908 | ||||||||
| 8 | Ca supraglottis | 3 | 1.004 | 0.996 | 1.058 | 0.942 | 1.09 | 0.91 | ||||||||
| 9 | Ca supraglottis | 3 | 1.008 | 0.992 | 1.069 | 0.94 | 1.092 | 0.908 | ||||||||
Table 3: Hotness and coldness calculated from the Python software program for the head and neck patient SIB-IMRT treatment plan.
Discussion
This is the first biological based treatment plan evaluation software written in a high-end python programming language with input DVH text file generated from the Varian Eclipse commercial planning system and the generated output is displayed in Tinder frames and stored simultaneously in the oracle database for further research studies [10].
This software program is named as Relative Dose System (RDS) plan evaluation system as relative DVH is imported to the software in a text file as input, the software extracts data points from the text file and stores in a Numpy array for re-generating the DVH and analyzing all the biological and physical parameters. The data points of the generated DVH graph were found to be in excellent agreement with the Eclipse TPS. Clinically the RDS software is more ideal for examining the DVH statistics from Simultaneous Integrated Boost Intensity Modulated Radiotherapy (SIB-IMRT) plan, the newly developed approach of applying different radiation doses to different areas in one single session.
This software is developed using the high-end programming language Python, which compares the dose statistic of eclipse TPS from the reconstructed DVH of the python program [11]. This preliminary and pilot study for finding the dose statistic like mean, minimum, maximum dose of the tumor or target structure and OAR from the reconstructed graphical dosevolume histogram from a text file generated from plan DVH.
The result of the study from the Eclipse generated DVH and Python reconstructed DVH were compared with dose statistic calculated and it is found that the maximum dose average deviation is less than 0.1% and mean dose average deviation is less than 0.3% the minimum dose variation of around 1% is observed, because of the fewer data points in the relative dosevolume histogram bins than the absolute data points. The minimum dose is not significantly important in the calculation of any biological model; the dose tolerance of the normal structure is based on the maximum and mean dose.
The quality and integrity of data are maintained at the program level while converting the DVH text file to graphical format and the output DVH graph generated from the python program is highly consistent with the Eclipse TPS generated DVH. The speed of the application depends on the Numpy array, which uses much less memory to store data. The program uses the Numpy array rather than a list because arrays take significantly less amount of memory as compared to python lists. The significance of storing the data and speed of the program depends on the Numpy program which is not available in C and C++. The results were cross-checked randomly with the existing ETPS and found exactly matching with the in-house developed python software program by checking the volume, mean and maximum dose to the DVH structure.
Based on the consistency and reproducibility of the DVH graph, the hotness and coldness for nine IMRT cervix cases were analyzed. The proposed two Indices of Hotness (IOH) and Index of Coldness (IOC) indicate the hot or cold of the target that has been evaluated with the use of DVH. Hence to evaluate the feasibility of the proposed indices benchmark calculation performed on the sample IMRT plan from the study done.
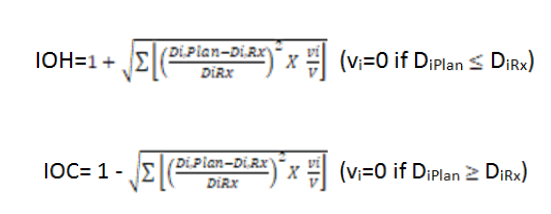
Differential Dose Volume Histograms (dDVH), obtained from a python software from the text of DVH of commercial treatment planning system (Eclipse; Varian Medical Systems) were used in the calculation of IOH and IOC for the sequential boost and SIBIMRT. Where V is the total volume of the target, vi, Di denotes the ith bin of the differential DVH is the volume of the ith voxel in the target volume, DiRx and DiPlan are the prescribed and planned dose of the ith voxel respectively [12].
The IOH and IOC for SIB-IMRT were calculated and tabulated as above, which is found satisfactory. For all indices, 1 means the perfect agreement between prescribed and planned dose, while farther from 1 indicates greater dissimilarity. It should be noted that the Index of coldness has a value equal to or less than 1, representing under dose to the target volume, while IOH has values equal to or greater than 1. The application is designed to generate a DVH graph from a text file of an IMRT plan with 16 DVH in less than 1 second.
It is well known that plan comparison studies remain controversial because the major issue is that the plan evaluation methods used in plan comparison, the correlation between treatment plan and clinical outcomes like toxicities, survival by physician and physicist about the influence of plan results and plan quality on patient treatment.
Along this line, the proposed in-house built software for optimizing treatment plans clinically and radio biologically indicates further directions in radiobiological plan evaluation studies.
The current study will escalate the in-house developed software to analyze DVH in all perspectives dimensions to calculate the physical index like Conformity Index (CI) and Homogeneity Index (HI) of the target volume and biological indexes like TCP and NTCP [13]. It is also planned for calculating the Uncomplicated Tumour Control probability (UTCP) with effective volume of the OAR under homogeneous and nonhomogeneous irradiation along with plan evaluation using the APM/QUANTEC/EMAMI (Dr. B. Emami)/RTOG protocol [14-17].
Conclusion
Dose statistics calculated from the Eclipse generated DVH and Python reconstructed DVH were compared and it is found that the average maximum dose deviation is less than 0.1%, the minimum dose variation of around 1%, and average mean dose deviation is less than 0.3% was observed due to the fewer data points in the relative dose-volume histogram bins than the absolute data points. Results were cross-checked randomly with the existing treatment planning system and found the dose statistics exactly matching with the TPS, as the speed of the program depends on the Numpy module, which is implemented in the python program, the application had been tested and found that it can generate DVH graph from a text file of IMRT plan with 16 DVH in less than 1 second.
Funding
The current research work did not receive any specific grant from funding agencies in the public, commercial, or not-forprofit sectors.
Declaration of Competing Interest
The authors declare that they have any vested financial interests in individual relationships that could materialize to impact the work reported in this paper.
Acknowledgment
The research is supported by Thangam Cancer Hospital, Namakkal, Tamil Nadu and India.
References
- Lee S, Cao YJ, Kim CY (2015) Physical and Radiobiological Evaluation of Radiotherapy Treatment Plan. In Tech Open, Japan. 1-42.
- Pyakuryal A, Myint WK, Gopalakrishnan M, Jang S, Logemann JA, et al. (2010) A computational tool for the efficient analysis of dose-volume histograms for radiation therapy treatment plans. J Appl Clin Med Phys 11:137–157
[Crossref] [Googlescholar] [Indexed]
- Kim JS, Yoon MG, Shin JS, Shin EH, Ju SG, et al. (2009) A Dose Volume Histogram Analyzer Program for External Beam Radiotherapy. Radiat Oncol J 27:240–248
[Crossref] [Googlescholar] [Indexed]
- Bruzzaniti V, Abate A, Pedrini M, Benassi M, Strigari L (2011) IsoBED: a tool for automatic calculation of biologically equivalent fractionation schedules in radiotherapy using IMRT with a Simultaneous Integrated Boost (SIB) technique. J Exp Clin Cancer Res 30:52
[Crossref] [Googlescholar] [Indexed]
- Gay HA, Niemierko A (2007) A free program for calculating EUD-based NTCP and TCP in external beam radiotherapy. Phys Med 23:115-125
[Crossref] [Googlescholar] [Indexed]
- Warkentin B, Stavrev P, Stavreva N, Field C, Fallone BG (2004) A TCP-NTCP estimation module using DVHs and known radiobiological models and parameter sets. J Appl Clin Med Phys 5:50–63
[Crossref] [Googlescholar] [Indexed]
- Oinam AS, Singh L, Shukla A, Ghoshal S, Kapoor R, et al. (2011) Dose-volume histogram analysis and comparison of different radiobiological models using in-house developed software. J Med Phys 36:220
[Crossref] [Googlescholar] [Indexed]
- Pasciuti K, Iaccarino G, Strigari L, Malatesta T, Benassi M, et al. (2011) Tissue Heterogeneity in IMRT Dose Calculation for Lung Cancer. Med Dosim 36:219–227
[Crossref] [Googlescholar] [Indexed]
- KutcherGJ, Burman C, Brewster L, Goitein M, Mohan R (1991) Histogram reduction method for calculating complication probabilities for three-dimensional treatment planning evaluations. Int J Radiat Oncol 21:137–146
[Crossref] [Googlescholar] [Indexed]
- Lee TF, Chao PJ, Wang HY, Hsu HC, Chang P, et al. (2012) Normal tissue complication probability model parameter estimation for xerostomia in head and neck cancer patients based on scintigraphy and quality of life assessments. BMC Cancer 12:567
[Crossref] [Googlescholar] [Indexed]
- Alfonso CL, Herrero MA, Nunez L (2015) A dose-volume histogram-based decision-support system for dosimetric comparison of radiotherapy treatment plans. Radiat Oncol 10:263
[Crossref] [Googlescholar] [Indexed]
- Park YK, Park S, Wu HG, Kim S (2014) A new plan quality index for dose painting radiotherapy. J Appl Clin Med Phys 15:316–325
[Crossref] [Googlescholar] [Indexed]
- Kataria T, Sharma K, Subramani V, Karrthick KP, Bisht SS (2012) Homogeneity Index: An objective tool for assessment of conformal radiation treatments. J Med Phys 37:207-213
[Crossref] [Googlescholar] [Indexed]
- Cheung MLM, Kan MWK, Yeung VTY, Poon DMC, Kam MKW, et al. (2021) Analysis of Hepatocellular Carcinoma Stereotactic Body Radiation Therapy Dose Prescription Method Using Uncomplicated Tumor Control Probability Model. Adv Radiat Oncol 6:100739
[Crossref] [Googlescholar] [Indexed]
- Kutcher GJ, Burman C (1989) Calculation of complication probability factors for non-uniform normal tissue irradiation: The effective volume method Gerald. Int J Radiat Oncol 16:1623–1630
[Crossref] [Googlescholar] [Indexed]
- Marks LB, Yorke ED, Jackson A, Ten Haken RK, Constine LS, et al. (2010) Use of Normal Tissue Complication Probability Models in the Clinic. Int J Radiat Oncol 76:10–19
[Crossref] [Googlescholar] [Indexed]
- Wu Q, Manning M, Schmidt-Ullrich R, Mohan R (2000) The potential for sparing of parotids and escalation of biologically effective dose with intensity-modulated radiation treatments of head and neck cancers: a treatment design study. Int J Radiat Oncol 46:195–205
[Crossref] [Googlescholar] [Indexed]

Open Access Journals
- Aquaculture & Veterinary Science
- Chemistry & Chemical Sciences
- Clinical Sciences
- Engineering
- General Science
- Genetics & Molecular Biology
- Health Care & Nursing
- Immunology & Microbiology
- Materials Science
- Mathematics & Physics
- Medical Sciences
- Neurology & Psychiatry
- Oncology & Cancer Science
- Pharmaceutical Sciences