ISSN : ISSN: 2576-1412
Journal of Applied Microbiology and Biochemistry
Antifungal Activity and Metabolites Study of Bacillus Strain Against Aflatoxin Producing Aspergillus
Department of Plant Biotechnology, College of Agricultural Biotechnology, Latur, Maharashtra, India
- *Corresponding Author:
- Achyut Ashokrao Bharose
Department of Plant Biotechnology
College of Agriculture Biotechnology, Row house no 95
Gangadham housing society
Ausa-latur- Nanded ring road
Near Gojgunde Petrol Pump 413512
Latur, Maharashtra, India
Tel: 07621816561
E-mail: achyut.bharose@gmail.com
Received Date: May 24, 2018; Accepted Date: June 20, 2018; Published Date: July 30, 2018
Citation: Bharose AA, Gajera HP (2018) Antifungal Activity and Metabolites Study of Bacillus Strain Against Aflatoxin Producing Aspergillus. J Appl Microbiol Biochem. Vol.2 No.2:8
Abstract
Achieving metabolomic data with satisfactory coverage is a formidable challenge in metabolomics because metabolites are a chemically highly diverse group of compounds. The knowledge concerning the behavior of these Bacilli as antagonists and metabolite analysis is essential for their effective use and the commercialization. The present study was focused on selection of best biocontrol antifungal Bacillus strain against aflatoxin producing Aspergillus by antagonism on PDA medium. About 16 different strains of bacteria were isolated from healthy and infested rhizosphere of groundnut using N-agar medium. The isolates were identified based on morphological and microscopic characters. Bacterial isolate JND-KHGn- 29-A and JND-KSGn-30-L were recorded to be a best antagonist as of its ability to inhibit most toxic fungus A. flavus JAM-JKB-BHA-GG20 (58.20%) after screening with 16 Bacillus isolates. GCMS analysis of best and least bacterial antagonist Bacillus subtilis (JND-KHGn-29-A, Accession KU984480) inoculated onto N-agar medium identified total 55 and 42 compounds respectively. Whereas GCMS analysis from best bacterial antagonist Pseudomonas isolate no. 14 (JNDKSGn- 30-L) inoculated onto N-agar identified total 60 compounds.
Keywords
Bacillus subtilis; Aspergillus; Aflatoxin; GCM
Introduction
The rhizosphere is a complex system in which beneficial plant microbe interactions play vital role in agriculture to sustain the plant growth and productivity. The bacillus bacteria play vital role in plant health by direct and indirect activities. The direct activity attributed by increased uptake of nitrogen [1] phytohormones synthesis [2,3] solubilization of phosphorus and siderophore production [4] while indirect activity include realise of phytoharmones like secondary metabolites viz. HCN, ammonia, antibiotics, and volatile metabolites [5]. The ability of the antagonistic rhizobacteria is highly influenced by their morphological characteristics to inhibit the pathogens. Achieving metabolome data with satisfactory coverage is a formidable challenge in metabolomics because metabolites are a chemically highly diverse group of compounds. The knowledge concerning the behavior of these Bacilli as antagonists and metabolite analysis is essential for their effective use and the commercialization. Recently, volatile compounds produced by bacteria and fungus have been demonstrated with antifungal nature by several studies. Gas chromatography-mass spectrometry (GC-MS) is one of the most commonly used analytical techniques with a high liability and a capability of high-throughput and automated analysis.
The cultivated groundnut (Arachis hypogaea L.) is the most important oilseed crop and its kernels are also eaten raw, boiled or roasted. After the crop harvest, haulm and the expeller oil cake is used for animal feed. Aflatoxin contamination in groundnut seed is a major problem affecting the export. Aflatoxin contamination of the seed by A. flavus can occur during pre-harvest, during harvest and drying in the field, and during transportation and storage.
Objective
The present study was to evaluate the best and least bacterial bio control agent using in vitro antagonism against toxinogenic A. flavus and study the metabolites using GCMS of the antagonist isolated from healthy and infested rhizosphere of groundnut.
Materials and Methods
The present study was conducted to isolate native strains of rhizobacteria from healthy and infested rhizosphere of groundnut.
Collection of soil samples and isolation of rhizospheric bacteria
Rhizosphere soil was collected from groundnut fields healthy and infested with fungal disease like stem rot, color rot etc. Soil samples were collected from 16 rhizospheric soils of different field crops. For the isolation of native rhizobacteria 1 gm of soil was suspended in 90 ml distilled autoclaved water. Serial dilution agar plate method was used for further processing of the prepared soil suspension, Suitable dilutions were plated on N-agar media. All the plates were incubated for 2 days at 28°C [6]. Well isolated pure bacterial colony were selected and transferred on freshly prepared N-agar media and stored at low temperature in refrigerator till further use [7].
Morphological characteristics of bacterial isolates
Morphological characteristics of the colony of each isolate were examined on the NA-agar plates after incubated for 3 days at 28°C. Then colony characterization of N-agar media was carried out viz., size, shape, margin, elevation, texture, opacity and pigmentation.
Microscopic examination of bacterial isolates
Standard microbiological methods were used to fix the cells to slides for Gram staining and observed under Zeiss Axiocam Imager, model Z 2. Endospore staining was carried out by the method of Aneja et al. [6]. In vitro antagonism of bacterial isolates against aflatoxinogenic A. flavus To derive best biocontroller, all bacterial isolates were subjected to in vitro antagonism with highly virulent and aflatoxigenic Aspergillus strain. The most responsive fungal isolate was cultivated in petriplate with 20 ml of potato dextrose agar for seven days. Discs of 5 mm diameter were cut and removed from the growing borders of the colonies and transferred to another petriplates with Potato Dextrose Agar. Aflatoxicity of isolated pathogen was tested using biochemical method. In this method, the reverse side of colonies of toxin producing strains on potato dextrose agar (PDA) medium turns from yellow to pink immediately after exposure to ammonium hydroxide vapor. The test fungus was placed in the each center of the petriplate and approximately 3cm away bacterial isolates. The bacterial isolates were spread in round shape around the bid of the fungus. Control plates were maintained only with pathogen. All the inoculated plates were incubated at 28 ± 2°C temperature and observed after ten days for growth of antagonist bacteria and test fungus [8]. The experiment was conducted in completely randomized design with three replications. At the end of incubation period, radial growth of pathogen A. flavus was measured and Index of antagonism was determined by following the method of [9] as depicted below % Growth Inhibition=CT/ C*100 Where, C=colony diameter of pathogen in control T=colony diameter pathogen in inhibition plate.
Characterization of bacterial antagonist (Best)
To derive best biocontroller all isolates of bacteria were subjected to in vitro antagonism with highly virulent and toxigenic Aspergillus strain. The most responsive fungal isolate was cultivated in petriplate with 20 ml of Potato Dextrose Agar for seven days. Discs of 5 mm diameter were cut and removed from the growing borders of the colonies and transferred to another petriplates with potato dextrose agar. The test fungus was placed in the each center of the petriplate and approximately 3cm away bacterial isolates. The bacterial isolates were spreaded in round shape around the bid of the fungus. Control plates were maintained only with pathogen. All the inoculated plates were incubated at 28 ± 2°C temperature and observed after ten days for growth of antagonist bacteria and test fungus [8]. The experiment was conducted in CRD with three replications. The colony overgrowth time was recorded. At the end of incubation period, radial growth was measured and Index of antagonism was determined by following the method of [9] as depicted below

Where, C=colony diameter of pathogen in control
T=colony diameter of pathogen in inhibition plate
Extraction of bioactive compound for GCMS analysis from bacterial antagonist
The most potent and least potent isolates were grown on nutrient agar medium as a production media for the extraction of crude compound. The isolates were incubated for 24 hrs in shaker incubator at 28°C. The isolates were centrifuged for 15 min at 8,000 rpm. Supernatant was collected by filtration through Whatman filter paper no.1 to remove bacterial cells. The cell free culture filtrates were extracted with ethyl acetate at volume ratio of 1:1 by use of a separating funnel.
The extract was passed through a pad of anhydrous sodium sulphate to remove excess water and thereafter evaporated to dryness using a rotary vacuum evaporator. The crude extracts were used for Gas Chromatography- The compound was identified by using GC-MS technique [10]. The mass spectrum was recorded by using SHIMADZU QP2010. Mass spectrometry under current (MA) 100 and the temperature at 70°C was done.
Results
Morphological characteristics of microbes
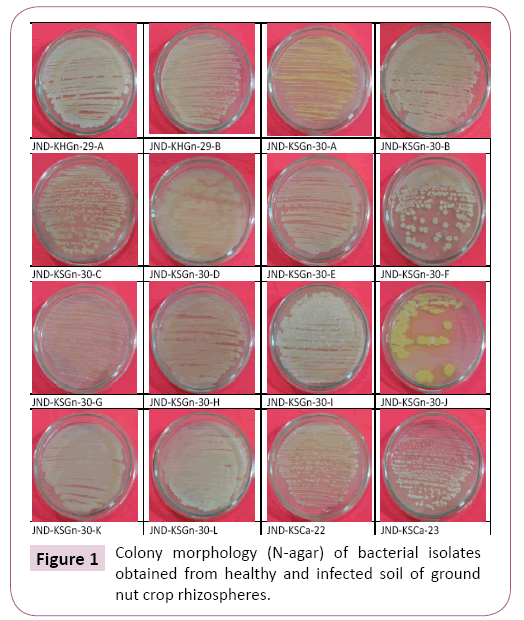
About 16 different strains of bacteria were isolated from healthy and infested rhizosphere of groundnut soil from different field (Table 1 and Figure 1). The colony color, shape, size, margin, opacity, texture, elevation and pigmentations of all sixteen isolates were determined by observing the plates after 7 days on N agar medium (Table 1).
Table 1 Morphological characterization of bacterial isolates collected from groundnut rhizosphere.
| Crop name | Rhizosphere Condition | Code Name | Colony Shape | Size | Color | Margin | Opacity | Texture/ Consistency |
Elevation | Pigmentation |
|---|---|---|---|---|---|---|---|---|---|---|
| Ground nut | Healthy | JND-KHGn-29-A | irregular | medium | white | undulate | opaque | brittle | flat | no |
| Ground nut | Healthy | JND-KHGn-29-B | circular | tiny | white | entire | opaque | dry | raised | no |
| Ground nut | Sick | JND-KSGn-30-A | circular | tiny | yellowish | entire | opaque | dry | raised | no |
| Ground nut | Sick | JND-KSGn-30-B | irregular | medium | white | undulate | opaque | brittle | flat | red |
| Ground nut | Sick | JND-KSGn-30-C | irregular | small | white | curled | opaque | dry | umbonate | no |
| Ground nut | Sick | JND-KSGn-30-D | filamentous | large | white | filiform | opaque | dry | flat | no |
| Ground nut | Sick | JND-KSGn-30-E | circular | small | white | entire | opaque | moist | raised | no |
| Ground nut | Sick | JND-KSGn-30-F | irregular | large | white | curled | opaque | dry | umbonate | red |
| Ground nut | Sick | JND-KSGn-30-G | circular | tiny | white | entire | opaque | moist | umbonate | no |
| Ground nut | Sick | JND-KSGn-30-H | irregular | large | white | undulate | opaque | dry | flat | red |
| Ground nut | Sick | JND-KSGn-30-I | irregular | medium | white | undulate | opaque | brittle | flat | no |
| Ground nut | Sick | JND-KSGn-30-J | irregular | large | yellow | curled | opaque | dry | umbonate | yellow |
| Ground nut | Sick | JND-KSGn-30-K | irregular | large | white | undulate | opaque | buttery | raised | red |
| Ground nut | Sick | JND-KSGn-30-L | irregular | large | white | undulate | opaque | brittle | flat | cream |
| Castor | Sick | JND-KSCa-22 | circular | small | white | entire | opaque | viscous | convex | no |
| Castor | Sick | JND-KSCa-23 | circular | small | white | entire | opaque | viscous | convex | no |
In vitro antagonism of bacterial isolates with virulent Aspergillus to derive best biocontroller
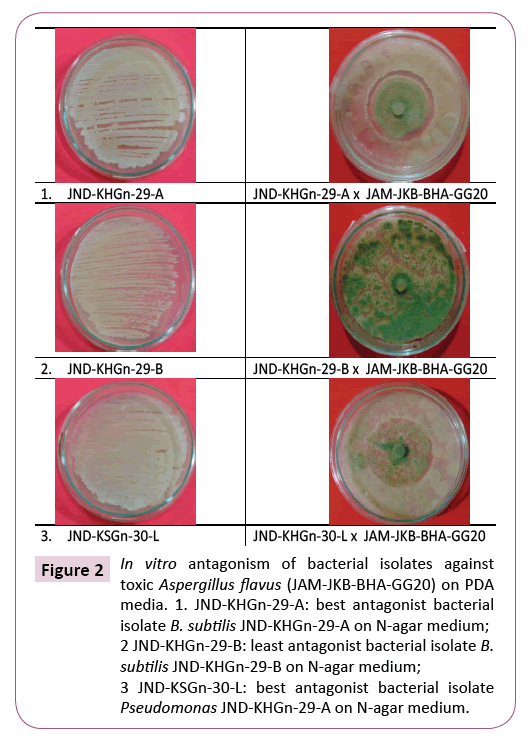
All the bacterial isolates were screened with JAM-JKB-BHA-GG20 (isolate 3) most toxic isolate of Aspergillus flavus fungus. Growth inhibition of Aspergillus flavus during in vitro interaction with biocontrol bacterial agents were recorded at 7 DAI (Table 2 and Figure 2). The experiment was performed in three replicates and the data obtained was analised by using CRD design.
Table 2 Percent growth inhibition of A. flavus by Bacillus antagonists.
| Isolate No. |
Treatment | % Growth Inhibition 7 DAI |
|---|---|---|
| T1 | JND-KHGn-29-A X Pathogen-AFvs* | 58.20 |
| T2 | JND-KHGn-29-B X Pathogen -AFvs | 0.00 |
| T3 | JND-KSGn-30-A X Pathogen-AFvs | 6.04 |
| T4 | JND-KSGn-30-B X Pathogen-AFvs | 47.80 |
| T5 | JND-KSGn-30-C X Pathogen-AFvs | 25.82 |
| T6 | JND-KSGn-30-D X Pathogen-AFvs | 2.20 |
| T7 | JND-KSGn-30-E X Pathogen-AFvs | 8.79 |
| T8 | JND-KSGn-30-F X Pathogen-AFvs | 5.00 |
| T9 | JND-KSGn-30-G X Pathogen-AFvs | 20.88 |
| T10 | JND-KSGn-30-H X Pathogen-AFvs | 7.14 |
| T11 | JND-KSGn-30-I X Pathogen-AFvs | 22.53 |
| T12 | JND-KSGn-30-J X Pathogen-AFvs | 21.43 |
| T13 | JND-KSGn-30-K X Pathogen-AFvs | 6.04 |
| T14 | JND-KSGn-30-L X Pathogen-AFvs | 52.27 |
| T15 | JND-KSCa-23 X Pathogen-AFvs | 48.04 |
| T16 | JND-KSCa-22 X Pathogen-AFvs | 45.30 |
| Control = Pathogen | 0.00 | |
| S.Em.+ | 0.444 | |
| C.D. @ 5% | 1.275 | |
| C.V. % | 3.783 |
* A. flavus JAM-JKB-BHA-GG20 (Isolate-3) - most toxic to produce aflatoxin
Figure 2: In vitro antagonism of bacterial isolates against toxic Aspergillus flavus (JAM-JKB-BHA-GG20) on PDA media. 1. JND-KHGn-29-A: best antagonist bacterial isolate B. subtilis JND-KHGn-29-A on N-agar medium; 2 JND-KHGn-29-B: least antagonist bacterial isolate B. subtilis JND-KHGn-29-B on N-agar medium; 3 JND-KSGn-30-L: best antagonist bacterial isolate Pseudomonas JND-KHGn-29-A on N-agar medium.
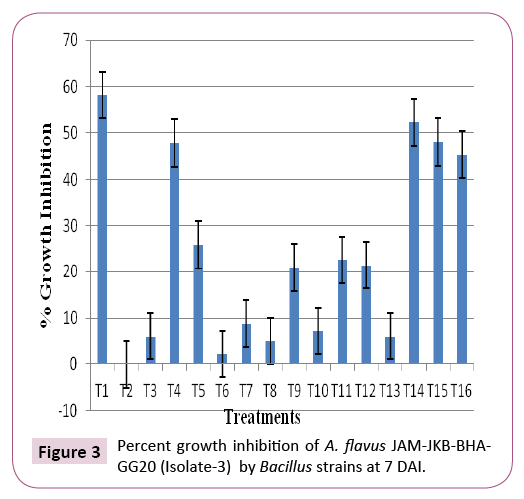
The antagonist result clearly inhibiting depicted that the bacterial isolate T1 (JND-KHGn-29-A (isolate no. 1) was the best antagonist inhibiting (58.20%) growth of test pathogen A. flavus followed by isolate no. T15 (JND-KSCa-22), T16 (JND-KSCa-23) and T4 (JND-KSGn- 30-B). Whereas, bacterial isolate T2 (JND-KHGn-29-B) (isolate no. 2) was found least antagonist (0.00%) among 16 bacterial isolates followed by isolate no. T6 (JND-KSGn-30-D), T8 (JND-KSGn-30-F), T3 (JND-KSGn-30-A), T12 (JND-KSGn-30-J) and T10 (JND-KSGn- 30-H), which was able to inhibit the pathogenic fungus JAM-JKBBHA- GG20 (isolate 3) (Table 2, Figures 2 and 3).
Overall, the growth inhibition of Aspergillus flavus was observed significantly higher by antagonist bacterial isolate T1:JND-KHGn-29-A (isolate no. 1) (58.20%) followed by 15: bacterial isolate 15(48.04%), T4: bacterial isolate 4 (47.80%)
Metabolome profile of best and least bacterial antagonists
Metabolomics is the study of cells by qualitative and quantitative analysis of all or a large number of small molecular metabolites, which are under a specific physiological condition [11,12]. Metabolomics can be done with techniques like gas chromatography/mass spectrometry (GC/MS) [13-16]. In current study the best bacterial antagonist Bacillus subtilis (JND-KHGn- 29-A, Accession no. KU984480) and 14 (JND-KSGn-30-L) with least antagonist B. subtilis (JND-KHGn-29-B, Accession no. KU984481) were grown on N-agar media and analysed through GC-MS to identify the compounds by which the strain differed in inhibiting pathogenic fungus. The total and unique compounds identified by above antagonist are illustrate below. The culture supernatant was run as blank and the common metabolites with antagonist were substrates.
GC-MS analysis identified total of 55, 60 and 42 in best bacterial antagonist isolate no. 1 (JND-KHGn-29-A, Accession no. KU984480), best antagonist isolate no. 14 (JND-KSGn-30-L) and least antagonist isolate no. 2 (JND-KHGn-29-B, Accession no. KU984481) respectively.
GCMS analysis from bacterial isolates
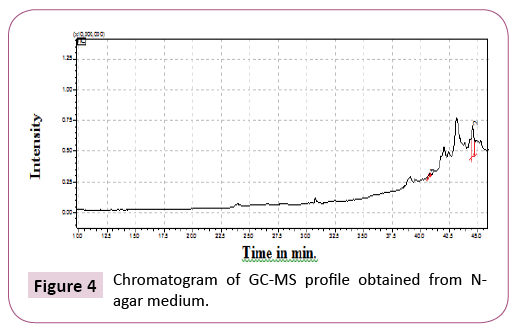
GCMS analysis of N-agar medium: GCMS analysis of N agar culture medium identified only two compounds. These compounds are unique compounds as they are only found in N agar medium and not in any other isolate (Table 3 and Figure 4).
Table 3 GC-MS analysis of N-Agar medium.
| Peak No. | Retantion time (Min) | Compound Name | Area (%) |
|---|---|---|---|
| 1 | 40.789 | 2,6,10,14,18,22-Tetracosahexaene | 5.55 |
| 2 | 44.583 | 2,2,4-Trimethyl-3-(3,8,12,16-tetramethyl-heptadeca-3,7,11,15-tetraenyl)-cyclohexanol | 94.45 |
GCMS analysis of best bacterial antagonist Bacillus subtilis (JND-KHGn-29-A, Accession KU984480) inoculated onto N-agar medium.
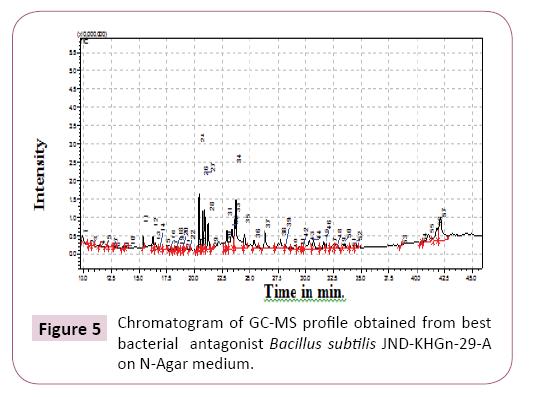
Total 55 compounds were identified in best bacterial antagonist Bacillus subtilis (JND-KHGn-29-A, Accession no. KU984480) inoculated onto N-agar (Table 4 and Figure 5). Only 2-Hydroxy- 4-phenyl-6-phenethylpyrimidine (10%) was identified as main compound.
Table 4 GC-MS analysis of best bacterial antagonist Bacillus subtilis isolate no. 1 JND-KHGn-29-A on N-Agar medium.
| Peak No. | RT (Min) | Compound Name | Area % |
|---|---|---|---|
| 1 | 9.94 | Butanedioic acid | 1.58 |
| 2 | 10.525 | Silane | 0.03 |
| 3 | 10.797 | Butane | 0.06 |
| 4 | 11.469 | Butanal | 0.26 |
| 5 | 12 | Propanoic acid | 0.03 |
| 6 | 12.39 | 2-Mono-isobutyrin | 0.18 |
| 7 | 12.661 | Trimethylsilyl ether of glycerol | 0.05 |
| 8 | 12.827 | Heptasiloxane, hexadecamethyl- | 0.1 |
| 9 | 13.57 | Erythrose per-TMS | 0.16 |
| 10 | 13.77 | 2-Deoxy ribose per-TMS II | 0.26 |
| 11 | 15.392 | Trimethyl | 1.57 |
| 12 | 16.226 | Xylitol | 1.93 |
| 13 | 16.437 | d-Ribose | 1.21 |
| 14 | 16.895 | 1,4-Dioxane | 0.13 |
| 15 | 17.264 | 3,8-Dioxa-2,9-disiladecane | 0.13 |
| 16 | 17.794 | D-Arabinonic acid | 0.13 |
| 17 | 18.097 | Gulonic acid | 0.09 |
| 18 | 18.444 | D-Fructose | 0.46 |
| 19 | 18.581 | 2-Keto-d-gluconic acid | 0.32 |
| 20 | 18.929 | D-Fructose | 0.46 |
| 21 | 19.109 | 1-Triethylsilyloxydodecane | 0.12 |
| 22 | 19.553 | beta.-DL-Arabinopyranose | 0.15 |
| 23 | 20.242 | Trimethylsilyl ether of glucitol | 0.14 |
| 24 | 20.394 | D-Fructose | 7.46 |
| 25 | 20.587 | Trimethylsilyl ether of glucitol | 0.23 |
| 26 | 20.943 | D-Mannitol | 4.9 |
| 27 | 21.235 | D-Glucose | 4.13 |
| 28 | 21.595 | Ribitol | 0.54 |
| 29 | 22.76 | Threitol | 1.16 |
| 30 | 22.906 | .alpha.-D-Galactopyranose | 2.99 |
| 31 | 23.319 | n-Pentadecanoic acid | 5.67 |
| 32 | 23.591 | Tetracosanoic acid | 5.16 |
| 33 | 24.477 | Benzoic acid | 2.9 |
| 34 | 25.379 | 3,4,5-Trihydroxybenzoic acid ethy | 1.62 |
| 35 | 26.353 | n-Hexadecanoic acid | 4.67 |
| 36 | 27.748 | Eicosanoic acid | 4.13 |
| 37 | 28.221 | 1,3,2-Dioxaborinane | 0.65 |
| 38 | 28.744 | 3-Pyrrolidin-2-yl-propionic acid | 0.2 |
| 39 | 29.45 | 3-Hydroxy-5-(N-pyrrolidinomethyl) | 0.54 |
| 40 | 29.7 | 9-Octadecenamide, (Z)- | 0.2 |
| 41 | 30.309 | Octadecanoic acid | 3.54 |
| 42 | 30.733 | Pyrrolo[1,2-a]pyrazine-1,4-dione | 1.84 |
| 43 | 31.59 | 9-Octadecenamide | 1.3 |
| 44 | 31.856 | 7-n-Pentadecylaminomethyl | 1.02 |
| 45 | 32.309 | Pyrrolo[1,2-a]pyrazine-1,4-dione | 0.23 |
| 46 | 32.75 | Hexadecanamide | 0.03 |
| 47 | 33.196 | Pentadecanoic acid | 0.11 |
| 48 | 33.568 | alpha.-D-Glucopyranoside | 1.13 |
| 49 | 34.028 | Octadecanamide | 0.18 |
| 50 | 34.586 | D-Turanose | 0.72 |
| 51 | 38.63 | Bis(2-ethylhexyl) phthalate | 0.11 |
| 52 | 40.402 | 4-Pyrimidinecarboxylic acid | 0.16 |
| 53 | 41.051 | N-Acetyl-L-tyrosinamide | 3.1 |
| 54 | 41.83 | 3-Pyrrolidin-2-yl-propionic acid | 4.1 |
| 55 | 42.141 | 2-Hydroxy-4-phenyl-6-phenethylpyrimidine | 10 |
GCMS analysis from best bacterial antagonist Pseudomonas isolate no. 14 (JND-KSGn-30-L) inoculated onto N-agar was performed.
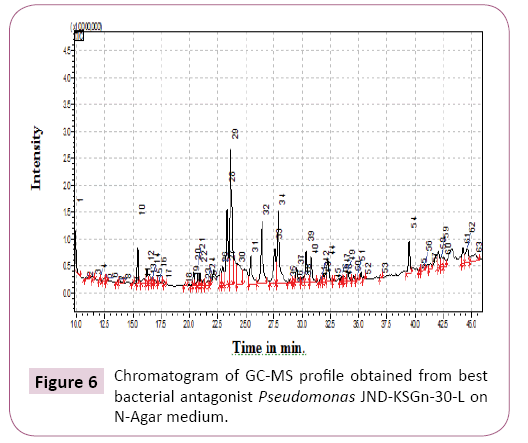
Total 60 compounds were identified in best bacterial antagonist Pseudomonas isolate no. 14 JND-KSGn-30-L) in N-agar media (Table 5 and Figure 6). The dominant compounds identified were Tetracosanoic acid (16.49%), n-Pentadecanoic acid (12.47%), n-Hexadecanoic acid (11.87%).
Table 5 GC-MS analysis of best bacterial antagonist Pseudomonas isolates no. 14 JND-KSGn-30-L on N-Agar medium.
| Peak No. | RT (Min) | Compound Name | Area % |
|---|---|---|---|
| 1 | 9.767 | Butanedioic acid | 2.72 |
| 2 | 10.675 | Butanoic acid | 0.14 |
| 3 | 11.375 | Butane | 0.26 |
| 4 | 11.942 | Propanoic acid | 0.03 |
| 5 | 12.242 | 2-Mono-isobutyrin | 0.18 |
| 6 | 12.575 | Trimethylsilyl ether of glycerol | 0.15 |
| 7 | 13.45 | D-Ribopyranose | 0.15 |
| 8 | 13.683 | 2-Deoxy ribose per-TMS II | 0.29 |
| 9 | 14.858 | Silane | 0.02 |
| 10 | 15.283 | Trimethyl(2,6 ditert.-butylphenoxy)silane | 1.97 |
| 11 | 15.708 | 10-Undecenoyl chloride | 0.67 |
| 12 | 16.1 | Ribitol | 1.06 |
| 13 | 16.333 | Butanal | 0.87 |
| 14 | 16.633 | Docosane | 0.23 |
| 15 | 16.8 | D-Erythrose | 0.46 |
| 16 | 17.175 | Butane | 0.51 |
| 17 | 17.708 | Mannonic acid | 0.12 |
| 18 | 19.458 | beta.-DL-Lyxopyranose | 0.11 |
| 19 | 20.058 | Trimethylsilyl ether of glucitol | 0.28 |
| 20 | 20.3 | D-Fructose | 0.83 |
| 21 | 20.625 | D-Fructose | 1.59 |
| 22 | 20.833 | D-Mannitol | 0.82 |
| 23 | 21.042 | Trimethylsilyl ether of glucitol | 0.73 |
| 24 | 21.367 | Ribitol | 0.67 |
| 25 | 21.725 | D-Ribo-Hexonic acid | 0.34 |
| 26 | 22.658 | D-Erythrose | 1.29 |
| 27 | 22.842 | Inositol | 1.55 |
| 28 | 23.1 | n-Pentadecanoic acid | 7.14 |
| 29 | 23.475 | Tetracosanoic acid | 16.49 |
| 30 | 24.175 | n-Pentadecanoic acid | 12.47 |
| 31 | 25.992 | n-Hexadecanoic acid | 11.87 |
| 32 | 27.117 | Octadecanoic acid | 4.1 |
| 33 | 27.667 | Eicosanoic acid | 9.89 |
| 34 | 28.683 | 3-Pyrrolidin-2-yl-propionic acid | 0.24 |
| 35 | 29.108 | Benzeneacetic acid | 0.01 |
| 36 | 29.308 | 3-Hydroxy-5-(N-pyrrolidinomethyl) | 1.56 |
| 37 | 29.867 | 9-Octadecenamide | 0.73 |
| 38 | 30.192 | Octadecanoic acid | 3.13 |
| 39 | 30.625 | Pyrrolo[1,2-a]pyrazine-1,4-dione | 2.58 |
| 40 | 31.425 | 9-Octadecenamide | 1 |
| 41 | 32.075 | 2-Acetamido-3-phenylpropionamide | 2.1 |
| 42 | 32.658 | Hexadecanamide | 0.07 |
| 43 | 33.317 | Pentadecanoic acid | 0.26 |
| 44 | 33.483 | alpha.-D-Glucopyranoside | 0.32 |
| 45 | 33.65 | Tetradecanamide | 0.34 |
| 46 | 33.892 | 9-Octadecenamide | 0.88 |
| 47 | 34.358 | Thymol-.beta.-d-glucopyranoside | 0.36 |
| 48 | 34.742 | Hexadecyl methanesulfonate | 0.15 |
| 49 | 35.308 | 9-Octadecenamide | 2.1 |
| 50 | 36.808 | Pyrrolidine | 0.2 |
| 51 | 39.208 | 1,2,4,4,6-Pentamethyl | 2.61 |
| 52 | 40.308 | 4-Pyrimidinecarboxylic acid | 0.13 |
| 53 | 40.483 | Squalene | 0.58 |
| 54 | 41.183 | Pyrrolo[1,2-a]pyrazine-1,4-dione | 0.75 |
| 55 | 41.933 | 2-Hydroxy-4-phenyl-6-phenethylpyrimidine | 1.85 |
| 56 | 42.208 | Oxazolidine | 1.34 |
| 57 | 42.483 | 13-Docosenamide | 1.1 |
| 58 | 44.083 | l-Leucine | 1.56 |
| 59 | 44.358 | 3,7,11,15-Tetramethylhexadeca- | 2.27 |
| 60 | 44.833 | 1,3-Dipalmitin trimethylsilyl ether | 1.97 |
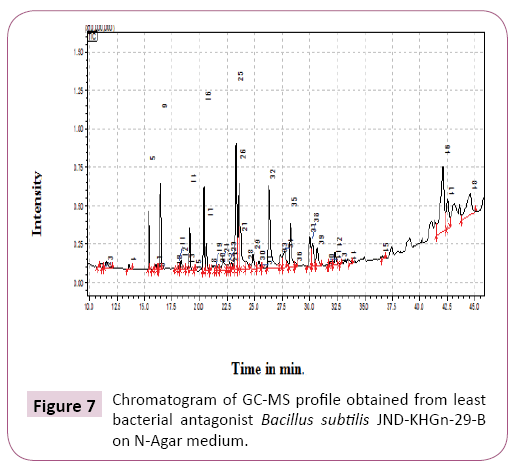
GCMS analysis from least bacterial antagonist Bacillus subtilis isolate no. 2 (JND-KHGn-29-B, Accession no. KU984481) inoculated onto N-agar medium. Total 42 compounds were identified in least bacterial antagonist Bacillus subtilis isolate no. 2 (JND-KHGn-29-B, Accession no. KU984481) in N-agar media (Table 6 and Figure 7). The main compounds identified were 2-Hydroxy-4-phenyl-6-phenethylpyrimidine (12.91%), Heptadecanoic acid (11.43%), Hexadecanoic acid (11.03%).
Table 6 GC-MS analysis of least bacterial antagonist Bacillus subtilis isolate no. 2 JND-KHGn-29-B on N-Agar medium.
| Peak No. | Retantion time (Min) | Compound Name | Area % |
|---|---|---|---|
| 1 | 10.756 | Butanoic acid | 0.02 |
| 2 | 11.224 | Benzeneacetic acid | 0.08 |
| 3 | 11.513 | Pentanoic acid | 0.84 |
| 4 | 13.573 | Malic acid | 0.3 |
| 5 | 15.394 | Trimethyl(2,6 ditert.-butylphenoxy)silane | 3.07 |
| 6 | 15.762 | 1-Dimethyl(chloromethyl)silyloxytridecane | 0.05 |
| 7 | 16.038 | Pentanedioic acid | 0.37 |
| 8 | 16.232 | Xylitol | 0.11 |
| 9 | 16.46 | d-Ribose | 5.55 |
| 10 | 17.796 | D-Ribofuranose | 0.08 |
| 11 | 18.126 | 1-Trimethylsilyloxytetradecane | 0.27 |
| 12 | 18.304 | 2-Propenoic acid | 0.7 |
| 13 | 18.951 | n-Tridecanoic acid | 0.24 |
| 14 | 19.117 | 1-Triethylsilyloxydodecane | 2.3 |
| 15 | 19.553 | alpha.-D-Xylopyranose | 0.03 |
| 16 | 20.626 | 1-Trimethylsilyloxypentadecane | 6.31 |
| 17 | 20.93 | Galactose oxime hexaTMS | 0.15 |
| 18 | 21.447 | Eicosane | |
| 19 | 21.735 | Silane | 0.65 |
| 20 | 22.123 | Tetradecanoic acid | 1.87 |
| 21 | 22.498 | .beta.-L-Galactopyranose | 0.44 |
| 22 | 22.756 | d-Erythrotetrofuranose | 0.69 |
| 23 | 22.891 | Mannonic acid | 0.54 |
| 24 | 23.315 | n-Pentadecanoic acid | 9.54 |
| 25 | 23.574 | Tetracosanoic acid | 6.92 |
| 26 | 23.716 | Myo-Inositol | 3.69 |
| 27 | 24.242 | n-Pentadecanoic acid | 1.23 |
| 28 | 24.857 | Pyrazine | 1.35 |
| 29 | 25.385 | Hexadecanoic acid | 0.78 |
| 30 | 25.617 | Tetrapentacontane | 0.16 |
| 31 | 27.354 | Heptadecanoic acid | 11.43 |
| 32 | 28.231 | 1,3,2-Dioxaborinane | 6.52 |
| 33 | 28.709 | Uric acid | |
| 34 | 30.012 | Octadecanoic acid | 5.35 |
| 35 | 30.666 | Pyrrolo[1,2-a]pyrazine-1 | 2 |
| 36 | 32.29 | Pyrrolo[1,2-a]pyrazine-1,4-dione | 1.35 |
| 37 | 32.76 | Hexadecanamide | 0.07 |
| 38 | 33.639 | 5,10-Diethoxy-2,3,7,8-tetrahydro-1H | 0.26 |
| 39 | 36.598 | Cyclopropanetetradecanoic acid | 0.25 |
| 40 | 42.096 | 2-Hydroxy-4-phenyl-6-phenethylpyrimidine | 12.91 |
| 41 | 42.542 | 2,2-Dimethylcyclopropanecarboxamide | 3.46 |
| 42 | 44.586 | Silane | 6.41 |
Comparative analysis
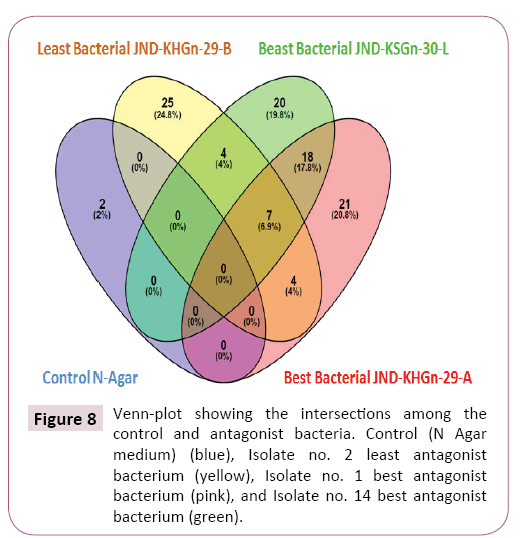
GC-MS analysis identified total 18 common bioactive compounds in best bacterial antagonists Pseudomonas isolate no. 14 JNDKSGn- 30-L and best bacterial antagonist Bacillus subtilis isolate no. 1 (JND-KHGn-29-A, Accession no. KU984480) viz. Butanedioic acid, Butane, Propanoic acid, 2-Mono-isobutyrin, Trimethylsilyl ether of glycerol, 2-Deoxy ribose per-TMS II, Ribitol, Butanal, r of glucitol, D-Fructose, D-Mannitol, n- Hexadecanoic acid, Eico sanoic acid, 3-Pyrrolidin-2-yl-propionic acid, 9-Octadecenamide, Pentadecanoic acid, Alpha.-D-Glucopyranoside, 4-Pyrimidinecarboxylic acid (Table 7).
Table 7 Number of total and unique compounds identified from GC-MS profiling.
| Treatment No | Treatment details | No of Total compounds | No of unique compounds |
|---|---|---|---|
| 1 | Control N Agar | 2 | 2 |
| 2 | Best Bacterial Isolate 1 (JND-KHGn-29-A, Accession no. KU984480) |
55 | 21 |
| 3 | Best Bacterial Isolate 14 (JND-KSGn-30-L, Accession no. not submitted) |
60 | 20 |
| 4 | Least Bacterial Isolate 2 (JND-KHGn-29-B, Accession no. KU984481) |
42 | 25 |
| Common | |||
| 5 | Isolate 1 Best and Isolate 14 Best | 18 | -- |
| 6 | Isolate 2 Least and Isolate 14 Best | 04 | -- |
| 7 | Isolate 2 Least" and "Isolate 1 Best | 04 | -- |
| 8 | Isolate 2 Least, Isolate 14 Best and Isolate 1 Best | 07 | -- |
Exclusively 20 bioactive compounds were included in best bacterial antagonist Pseudomonas isolate no. 14 JND-KSGn-30-L) viz -Ribopyranose, 10-Undecenoyl chloride, Docosane, D-Erythrose, beta.-DL-Lyxopyranose, D-Ribo-Hexonic acid, Inositol, 3-Hydroxy 5-(N-pyrrolidinomethyl), 2-Acetamido-3-phenylpropionamide, Tetradecanamide, Thymol-.beta.-d-glucopyranoside, Hexadecyl methanesulfonate, Pyrrolidine, 1,2,4,4,6-Pentamethyl, Squalene, Oxazolidine, 13-Docosenamide, l-Leucine, 3,7,11,15-Tetramethylhexadeca- 1,3-Dipalmitin trimethylsilyl ether (Table 7 and Figure 8).
Least bacterial antagonist Bacillus subtilis isolate no. 2 (JNDKHGn- 29-B, Accession no. KU984481) encompassed 25 bioactive compounds included exclusively in viz. Pentanoic acid, Malic acid,1-Dimethyl (chloromethyl) silyloxytri- decane, Pentanedioic acid, D-Ribofuranose, 1-Trimethylsilyloxytetradecane, 2-Propenoic acid, n-Tridecanoic acid, alpha.-MyoInositol,1 Galactose oximeexaTMS,Eicosane, Tetradecanoic acid, beta.- L-, d-Erythrotetrofuranose, Hexadecanoic acid, Tetrapentacontane, Heptadecanoic acid, Uric acid, Pyrrolo[1,2-a]pyrazine- 1, 5,10-Diethoxy-2,3,7,8-tetrahydro1H, Cyclopro-panet etradecanoic acid, 2,2Dimethylcyclopropan ecarboxami-de (Table 7 and Figure 8).
The best bacterial antagonist Bacillus subtilis isolate no. 1 (JNDKHGn- 29-A, Accession no. KU984480) included 21 bioactive compounds in viz. Heptasiloxane, hexadecamethyl, Erythrose per- TMS, Trimethyl, 1,4-Dioxane, 3,8-Dioxa-2,9-disiladecane, D-Arabinonic acid, Gulonic acid, 2-Keto-d-gluconic acid, beta.-DL-Arabinopyranose, D-Glucose, Threitol, .alpha.-D-Galactopyranose, Benzoic acid, 3,4,5-Trihydroxybenzoic acid ethy, 3-Hydroxy-5-(Npyrrolidinomethyl) isoxazole, 9-Octadecenamide, (Z)-, 7-n-Pentadecylaminomethyl, Octadecanamide, D-Turanose, Bis(2-ethylhexyl) phthalate, N-Acetyl-L-tyrosinamide (Table 7 and Figure 8).
Four common bioactive compounds were found in least bacterial antagonist Bacillus subtilis isolate no. 2 (JND-KHGn-29-B, Accession no. KU984481) and best bacterial antagonist Pseudomonas isolate no. 14 JND-KSGn-30-L) Viz. Butanoic acid, Benzeneacetic acid, Trimethyl(2,6 ditert.-butylphenoxy)silane, Mannonic acid Whereas, 7 common bioactive compounds in least bacterial antagonist Bacillus subtilis isolate no. 2 (JND-KHGn- 29-B, Accession no. KU984481) and best bacterial antagonist Pseudomonas isolate no. 14 JND-KSGn-30-L) and best bacterial antagonist Bacillus subtilis isolate no. 1 (JND-KHGn-29-A, Accession no. KU984480) Viz. Silane, n-Pentadecanoic acid, Tetracosanoic acid, Octadecanoic acid, Pyrrolo[1,2-a]pyrazine-1,4-dione Hexadecanamide, 2-Hydroxy-4-phenyl-6-phenethylpyrimidine and 4 common bioactive compounds in least bacterial antagonist Bacillus subtilis isolate no. 2 (JND-KHGn-29-B, Accession no. KU984481) and best bacterial antagonist Bacillus subtilis isolate no. 1 (JND-KHGn-29-A, Accessionno. KU984480) Viz. Xylitol, d- Ribose, 1-Triethylsilyloxydodecane, 1,3,2-Dioxabori-nane. Only 2 unique bioactive compounds were included y in Control N Agar medium Viz. 2,6,10,14,18,22-Tetracosahexaene, 2,2,4-Trimethyl- 3-(3,8,12,16-tetramethyl-heptad-eca-3,7,11,15-tetraenyl)-cyclohexanol (Table 7 and Figure 8).
Meyer et al. (2014) [17] studied efficient adaptation mechanisms in Bacillus subtilis by growing it in wide range of environmental challenges viz. with glucose alone or glucose with either malate, fumarate or citrate as carbon/energy sources and reported different extracellular metabolite profiles and regulated intracellular metabolite equilibrium after GC-MS analysis. Srikesavan and Selvam [18] identified some of the constituents in the Actinomycetes extract for elimination of tumor cell, antimicrobial activity, cytotoxic activity by to GC-MS analysis from selected best and least antagonistic actinomycets. Prasana et al. (2012) [19] reported 2 compounds (4-Hydroxy-2-methyl acetophenone and 2, 5-Dihydroxy propio phenone) out of 12 compounds, having both anticancer and vasodilator activity after GC-MS analysis of crude ACE Inhibitor.
References
- Kennedy IR, Choudary AIMA, Kecskes ML (2004) Non Symbiotic bacterial diazotrophs in a crop farming systems can their potential for plant growth promotion to be better exploited? Soil Biol Biochem 36: 1229-1244.
- Hayat R, Ali S, Siddique MT, Chatha TH (2008) Biological nitrogen fixation of summer legumes and their residual effects on subsequent rainfed wheat yield. Pakistan J Bot 40: 711-722.
- Hayat R, Ali S, Ijaz SS, Chatha TH, Siddique MT (2008) Estimation of N2-fixation of mung bean and mash bean through xylem uriedetechnique under rainfed conditions. Pakistan J Bot 40:723-734.
- Pidello A (2003) The effect of Pseudomonas fluorescens strains varying in pyoverdine production on the soil redox status. Plant Soil 253: 373-379.
- Owen A, Zlor R (2001) Effect of cyanogenic rhizobacteria on the growth of velvetleaf (Abutilon theophrasti) and Corn (Zea mays) in autoclaved soil and the influence of supplemented glycine. Soil Biochem 33: 801-809.
- Aneja KR (2003) Experiments in microbiology plant pathology and biotechnology 4th ed New Age Int p 607.
- Alemu F (2013) Isolation of pseudomonas fluorescens from rhizospheric soil of faba bean and assessment of their Phosphate solubility: in vitro study. Ethiopia Sch Acad J Biosci 1: 346-351.
- Reddy BP, Reddy KRN, Rao MS, Rao KS (2008) Efficacy of antimicrobial metabolites of pseudomonas fluorescens against rice fungal pathogens. Current Trends Biotechnol Pharm 2: 178-182.
- Zarrin F, Saleemi M, Zia M, Sultan T, Aslam M, et al. (2009) Antifungal activity of plant growth-promoting rhizobacteria isolates against Rhizoctonia solani in wheat. Afri J of Biotech 8: 219-225.
- Joel EL, Bimbha BV (2012) Fungi from mangrove plants: their antimicrobial and anticancer potential. Int J Pharm Pharm sci 43: 139-142.
- Koek MM, Jellema RH, van der Greef J, Tas AC, Hankemeier T (2011) Quantitative metabolomics based on gas chromatography mass spectrometry: status and perspectives. Metabol 7: 307-328.
- Koek MM, Jellema RH, van der Greef J, Tas AC, Hankemeier T (2011) Quantitative metabolomics based on gas chromatography mass spectrometry: status and perspectives. Metabol 7: 307-328.
- Nicholson JK, Lindon JC, Holmes E (1999) Metabonomics: understanding the metabolic responses of living systems to pathophysiological stimuli via multivariate statistical analysis of biological NMR spectroscopic data. Xenobiot 29: 1181-1189.
- Tian J, Sang P, Gao P (2009) Optimization of a GC–MS metabolic fingerprint method and its application in characterizing engineered bacterial metabolic shift. J Sep Sci 32: 2281-2288.
- Borner J, Buchinger S, Schomburg D (2007) A high-throughput method for microbial metabolome analysis using gas chromatography/mass spectrometry. Anal Biochem 367: 143-151.
- Koek MM, Muilwijk B, van der Werf MJ, Hankemeier T (2006) Microbial metabolomics with gas chromatography/mass spectrometry. Anal Chem 78: 1272-1281.
- Meyer H, Liebeke M, Lalk M (2014) A protocol for the investigation of the intracellular Staphylococcus aureus metabolome. Anal Biochem 401: 250-259.
- Sudha S, selvam Masilamani M (2012) Actinomycetes from marine sediment screening for cytotoxicity identification and analysis of bioactive constituents by GCMS ICBBHS. 32-45.
- Prasanna R, Rana A, Chaudhary V, Joshi M, Nain L (2012) Cyanobacteria-PGPR interactions for effective nutrient and pest management strategies in agriculture. In: Satyanarayana T, Johri BN and Prakash A (editors). Microorganisms in sustainable agriculture and biotechnology 173-195. Dordrecht: Springer.
Open Access Journals
- Aquaculture & Veterinary Science
- Chemistry & Chemical Sciences
- Clinical Sciences
- Engineering
- General Science
- Genetics & Molecular Biology
- Health Care & Nursing
- Immunology & Microbiology
- Materials Science
- Mathematics & Physics
- Medical Sciences
- Neurology & Psychiatry
- Oncology & Cancer Science
- Pharmaceutical Sciences
