ISSN : 2349-3917
American Journal of Computer Science and Information Technology
Analysis of Feasibility of Measuring Distance through Layer Two TTL Value
Joshua Williams*
Department of Technology Management, University of Cincinnati, Ohio, USA
- *Corresponding Author:
- Joshua Williams
University of Cincinnati
Ohio, USA
Tel: 551932355611
E-mail: joshua.williams496@gmail.com
Received Date: August 14, 2020; Accepted Date: August 28, 2020; Published Date: September 04, 2020
Citation: Williams J (2020) Analysis of Feasibility of Measuring Distance Through Layer Two TTL Value. Am J ComptSci Inform Technol Vol.8 No.3:56
Abstract
This research involves examining the feasibility of finding nautical miles from Layer 2 of the OSI model for the purpose of supplying additional evidence on criminal cybersecurity attacks. The TTL (Time To Live) value from the IP packet was selected for the feasibility of this measurement due to the constant decremental value of the number from the packet that was sent.
Keywords
Cybersecurity; Information Technology; TTL
Introduction
The advent of the digital age has also brought digital concerns to governments, companies, and individuals alike. These concerns can be equated to monetary cost has that has been or would be taken from the income of these groups [1-4]. The IC3 report of 2019 reported losses of $10.2 billion dollars (2020, IC3) from 2015 to 2019. This number shows an increasing trend as time passes. This leads us to believe that the issue will not be going away in the near future but will only increase. An increase in the cost of funds stolen or lost is widely accepted as having an impact on the economy, as that money could be spent elsewhere [5-8]. The total loss reported from the top 13 of the G-20 countries is $1.9 trillion dollars or 4.4 percent of the combined GDP in 2012 [9-11].
One of the problems that lead to this growing trend is that the prosecution of individuals that commit digital crimes is a difficult task. Evidence is often circumstantial, and a lot of items can be spoofed when it comes to digital traffic. With this being the case, more evidence is always better as it can reinforce the evidence that has already been obtained and can be used by itself. Internet crimes are often presented as a puzzle that has to be pieced together by a digital forensic specialist. The more pieces that can be used will present a stronger case. This includes the source that an attack may have come from.
Research Question
Given the problem faced, we had to narrow our research question to a specific item. My work was guided by this overarching question that narrowed the research to a particular problem and a specific item to examine for the measurement base. To understand this better, this led to the current question.
(RQ) “Can the distance in terms of nautical miles from the source of a packet to the destination be determined by tracking the Time to Live of a packet?”
Related Work
Two of the current routing algorithms that are used today are Open Shortest Path First (OSPF) and Routing Information Protocol (RIP). Based on the algorithm, both protocols look at distance, in order, to determine the routing of information. This distance is a logical distance, however, and does not translate to the physical world. Each route looks for the shortest logical patch to take in order to get to the end destination for a packet. These determine the number of hops that the packet will take, and each hop reduces the TTL of a packet.
The research paper “Measurements on Delay and HOP-Count of the internet” looked at the delay in milliseconds across regions through different countries and regions within the U.S. They measured hops and the delay that was associated with each hop. It was determined the country's infrastructure greatly affected the delay of traffic and well as hop count. The U.S., for example, ranged anywhere from 5 to 24 hops for traffic to pass with a standard delay of 85.6ms. These numbers vary across regions and countries. The total test base was over 3,000 hosts giving a wide view of speeds and hops across the globe.
Distance metrics in the internet
Round Trip Times (RTT) are determined through active measurements over time by calculating the hops, latency, and physical distance. This is used to build maps for tracking the typical RTT. This information is issued to determine placements for servers and to reduce latency for selected services. Physical distance was determined to play an essential role in factoring latency. This research shows that hops play a role in factoring distance. Though this is done with the active measuring of known factors such as the latency and known physical distance, this database could be used to help build a hop base network for mapping to assist in determining the distance base off of hops alone or with using known-source IP.
Another form that has larger research on direct mapping of the internet is the mapping of the internet or the Distance Hypothesis. This research focuses more on mapping of the internet in general as compared to a direct correlation to the distance from one point to another. In most cases, several factors were used — all known, of course — in an effort to map theinternet. Determining physical distance has several challenges that are attached with it. The research paper “Mapping the Internet using GIS: The death of distance hypothesis revisited” says it this way.
“Our statistical results also show that distance affects Internet access. From statistical analysis, we found distance does have an impact on web site access time when the web site is within 1000 kilometers. When hosts are located at an international scale (>3500 km), Internet host access time primarily depends on Internet infrastructure and interconnections, like domain nameservers, network access points, backbones, and link speed” [10].
As you can see this issue holds several obstacles to overcome. Adding more to the equation in effort to reach the end goal however, I believe, is counterproductive. The list of factors mentioned by Wang et al. [10] just goes to show that a more simplistic approach to the problem at hand needs to be addressed; one that does not factor a large amount of variables but is more static in nature [12,13].
Method
To get a base understanding of the relationship between distance and the TTL number, we decided to conduct a test in which 1,000 pings were sent to a known location in the United States. One location was chosen from each of the 50 states within America, with a total packet count of 100,000. Only 50,000 of those packets were used for the testing. This is because the return packet is the only one that needed to be counted, as the value of the TTL in the packet that was sent could not be recorded in this test.
To select the target IPs, a University or related place was chosen in each state to use as the target destination. By looking up the University and using the publicly available data based of owned IPs, I was able to determine the exact IP or the range of IPs that the University-owned. db-ip.com and ipinfo.io were both used to determine the ownership of an IP. Each IP was then tested using the ping command in Windows to determine if a response could be received. For the Universities with IP ranges listed instead of an exact IP, I wrote a script that tests the IP range looking for an active IP that was not blocked and could return an ICMP packet containing the data I needed. Some Universities I was unable to obtain an active return from with a TTL value. For these few cases, I chose a random IP from the same database that also listed the location that IP was from for that state.
To create the pings and record the data, a simple PowerShell script was written that used Nmap to produce the pings. The script sent and recorded all data to a text file that could be parsed later. In addition, the traffic was recorded in a pcap file using Wireshark from the computer that sent the packets to the remote host. This allowed for accurate recording of the data in two different methods that could then be compared and recorded. Using this method, I was able to complete my results for the TTL for each location. Finally, to determine the distance for each location, I used Google maps from the source location to the target location. This was another reason the Universities were chosen, as the locations are known for each University, allowing for a more precise record of the distance. The few locations that a town was used resulted in a slightly less accurate method of the draft the distance from the source location to the target town center. These cases were dramatically smaller as most locations were able to be determined.
As a final measure of protection, I conducted NSLookups of the address to ensure the IPs were not being hosted by a third-party vendor, such as AWS or another service.
Results and Discussion
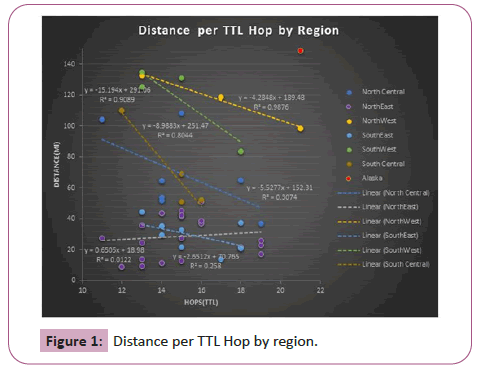
The time to live value in relation to distance did vary widely, with 346 miles per hop being the greatest distance and 9 miles being the lowest distance. This led to an average of 59.2 miles per hop for the geographical United States of America from one source location. By using that average distance, it was determined that the average distance of error was 570.6 miles. By removing the non-mainland states, Alaska and Hawaii, from the data, the average was able to be even further refined. This led to a new 49.2 miles per HOP, thus shaving 10 miles off the average. This gave a new distance error of 399.5 miles. This large distance of error led to further breaking down the information by smaller geographical areas to determine the average results from those. This provided better results by breaking down the states into regions and calculating the distance per hop by region, as demonstrated in Figure 1.
The geographic regions did provide better results and allowed for a more targeted region. Each region was then calculated by itself to determine the numbers. A total of six regions were used for the purpose of the breakdown.
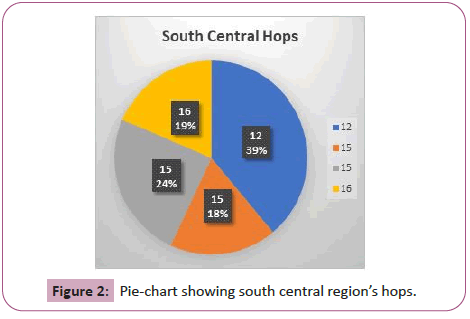
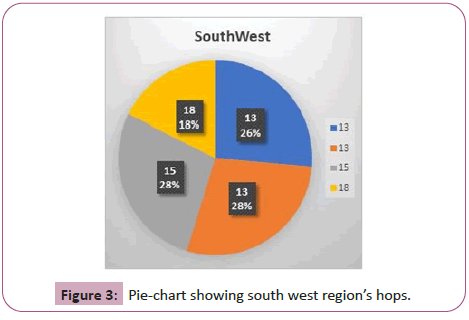
South Central region’s hops ranged from 12 to 15, with an average hop of 14.5. The distance average was 70.7 miles. This provided an average error distance of 271 miles. The majority of this region had 15 hops, and those that had a 12 hop had theSouth West region’s hops was an average of 14.75, with an average distance of 118.9 miles per hop. This resulted in a 277.7 mile average on error distance. The majority of the hops for this was region was 13. The 13 hop had a distance of 135 miles per hop is shown in Figure 2.
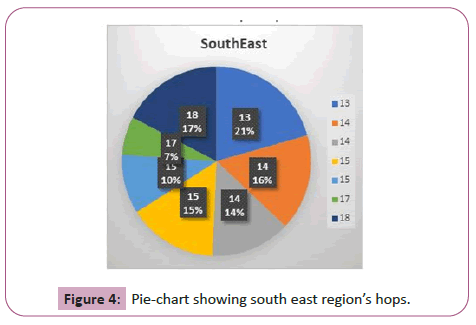
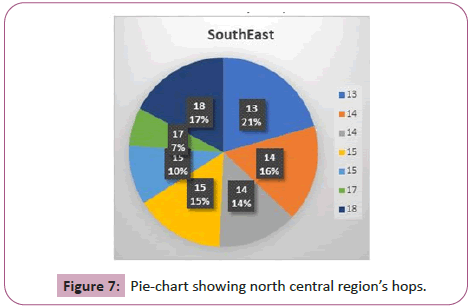
The South East region’s hops were an average of 15.5 with an average distance of 29.7 miles per hop. This resulted in a 126 mile average on error distance. The majority of the hops for this was region was tied with 14 and 15. A 13 tied hop took the most distance: 44 miles per hopis shown in Figure 3.
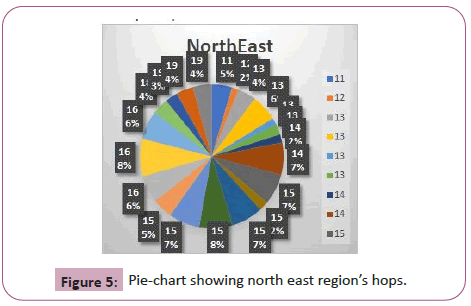
The North East region’s hops were an average of 15 with an average distance of 29.8 miles per hop. This resulted in a 171 mile average on error distance. The majority of the hops for this was region was 15. A 15 hop took the most distance: 45 miles per hopis shown in Figure 4.
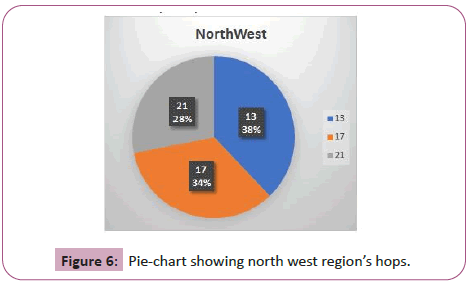
The North West region’s hops were an average of 12 with an average distance of 116.6 miles per hop. This resulted in a 209.8 mile average on error distance. The majority of the hops for this was region was split even with only three ocations tested. A 35 hop took the most distance distance: 132 miles per hopis shown in Figure 5.
The North Central region’s hops were an average of 15 with an average distance of 69.4 miles per hop. This resulted in a 212.7 mile average on error distance. The majority of the hops for this was region was 14. An 11 hop took the most distance: 104 miles per hopis shown in Figures 6 and 7.
Conclusion
The data retrieved shows that it makes it difficult to determine the distance by using the TTL alone in a calculation. The narrowest margin of error was 126 miles. This leaves a wide area from the target location that an attack could have originated from. However, this still does not rule out potential uses. This research demonstrates that specific research needs to be conducted in the future. In addition, the TTL was never meant to be used as the sole source of information but rather to be an addition to evidence- based gathering in cybersecurity. This has been confirmed that this is possible from the TTL packet distance calculation. Though at this point, it is stilllimited by geographic region rather than a narrow scope of a few miles.
Further research needs to be completed with more data being generated from different sources and compiled with a more extensive list of target IPs and locations. A broader sized scope of research will be valuable. This will, in turn, provide more accurate information. This research has shown that using the TTL in some form is possible and thus has achieved its goal of determining the feasibility of the distance from a TTL value.
References
- Baldessari R, Festag A, Matos A, Santos J, Aguiar R (2006) Flexible connectivity management in vehicular communication networks. In: Proceedings of International Workshop on Intelligent Transportation. Alemania.
- Cybercrime against Businesses (2008) Bureau of Justice Statistics.
- Internet Crime Complaint Center (2019) 2019 Internet Crime Report. Federal Bureau of Investigation.
- Fei A, Pei G, Liu R, Zhang L (1998) Measurements on delay and hop-count of the internet. In: IEEE GLOBECOM’98-Internet Mini-Conference.
- Huffaker B, Fomenkov M, Plummer DJ, Moore D, Claffy K (2002) Distance metrics in the internet. In: Proc. of IEEE International Telecommunications Symposium (ITS).
- Semeria C, Maufer T (1997) Introduction to IP multicast routing. 3COM White Paper.
- Steenbergen RA (2009) A practical guide to (correctly) troubleshooting with traceroute. North American Network Operators Group: 1-49.
- Chen Q, Kanhere SS, Hassan M (2013) Performance analysis of geography‐limited broadcasting in multihop wireless networks. Wireless Commun Mobile Comput 13:1406-1421.
- Straka K, Manes G (2006) Passive detection of nat routers and client counting. In: IFIP International Conference on Digital Forensics: 239-246.
- Wang Y, Lai P, Sui D (2003) Mapping the Internet using GIS: The death of distance hypothesis revisited. J Geograph Syst 5:381-405.
- Dean D, DiGrande S, Field D, Lundmark A, O’Day J (2012) The Internet economy in the G-20. The Boston.
- IP Geolocation API and Database (2020).
- The Trusted Source for IP Address Data (2020).

Open Access Journals
- Aquaculture & Veterinary Science
- Chemistry & Chemical Sciences
- Clinical Sciences
- Engineering
- General Science
- Genetics & Molecular Biology
- Health Care & Nursing
- Immunology & Microbiology
- Materials Science
- Mathematics & Physics
- Medical Sciences
- Neurology & Psychiatry
- Oncology & Cancer Science
- Pharmaceutical Sciences
