ISSN : ISSN: 2576-1412
Journal of Applied Microbiology and Biochemistry
A Comparative Study of Estimation of Urinary Protein by Turbidimetric Methods vs. Pyrogallol Red Molybdate Method
Harmanjot kaur1, Gitanjali Goyal1* and Jagroop Singh2
1Department of Biochemistry, GGS Medical College Faridkot, Punjab, India
2Department of Biochemistry, Viral Research Diagnostic Laboratory, Government Medical College Amritsar, Punjab, India
- *Corresponding Author:
- Gitanjali Goyal
Department of Biochemistry, Viral Research Diagnostic Laboratory,
Government Medical College Amritsar, Punjab,
India,
Tel: 09877168233;
E-mail: jagroopsidhu55@gmail.com
Received: February 18, 2022, Manuscript No. IPJAMB-22-11475; Editor assigned: February 21, 2022, PreQC No. IPJAMB-22-11475 (PQ); Reviewed: March 07, 2022, QC No. IPJAMB-22-11475; Revised: March 11, 2022, Manuscript No. IPJAMB-22-11475 (R); Published: March 18, 2022, Invoice No. IPJAMB-22-11475
Citation: Singh J, Goyal G, kaur H (2022) A comparative study of estimation of urinary protein by Turbidimetric methods vs pyrogallol red molybdate method. Appl Biochem Microbiol Vol:6 No:1
Abstract
Background: The Concentration of total proteins in urine is a good index of renal function, but its determination is found to be unreliable. The Pyrogallol Red Molybdate (PRM) method for urine total proteins is being widely used in most of hospitals because of its high sensitivity, better precision and its practicability.
Material and methods: The cross sectional study was conducted in department of biochemistry in the collaboration with department medicine in Guru Gobind Singh Medical College and Hospital, Faridkot. Out of 60 patients, 31 were males and 29 were females.
Result: A statistically significant correlation was found between Pyrogallol red molybdate with Turbidimetric methods was highly significant with p value of ≤0.0001 and r value of 0.68, 0.86, 0.97 respectively.
Conclusion: From this study, it was concluded that turbidimetric methods are correlated with pyrogallol red molybdate but there is significant difference in mean. So, pyrogallol red molybdate is method of choice for detecting proteinuria.
Keywords
Rat; Total body irradiation; Tumorigenesis; Ratio of tumor mass to lactate; LDH
Introduction
Proteins are large size molecules (macromolecules), polymers of structural units called amino acids. Depending on the amino acid sequence (different amino acids have different biochemical properties) and interactions with their environment, proteins fold into a three-dimensional structure, which allows them to interact with other proteins and molecules and perform their function. The chemical properties of the amino acid determine the biological activity of the protein [1].
Proteinuria is a condition in which urine contains an excess amount of proteins. Normal adults excrete less than 150 to 200 mg/day of protein in the urine [2]. Very little of this protein is albumin (less than 10-20 mg/day). Albumin excretion in the range of 30 to 300 mg/day or 30 to 300 mg/g of urinary creatinine, is referred to as microalbuminuria. At these levels, standard dipsticks do not detect albumin in the urine, and specific measurement of albumin using highly albumin-sensitive techniques is required.
The terms "proteinuria" and "albuminuria" are often used synonymously in the medical literature. This is generally acceptable, since in general the most abundant urinary protein in patients with renal disease is albumin
Pathophysiologic mechanisms that underlie increased urinary protein excretion overflow" proteinuria.
High blood levels of positively charged small molecular weight light chains escape glomerular charge and size barriers and overwhelm tubular capacity to reabsorb and catabolize them [3].
Glomerular proteinuria: Selective- loss of only the glomerular charge-barrier, albumin excreted predominantly. Non-selectiveloss of both the charge and size-barrier with excretion of albumin and larger molecular weight proteins (such as IgG) [4].
Tubular proteinuria: Albumin and larger proteins restricted by intact glomerular barriers. Small molecular weight proteins normally freely filtered at the glomerulus (such as 3-2 microglobulin) escape reabsorption/catabolism because of renal tubular damage [5].
Postural proteinuria: Abnormal protein excretion in the upright posture, with normal urinary protein excretion in recumbency, probably due to exaggerated systemic and glomerular hemodynamic responses in the upright posture [6].
Classi ication of proteinuria based on quantity of protein excreted:
Normoalbuminuria/normal urinary protein- Less than 200 mg/dl of total protein with less than 10-20 mg of albumin/day (random urine protein/urine creatinine ratio <0.2).
Microalbuminuria- Albumin excretion of 30-300 mg/day or 30-300 mg/g of urinary creatinine or >20 meg/minute. Microalbuminuria is caused by glomerular capillary injury and so may serve as a marker for diffuse endothelial dysfunction [7]. The appearance of microalbuminuria (incipient nephropathy) in type I diabetes mellitus is an important predictor of progression to overt proteinuria (> 300 mg/dl) or overt nephropathy [8]. The prevalence of microalbuminuria increases to 50-60 % after 20-30 years duration of diabetes [9].
Overt proteinuria subnephrotic range: Albumin excretion of >300 mg/day or >300 mg/g of urinary creatinine or >200 mcg/ minute. Total daily protein excretion >300 mg and <3.5 g (random urine protein/urine creatinine ratio >0.2-<3.5). Dipstick positive for proteinuria.
Nephrotic range proteinuria: Excretion of >3.5 g/day of protein (random urine protein/urine creatinine Persistent proteinuria of more than 1.0 gm/day in any adult is not only suggestive of the existence of renal disease but also an increased risk of myocardial infarction and stroke[10]. Current methods for measuring proteinuria vary significantly. Commonly used methods are dipstick urine analysis, 24 hours urine protein estimation and spot urine protein creatinine ratio. The most common method used for the quantification of proteinuria is estimation of 24 hours urinary protein in a urine specimen collected over 24 hours. However, 24 hours urinary protein estimation method has certain pitfalls and thus leads to discarding of nearly 1/3rd of the samples. To obviate these difficulties short timed urine collection has been advocated with the hypothesis that protein excretion is nearly constant throughout the day.
Methods of detecting and measuring proteinuria
Detection of Proteinuria
1. Dipstick analysis
2. Precipitation methods
Quantification of Proteinuria
1. Biuret method-Copper regent-Tsuchiya reagent-Fowlin- Lowry
2. Turbidimetric method-Sulfosalicylic acid-Benzethonium chloride-Trichloroacetic acid- Sulfosalicyclic acid with sodium sulphate
3. Dye binding technique-Pyrogallol red-Coomassie brilliant blue-Ponceau S
4. Radio Immuno Assay (RIA)
5. Enzyme linked Immunosorbent Assay (ELISA)
6. Protein Creatinine ratio
Characterization of Proteinuria
1. Immuno electrophoresis
2. Column gel chromatography
3. Agarose gel electrophoresis
4. Polyacrylamide gel electrophoresis
5. Isoelectric Focussing
Detection of proteinuria
Dipstick method: It is used in most out-patient settings to detect proteinuria. It is a semi quantitative method of measuring the urine protein concentration. Paper strip is impregnated with indicator dye like bromocresol green which changes color in presence of protein. With increasing concentrations of protein in urine the dye indicators undergo sequential color changes from pale green to green and blue. In the absence of protein the dipstick panel is yellow. The results are expressed on a scale from 0 to +++ or ++++, each of which correspond to increasing approximate protein concentrations. They preferentially detect negatively charged urinary proteins- Albumin. However albumin levels between 30-300mg/dl are not detected [11]. Light chains and some low molecular weight protein are also not detected by stick tests.
Precipitation method
Kjeldahl method: This precipitation method measures protein by measurement of precipitated Nitrogen. Detection limit is 10-20ng/l.
Quantification of proteinuria
Biuret Method: This method is based on the interaction between copper ions and the carbamide group of proteins .This requires precipitation of protein, by using copper or Tsuchiya reagents. The protein in the urine must be concentrated before the biuret reaction and Tsuchiya reagent (ethanolic hydrochloride phosphotungstic acid) is the best precipitating compound. Its detection limit is 50 mg/l [12]. A modification of the biuret method, which is now the reference method recommended by the American Association for Clinical Chemistry, utilizes gel filtration to exclude small interfering compounds [13].
Turbidimetric method: The addition of Trichloroacetic Acid (TCA) or Sulfosalicylic Acid (SSA) alters colloid properties of protein and produces turbidity to be read in a densitometer. Benzethonium can also be used instead of sulfosalicylic acid. Its detection limit is 50-100 mg/l. The advantage of this easily performed test is its greater sensitivity for Bence Jones Proteins (BJP). Lack of precision and variance in the reading for albumin and globulin limit the use of this method. Few milliliters of freshly voided, centrifuged urine is added to an equal amount of 3 % SSA. Turbidity will result from protein concentration as low as 4mg/dl to be read in densitometer. False positive results can occur when a patient is taking sulfonamides or penicillin and within 3 days of administration of radiographic dyes [14]. A false negative result occurs with highly buffered alkaline urine or dilute specimen of urine.
Dye binding technique: This is most widely used technique for quantification of urinary proteins[15]. These are based on the interaction between proteins and a dye, which causes a shift in the absorption maxima (measured photometrically) of the dye.
They are reliable, accurate and easy way for assessing proteinuria. Commonly used dyes are pyrogallol red, Coomassie brilliant blue and Ponceau S. Pyrogallol red dye is the most commonly used dye for dye binding technique. Pyrogallol red combines with sodium molybdate to form a red complex. Proteins, in an acidic medium combine with this red complex and form a bluish purple colored complex. The intensity of the color formed is directly proportional to amount of proteins present.
Acidic medium Proteins + Pyrogallol red + Molybdate Bluish purple coloured complex
Material and Methods
The Study was conducted in Department of Biochemistry in the collaboration with Department of Medicine of Guru Gobind Singh Medical College and hospital, Faridkot. Ethical clearance was taken from institutional ethical committee. Proper informed consent was taken from all the participitants. Out of 60 patients, 31 were males and 29 were females. They was subjected to detailed history and examination, biochemical and special testing according to the pretested performa.
Sample collection and processing: The urine was collected in the morning because the first morning urination is more concentrated and yield the best results. Collected urine was stored in a clean, dry container and labeled properly.
Transport and Storage: The containers used during transportation were tightly closed to prevent leakage of the contents during transportation integrity of the specimen identification and condition from the time of specimen submission to analysis was ensured in laboratory. For example, if the specimen were refrigerated, the laboratory ensured that the refrigerator is properly maintained and that delays in specimen delivery do not compromise specimen integrity.
Preservatives: For specimens not analyzed within two hours of collection, then preservation of the urine specimen using a specifically designed chemical preservative or media transport device was done.
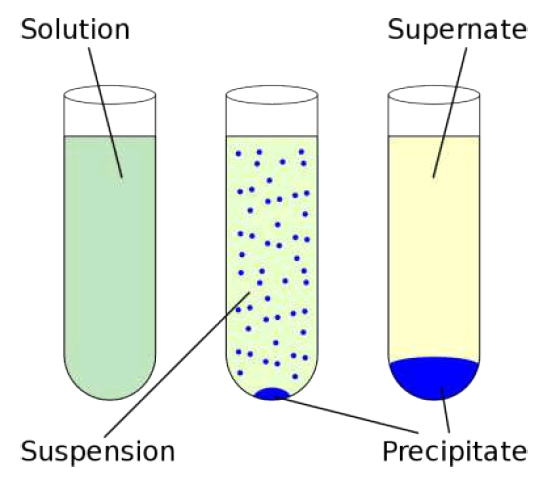
Turbidimetric methods: The total proteins present in urine were measured by precipitating.
Precipitation of proteins: Protein precipitation can be caused by the differential solubility between a protein-rich soluble phase and a solid chemical precipitant. Soluble proteins can be insolubilized by interaction with a suitable precipitant that decreases the protein’s attraction to the solvent and increases the proteins attraction to other protein molecules, resulting in protein accumulation and eventually precipitation [16].
Turbidity: Turbidity of a heated globular protein sample depends on the aggregation of heat-denatured protein molecules. By control of the heating conditions, particularly pH and ionic strength, soluble linear aggregates of denatured molecules can be formed [17].
Sulfosalicylic Acid (SSA)
Sulfosalicylic acid with Sodium Sulphate (SSSS)
Trichloroacetic Acid (TCA)
Pyrogallol Red Molybdate (PRM) Sulfosalicylic
acid method
Principle: Based on the precipitation of urine protein by strong acid, i.e. sulfosalicylic acid [18].
Trichloroacetic acid method
Principle: Tricholroacetic acid is a method available for concentrating diluted protein solution and simultaneously removing the interfering substances .TCA is based on precipitation of proteins by acids. Denaturation of proteins is there. The turbid solution formed is measured spectrophotometerically at 660 nm [19].
Sulfosalicylic acid with sodium sulphate method
It is not influenced by albumin-globulin ratio to be better than SSA and TCA methods. The SSA method is affected by the albumin-globulin ratio.In a series of solutions having an equal concentration of total proteins but with increasing concentration of albumin there is an increase in protein concentration by SSA method, where as a minor change observed with SSSS and TCA methods.SSSS method had a good precision in comparison with SSA, TCA and PRM.
Pyrogallol red molybdate method
Principle: Proteins react in acid solution with pyrogallol red and molybdate to form a colored complex the intensity of color formed is proportional to the protein concentration in the sample [20].
Results
The study was carried out in the Department of Biochemistry in Guru Gobind Singh Medical College & Hospital, Faridkot with an objective to compare the urinary protein estimated by turbidimetric methods and pyrogallol red molybdate method. Showed about the male to female ratio 1:0.9. Out of the total study population 31 were males and 29 were females.
Table 1 showing the age distribution of patients with Mean ± SD age of 44.46 ± 14.04 years and range 18-65 years. Maximum numbers (33%) of patients were from the age group of 42-53 years followed by (30%) in the age group of 18-29 years.
| AGE | MALE | FEMALE | TOTAL(N) | PERCENTAGE |
|---|---|---|---|---|
| 18-29 | 11 | 07 | 18 | 30.0 |
| 30-41 | 08 | 06 | 14 | 23.0 |
| 42-53 | 07 | 13 | 20 | 33.0 |
| 54-65 | 05 | 03 | 08 | 13.0 |
| TOTAL | 31 | 29 | 60 | 100.0 |
Table 1: Showing age and sex distribution of patients.
Table 2 and 3 shows the mean values and range of various biochemical parameters. The Mean ± SD of Blood glucose was 233.1 ± 88.9 mg/dl with range of 108-566 mg/dl, Blood Urea was 53.2 ± 40.9 mg/dl with the range of 12-265 mg/dl and the Mean ± SD of Serum Creatinine was 1.6 ± 1.5 mg/dl with the range of 0.30-6.80 mg/dl, Mean ± SD of Sodium was 136.6±4.3 meq/l with the range of 125-149 meq/l, Mean ± SD of Serum Potassium was 4.1 ± 0.7 meq/l with the range of 3-6.2 meq/l, Mean ± SD of Serum Chloride was 99.0 ± 4.4 meq/l with the range of 85-109 meq/l.
| Biochemical Parameters | Mean±SD | Range | Acceptable Normal Range |
|---|---|---|---|
| Blood Glucose(mg/dl) | 233.1±88.9 | 108-566 | 70-110 |
| Blood Urea(mg/dl) | 53.2±40.9 | 12-265 | 15-45 |
| Serum Creatinine(mg/dl) | 1.6±1.5 | 0.30-6.80 | 0.8-1.3 |
| Sodium(meq/l) | 136.6±4.3 | 125-149 | 135-145 |
| Potassium(meq/l) | 4.1±0.7 | 3-6.2 | 3.5-5.5 |
| Chloride(meq/l) | 99.0±4.4 | 85-109 | 98-107 |
Table 2: Mean ± sd value of various routine biochemical parameters in patients.
| Biochemical parameters | Mean±SD | Range |
|---|---|---|
| Sulfosalicyclic acid(mg/dl) | 46±41.2 | 1.30-171 |
| Sulfosalicyclic acid with sodium sulphate(mg/dl) |
65.7±50.4 | 3.70-185 |
| Trichloroacetic acid(mg/dl) | 101±76.5 | 10-210 |
| Pyrogallol red molybdate(mg/dl) |
144.3±102.4 | 15-250 |
Table 3: Mean ± sd of urinary proteins by turbidimetric methods and pyrogallol red molybdate.
Table 4 shows the mean difference between sulfosalicyclic acid with all the other methods. The mean difference was significant with SSSS(P ≤0.05), while it was highly significant with both other methods i.e. TCA and PRM (P≤0.0001).
| sulfosali -cyclic acid |
Methods | t value | Mean difference | 95% confidence interval |
p value | Sig. |
|---|---|---|---|---|---|---|
| Sulfosalicyclic acid with sodium sulphate |
2.308 | 19.40 | 2.75-36.0 | ≤0.05 | S | |
| Trichloroacetic acid |
4.867 | 54.64 | 32.4-76.8 | ≤0.000 1 |
HS | |
| Pyrogallol red molybdate |
6.875 | 97.99 | 69.7-126.2 | ≤0.000 1 |
Table 4: Mean difference between sulfosalicyclic acid (ssa) with sulfosalicyclic acid with sodium sulphate(ssss),trichloroacetic acid (tca), pyrogallol red molybdate(prm).
Table 5 shows the mean difference between sulfosalicyclic acid with sodium sulphate with SSA, TCA, PRM. The mean difference was significant with SSA (P ≤ 0.05), while it was highly significant with both other methods i.e. TCA and PRM (P ≤ 0.005), (P ≤ 0.0001) respectively (Figure 1, 2 and 3).
| sulfosalic yclic acid with sodium sulphate | Methods | t value | Mean diffrence | 95% confidence interval |
P value | Sig. |
|---|---|---|---|---|---|---|
| Sulfosalicyclic acid |
-2.30 | -19.40 | -36.0-(-2.7) | ≤0.05 | S | |
| Trichloroacetic acid |
2.97 | 35.23 | 11.7-58.6 | ≤0.005 | HS | |
| Pyrogallol red molybdate |
5.33 | 78.58 | 49.3-107.7 | ≤0.0001 |
Table 5: mean difference of turbidimetric methods and pyrogallol red molybdate.

Figure 1: Showing Graph representing correlation of urinary proteins between Pyrogallol Red molybdate and Trichloroacetic acid.

Figure 2: Showing Graph representing Correlation of Urinary Proteins done by Pyrogallol Red Molybdate and Sulfosalicylic acid

Figure 3: Showing Graph representing Correlation of Urinary Proteins done by Pyrogallol Red Molybdate and Sulfosalicylic acid with sulphate. A statistically significant correlation was found between Pyrogallol red molybdate with Turbidimetric methods was highly significant with p value of ≤ 0.0001 and r value of 0.68, 0.86, 0.97 respectively.
Table 6 shows the mean Difference between Trichloroacetic acid with sulfosalicyclic acid, sulfosalicyclic acid with sodium sulphate, pyrogallol red molybdate.The mean difference was highly significant with both SSA, SSSS (P ≤ 0.0001), (P ≤ 0.005) repectively. While it was significant with PRM (P ≤ 0.01).
| Trichloroacetic acid | Methods | t value | Mean difference | 95% confidence interval |
P value | Sig. |
|---|---|---|---|---|---|---|
| Sulfosalicyclic acid |
-4.86 | -54.64 | -76.8-(-32.4) | ≤0.0001 | HS | |
| Sulfosalicyclic acid with sodium sulphate |
-2.97 | -35.23 | -58.6-(11.79) | ≤0.005 | ||
| Pyrogallol red molybdate |
2.62 | 43.35 | 10.6-76.0 | ≤0.01 | S |
Table 6: Mean differences between tca with ssa, ssss and prm
Discussion
Proteinuria is marker of early renal disease. Nephrotic syndrome along with edema, hyperlipidemia, hyperalbuminemia and more susceptibility/prone to infection is very common these days. For the past 20 years, there has been an increased proteinuria in worldwide population leading to end stage renal disease. There has been an increased risk of atherosclerotic cardiovascular disease in the patients with Proteinuria as well as microalbuminuria. Proteinuria is defined as urinary protein excretion of greater than 150 mg/day Normally urine contains less than 150 mg protein/day, with only 20% 8of it being albumin (<30 mg/d or 20 μg/min) Clinically proteinuria manifest only when the excretion is greater than several grams per 24 hours.
The study was carried out in the Department of Biochemistry in Guru Gobind Singh Medical College & Hospital, Faridkot with an objective to compare the urinary protein estimated by turbidimetric methods and pyrogallol red molybdate method. The mean difference between sulfosalicyclic acid with all the other methods. The mean difference was significant with SSSS (P ≤ 0.05), while it was highly significant with both other methods i.e. TCA and PRM (P ≤ 0.0001).
The mean difference between sulfosalicyclic acid with sodium sulfate with SSA, TCA, PRM. The mean difference was significant with SSA (P ≤ 0.05), while it was highly significant with both other methods i.e. TCA and PRM (P ≤ 0.005), (P ≤ 0.0001) respectively. The mean difference between Trichloroacetic acid with sulfosalicyclic acid, sulfosalicyclic acid with sodium sulfate, pyrogallol red molybdate. The mean difference was highly significant with both SSA, SSSS (P ≤ 0.0001) (P ≤ 0.005) repectively. While it was significant with PRM (P ≤ 0.01).
A statistically significant correlation was found between Pyrogallol red molybdate with Turbidimetric methods was highly significant with p value of ≤ 0.0001 and r value of 0.68, 0.86, and 0.97 respectively.
Conclusion
From this study, it was concluded that turbidimetric methods are correlated with pyrogallol red molybdate but there is significant difference in mean. So, pyrogallol red molybdate is method of choice for detecting proteinuria.
References
- Tothova C, Mihajlovicova X, Nagy O (2018) The use of serum proteins in the laboratory diagnosis of health disorders in ruminants. Ruminants-The husbandry, economic and health aspects. London: Intech Open Ltd. 105-146
- Fuller CE, Threatte GA, Henry JB (2001) Basic examination of urine. In Henry JB: Clin diagnosis and management by laboratory method. 20th ed. France. 373-376.
- Hcbert SC, Reilly RF, Kriz W (2001) Structural-functional relationships in the kidney, in Sehrier RW. Diseases of the kidney and urinary tract. 7th ed Philadelphia: Williams and Wilkins. 3-57.
- Orth SR, Ritz E (1998) The nephrotic syndrome. New Engl J of Med 338:1202-1211
- Lafayette RA, Pcrrone RD, Levey AS (2001) Laboratory evaluation of renal funetion, in Sehrier RW in: Diseases of the kidney and urinary tract. 7th ed. Philadelphia:Williams and Wilkins. 333-369
- Devarajan P (1993) Mechanisms of orthostatic proteinuria: lessons from a transplant donor. J Am society of Nephrol 4:36-39
[Crossref] [Google Scholar] [Indexed At]
- Wrone EM, Carnethon MR, Palaniappan L, Fortmann SP (2003) Association of dietary protein intake and microalbuminuria in healthy adults: third national health and nutrition examination survey. Am J kidney dis 41:580-587
[Crossref] [Google Scholar] [Indexed At]
- Mogensen CE, Christensen CK (1984) Predicting diabetic nephropathy in insulin dependent patients. New Engl J of Med 311:89-93
[Crossref] [Google Scholar] [Indexed At]
- Sarfaraz Ahmed TA (2012) A Study on role of spot urine protein creatinine ratio in quantification of proteinuria. Doctoral dissertation, Government Mohan Kumaramangalam Medical College, Salem.1-102
- Keane WF, Eknoyan G (1999) Proteinuria, albuminuria, risk, assessment, detection, elimination (PARADE): a position paper of the National Kidney Foundation. Am J of kidney Dis 33:1004-1010
[Crossref] [Google Scholar] [Indexed At]
- Denker B, Brenner B (2008) Azotemia and Urinary abnormalities. In: Harrison’s Principles of Internal medicine. 17th edition. Mc Graw–Hill medical publishing division. New Delhi.
- Wokes F, Still BM (1942) The estimation of protein by the biuret and Greenberg methods. Biochemical J 36:797-806
[Crossref] [Google Scholar] [PubMed]
- Rytand DA, Spreiter S (1981) Prognosis in postural (orthostatic) proteinuria: forty to fifty-year follow-up of six patients after diagnosis by Thomas Addis. New Engl J of Med 305:618-21
[Crossref] [Google Scholar] [PubMed]
- Kerr DN (1982) Normal values in renal medicine. Med 23:1047-1053
- Stewart Cameron J (2005) The Patient with Proteinuria and/or haematuria. In: oxford Nephrology. 3rd ed .Oxford Medical Publication
- Fagain OC (1997) Protein stability and its measurement In: Fagain OC (ed) Stabilising protein Function: Springer Press. Berlin 69–75
- Kitabatake N, Doi E (1993) Improvement of protein gel by physical and enzymatic treatment. Food Rev Int 9:445-471
- Ringsrud MK, Jorgenson Linne LL, Free AH (1995) Urinalysis and Body Fluids: A color text and atlas. Clin Chem 41:1548
- Link A J, LaBaer J (2011)Trichloroacetic Acid (TCA) Precipitation of Proteins. Cold spring harbor. USA. 5651.
[Crossref] [Google Scholar] [Indexed At].
- Pennock CA, Passant LP, Bolton FG (1968) Estimation of cerebrospinal fluid protein. J Clin Pathol 21:518-520
[Crossref] [Google Scholar] [Indexed At]
Open Access Journals
- Aquaculture & Veterinary Science
- Chemistry & Chemical Sciences
- Clinical Sciences
- Engineering
- General Science
- Genetics & Molecular Biology
- Health Care & Nursing
- Immunology & Microbiology
- Materials Science
- Mathematics & Physics
- Medical Sciences
- Neurology & Psychiatry
- Oncology & Cancer Science
- Pharmaceutical Sciences