ISSN : 0976-8505
Der Chemica Sinica
Very Low Frequency Electromagnetic, Magnetic and Radiometric Surveys for Lamproite Investigation in Vattikod Area of Nalgonda District, Telangana State, India
G Sriramulu, G Ramadass and Dubba Vijay Kumar*
Centre of Exploration Geophysics, Osmania University, Hyderabad, Telangana State, India
Abstract
Very Low Frequency Electromagnetic (VLF-EM), total magnetic and radiometric investigations were carried out in the newly discovered Gundrapally and Vattikod Lamproite fields, Nalgonda district, Telangana State, at the North western margin of the Meso-Proterozoic Cuddapah basin in the Eastern Dharwar Craton (EDC), South India. The effectiveness of these methods is in mapping variations of subsurface geological structures, faults/fractures disposition, extent of the dykes and contact between different rock types. The VLF-EM, magnetic and radiometric measurements were performed along seven profiles (I to VII). The results revealed the location of conductive bodies, geological boundaries, dykes, faults/fractures and shear zones are delineated along contact between dykes and granitic rocks. The Fraser filtered data plots as well as Karous-Hjelt filter 2-D inversion current density pseudo sections for real and imaginary components has aided in refining the location of conductor response, dip and the depth of these conductors. The interpreted results VLF-EM corroborated well with the magnetic and radiometric results.
Keywords
Meso-proterozoic cuddapah basin, Eastern dharwar craton, Lamproites, VLF–EM, Dykes, Conductive bodies
Introduction
VLF-EM method is an effective method for detecting long, straight, electrical conductors and has been used to locate fractures, to image subsurface voids, to map landfill margins and to delineated buried conductive utilities [1]. The theory of VLF-EM technique is well described in the literature [2,3]. The VLF-EM geophysical method is a quick and powerful tool for the study of shallow conducting lineament features in the near-surface earth. The method is based on measurement of the secondary magnetic field induced in local conductors by primary electromagnetic fields generated by the powerful military radio transmitter in the very low-frequency range (15-30 KHz). These stations, located around the world generate signals which are effectively used for a variety of applications including mineral exploration for mapping narrow mineralized zones, dykes, faults. Shear zones [4,5] in the detection of weak conductors and also has been used in mapping weathered layers in granitic terrain [6].
Multidisciplinary applications at the NW margin of the Cuddapah basin, Eastern Dharwar craton, southern India, Nalgonda district, Telangana State, India, lead the discovery of a new clusters of lamproites names as Vattikod clusters [7], emplaced within the granitic rocks of Peninsular Gnessic Complex within the eastern Dharwar craton, Southern India.
The Vattikod Lamproite clusters was not reported any detailed geophysical studies, keeping this in mind, the present work is aimed by the need to obtain a clear perception of structural configuration along chosen profiles in parts of Gundrapally and Vattikod Lamproite fields by carrying integrated geophysical studies by Total magnetic, VLF-EM and radiometric techniques.
Materials and Methods
Geology of the area
The study area falls in the North western margin of the Cuddapah basin lies in between latitude 16° 52′ to 16° 58′ N: longitude 79° 00′ to 79° 10′ E, Dharwar craton, Southern India, within the Vattikod and Gundrapally Lamproite field ( VLF) and are located about 22 km west of the Ramadugu Lamproite field [8]. The area is a part of Peninsular Gneissic Complex (PGC) comprising migmatites and intrusive granitoids with enclave patches of older metamorphic rocks. The ten Lamproites bodies identified at the west of Vattikod village (16° 55′ 13.2′′ & 79° 05′ 55′′) are VL-1 to VL-10, one Lamproite dyke located in the close vicinity of Gundrapalley village (16° 56′ 35.9′′ N79° 02′ 38.6′′) is GL-1. These lamproites are emplaced along ENW-ESE to BW-SE trending fractures in the granitic –gneiss basement. Dolerite dykes are also seen emplaced alongside of the lamproites in the WNW-ESE fractures. Apart from these a few more lamproites are noticed [7] in the form of stray boulders at two other locations Kastala and Samulonibavi in the study region.
Data base
The Vattikod study area lies in between latitude 16° 52′ to 16° 58′ N and longitude 79° 00′E to 79° 10′ E. Very low frequency (VLF), total magnetic and radiometric investigations carried out in detail using ABEM WADI VLF equipment, Model 600 Proton precession magnetometer and ECIL-Scintillometer type SM141 instrument respectively, along seven detailed profiles with one meter station to station distance were conducted at the profile-I (Gundrapalley GL-1), profile-II (Vattikod VL-1), profile-III (Vattikod Vl-2), profile-IV (Vattikod VL-4, VL-5), profile-V (Vattikod VL-6, VL-7 and VL-8), profile-VI (Vattikod VL-9), profile VII (Vattikod VL-10,) and lamproites field (Figure 1). The length of these profiles varied between 20 m to 55 m was taken perpendicular to the geological formations. The frequency used in the present investigation is 18 KHz, Global Position System (GPS) was used to locate the observation points and elevation to ensure reliability and accuracy of the radiometric and GPS elevation, location of geographic coordinates several observations (20%) are repeated. The overall effective accuracy obtained for elevation, the total magnetic, radiometric and VLF data is 1 m, ± 1nT, 2 μR/hour and 2% respectively. The N-S and E-W extends of this area that falls under Survey of India (SOI) Topo sheet no. E44T1, E44T2 and E44T5 in Nalgonda district of Telangana state, India.
Data analysis
VLF (EM) data are useful for obtaining a qualitative view of the structure, particularly after filtering the data and analyzing the current density across the section. Another filter proposed by Karous and Hjelt allows geophysicists to filter the in-phase (Real) and out-phase (Imaginary) data and generate an apparent current density pseudo section and therefore image the geological underground structure [9-15]. Fraser and Karous-Hjelt linear filtering techniques have been proved to be effective because they provide a simple scheme for semi quantitative interpretation [16,17]. The data acquired during modern VLF surveys normally comprises at least three separate parameters of the secondary magnetic field, including the amplitude of the field and its quadrature (Imaginary) and in-phase (Real) components relative to the horizontal primary field. Results are presented as profiles against distance. The filtered real and imaginary components along the profile positive amplitude of real and imaginary components indicate the conductor, the point at which the reading changes from positive to negative is termed the ‘cross-over’ point and lies directly above the fault/ facture, if the conductor dips then the anomaly shape will be distorted in either the positive or negative sense.
Karous-Hjelt filters was used then data was processed using RAMAG (VLF) modeling processing software 1.04 version (2010) , modeled nine traverses, using skin depth 150 m. The set of apparent current density pseudo sections for real and imaginary components (Sayala) and graph for real and imaginary component amplitude generated for each traverse. The corresponding pseudo-sections (plots of station interval vs. depth) are shown in Figures 1 to 7. The depth of the section obtained up to 150 m. The red color indicates the high current density (conductive body) and dark blue color indicate low current density (high resistivity body as dykes) and intermediate green color moderate resistive bodies, as shear zone.
Profile-I (Gundrapally Gl-1)
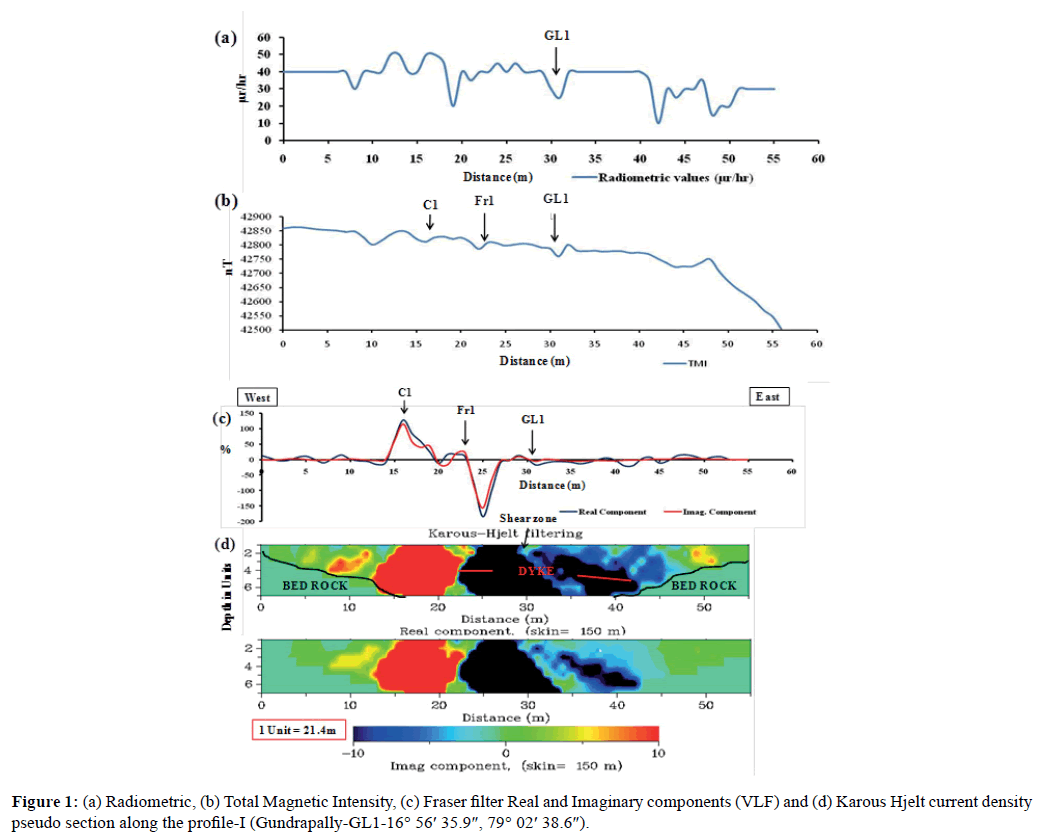
The profile-I (Gundrapally-GL latitude 16° 56′ 35.9′′ N, longitude 79° 02′ 38.6′′E) trends approximately N36° E direction across the Gundrapally lamprorite bodies and is 55 m long. Figure 1 and Figure 1b is the radiometric and total magnetic intensity are obtained along the traverse is characterized low radioactivity and susceptibility less than the back ground levels over the conductive and lamproite bodies Figure 1c.
Figure 1c is the filtered real and imaginary components along the profile, positive amplitude of real and imaginary components and crossovers indicates the presence of one conductive zone between station to 15 m to 20 m and one fracture (Fr1) at 23 m and lamproite body at 30 m along the profile-I are identified [17]. Figure 1d is the apparent current density pseudo sections of real and imaginary components reveal the subsurface nature of the conductive and resistive bodies. The conductive body is between 15 m to 20 m dipping towards west and resistive bodies between 24 m to 47 m dipping towards east. The data show four parallel small moderate current density distribution on real components, which is possibly indicating a fault related depression zones is recognized as 3 m width shear zone in between 29 m to 30 m are responsible for location of lamproite dykes (GL-1) show irregular to circular surface configuration with occasional protuberances into the sheet/sub-vertical joints in the host granitoid. The basement topography is ranging between 45 m to 150 m.
Profile-II (Vattikod Vl-1)
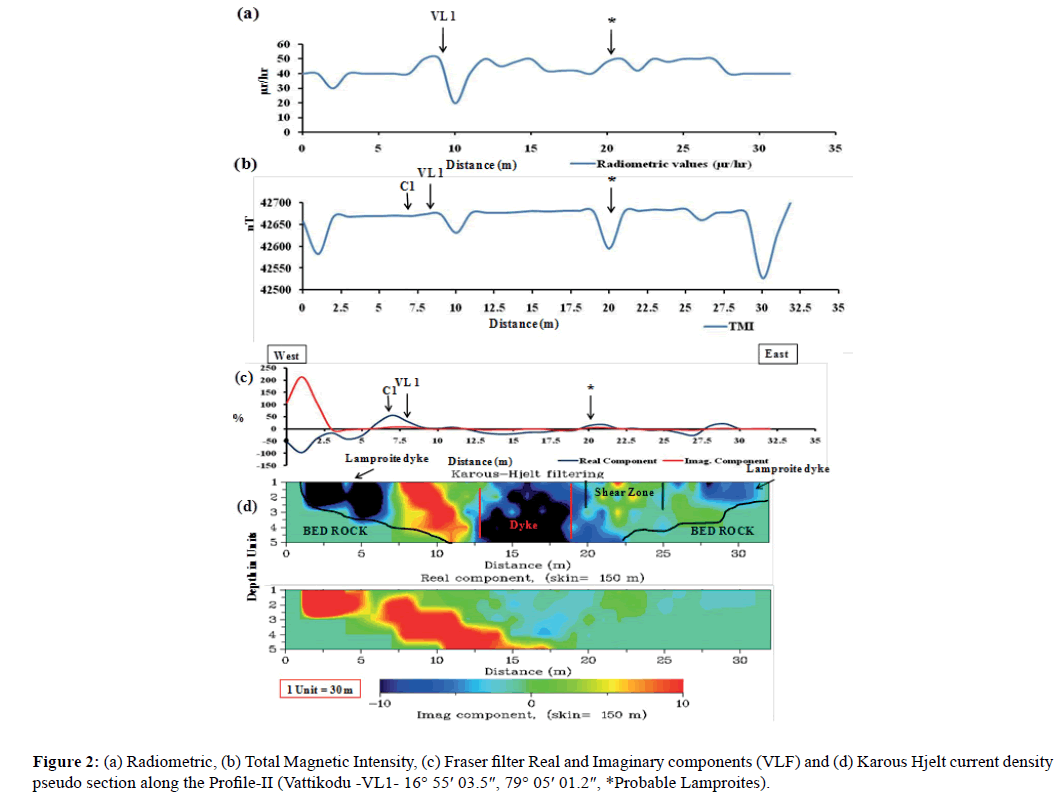
Profile-II (VL-1) trends approximately N 180 E (latitude 16° 55′ 03.5′′ N, longitude 79° 05′ 01.2′ E) and is 32.5 m long shown in Figure 2. The double plots of filtered real and imaginary components Figure 2c enables qualitative identification of the linear features i.e. points of coincident of crossovers and positive peaks of the real and imaginary anomaly. From these plots Figure 2c one conductive at 7 m and two lamproite bodies at 8 m and 20 m along the profile were delineated.
Profile-III (Vattikod Vl-2)
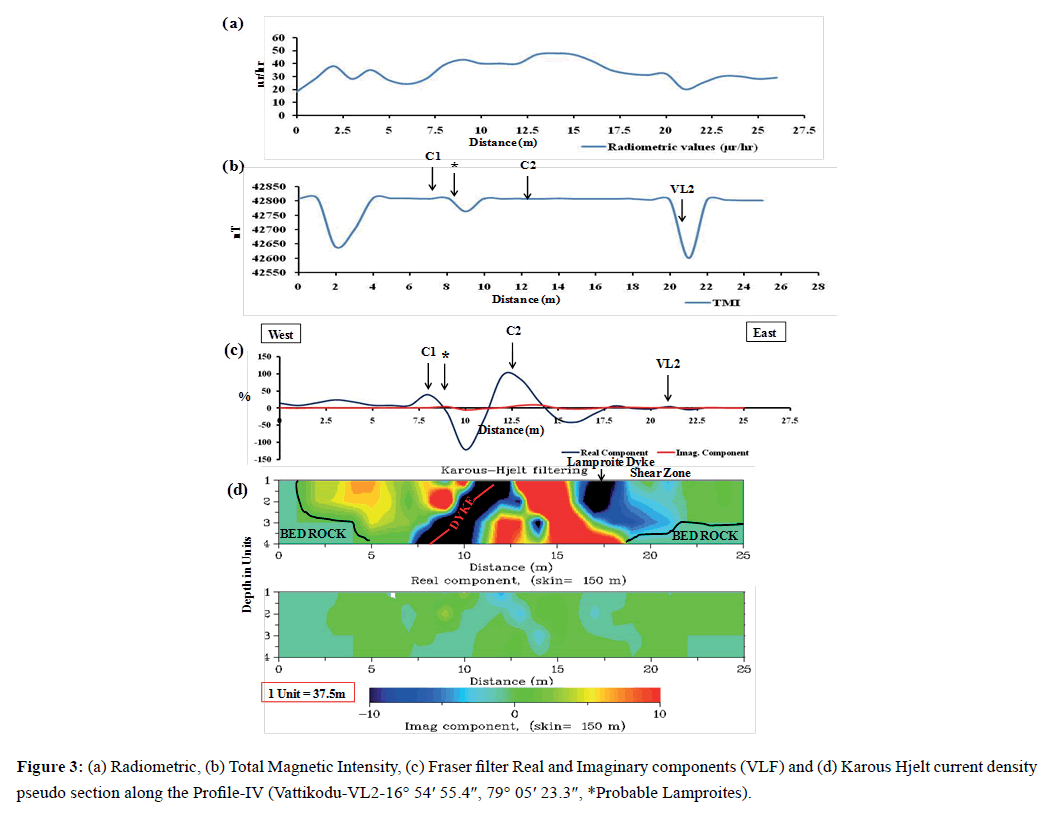
This profile-III (16° 54′ 55.4′′-79° 05′23.3′′) is total length of 25 m shown in Figure 3a shows the Radiometric data, total Magnetic Figure 3b and filtered real and imaginary components of the VLF. Broad variation of radiometric intensity with few lows and three magnetic lows were observed. Figure 3c shows the filtered real and imaginary components of the VLF data along the profile shows two conductors at distance 7.5 m and 12.5 m designated C1 and C2 respectively and two lamproite bodies at 9 m and 21 m along this traverse were mapped, indicated on the real positive amplitude and crossover of the real and imaginary components. Figure 3d represents apparent current density pseudo cross-sections have been constructed for specific and distinctive profile to show the variation and to derive the change of conductivity with depth. The data analysis revealed the presence of conductive, resistive and western dipping dyke in between 11 m to 12.5 m are responding with high resistive body extending beyond 150 m vertically and one thin lamproite dyke identified at 17.5 m with a 1.5 m width extending with 70 m vertical direction dipping towards west is the current density pseudo section of imaginary components is the inversion of real component.
VLF-EM filtered real and imaginary data have been converted to the pseudo section using the KH filter Figures 3c and 3d. The visual examination of these sections allows depth of occurrence, width and dip of the body to be determined. Two lamproite dykes, at 2 m to 6 m and 28 m to 31 m, one vertical dipping dyke at 14 m to 18 m, and one shear zone identified, which is associated with a new lamproite associated with a moderate current density distribution. Radiometric and total magnetic data revealed over this profile shows low value (peaks) than the background levels above the lamproite zone with a peak of and respectively.
Profile-IV (Vattikod Vl-4 and 5)
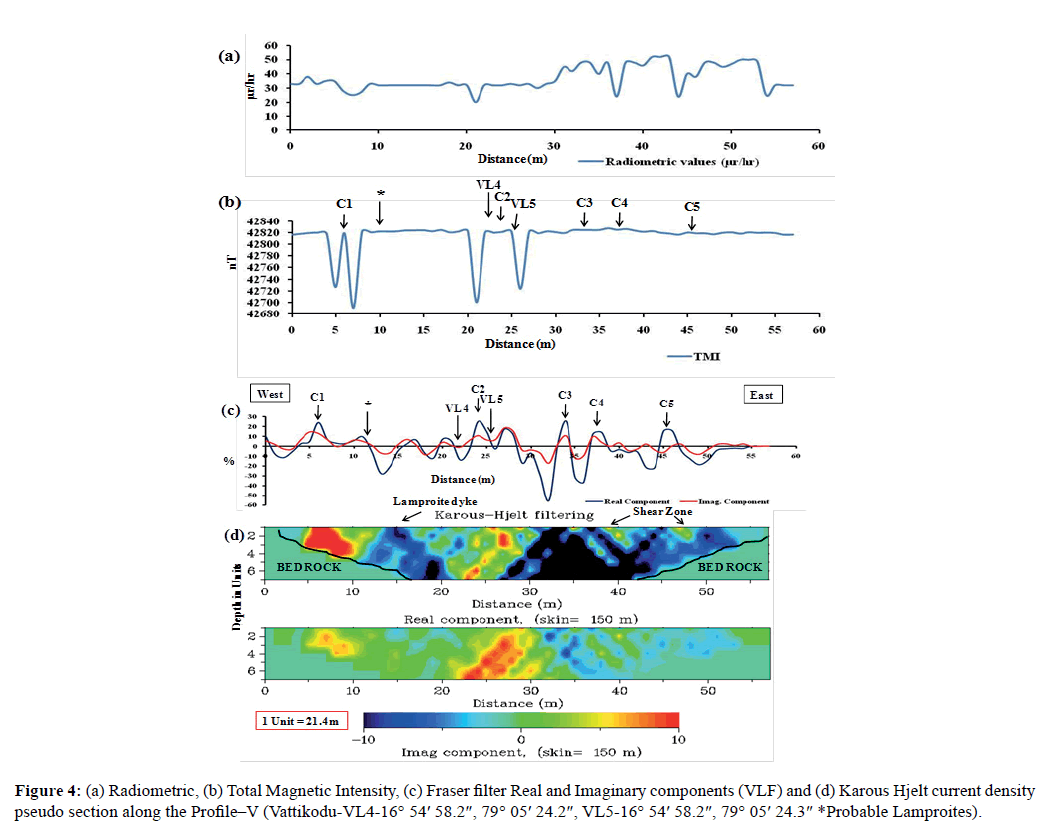
This profile-IV extended total length of 55 m crossing two lamproite bodies VL-4 (16° 54′ 58.2′′-79° 05′ 24.3′′) and VL-5 (16° 54′ 58.2′′-79° 05′ 24.2′′). Figure 4c the real and imaginary plots the indicate presence of the multiple resistive and five conductive bodies along obtained at (C1) 6 m, (C2) 24 m, (C3) 28 m, (C4) 38 m and (C5) at 42 m along the profile. The apparent current density cross section Figure 4d reveals three lamproites bodies VL-4, VL-5 and (*) new body situated at 21, 25 and 11.5 m respectively, along the profile a shear zone ( 40-5 m) is characterized by a moderate resistivity contrast with a multiple thin dykes dipping towards west direction were identified. Figures 4a and b is the magnetic and radiometric response over the lamproite bodies observed low values compare to background values.
Profile-V (Vattikod, Vl-6, 7 and 8)
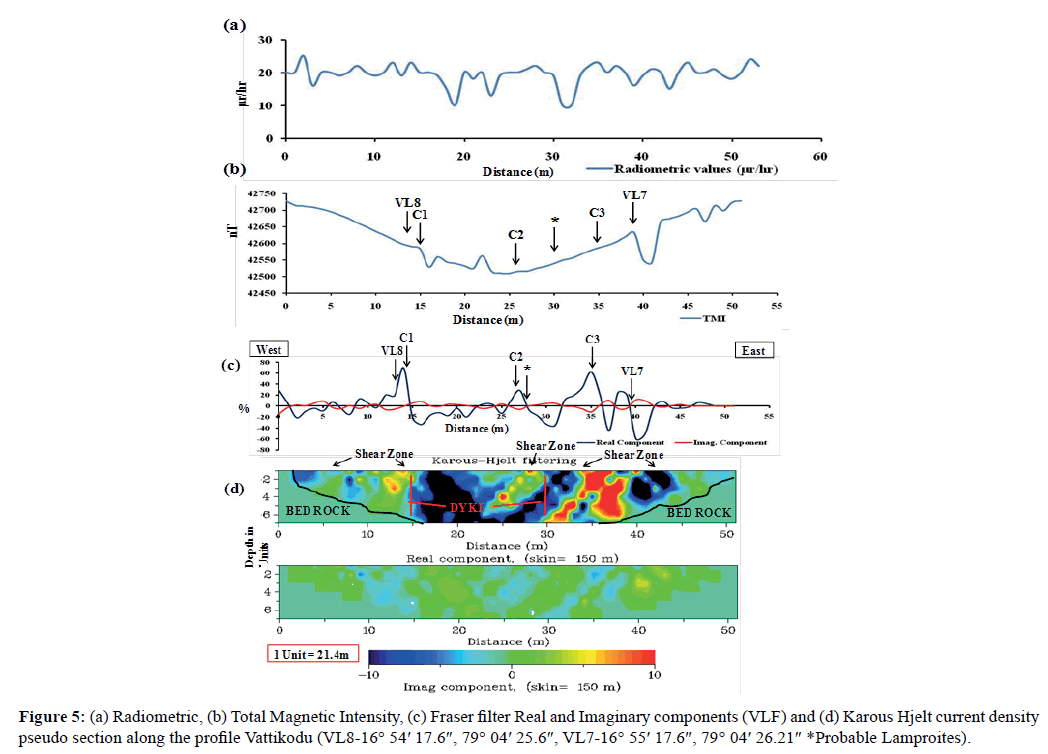
Profile-V 16° 55′ 17.6′′-76° 04′ 26.1′′, figure-6 shows the across VL-6, VL-7 and VL-8 bodies at Vattikod having a total length of 50 m. The VLF, magnetic and radiometric observations obtained at every one meter. Figure 5c shows filtered real and imaginary components represents the positive and negative values. Figure 5d shows current density pseudo section has been constructed distinct to traverse to show the vertical variation of a current density, and consequently to derive the change of conductivity with depth qualitatively. It is possible to differentiate between conductive and resistivity formations using apparent current density pseudo sections multiple resistivity bodies and conductive bodies. There are six resistivity bodies and three conductive bodies (C1, C2 and C3) at 2 to 4, 8 to 10 and 16 to 20, 30 to 32, 42 to 43, and station 24, station 28, and station 35 respectively. VL-6, VL-7 and VL-8 lamproite dykes identified at 28 m, 29 m and 14 m respectively. Two shear zones are associated with lamproites at western and eastern side of the profile. The bedrock photography is varying traverse 70 to 150 m at station 25 m basement is traced. Figure 6a is the radiometric response is oscillatory where as a total magnetic intensity exhibiting broad low with fluctuations over the conductive and lamproite bodies.
Profile-VI (Vattikod Vl-9)
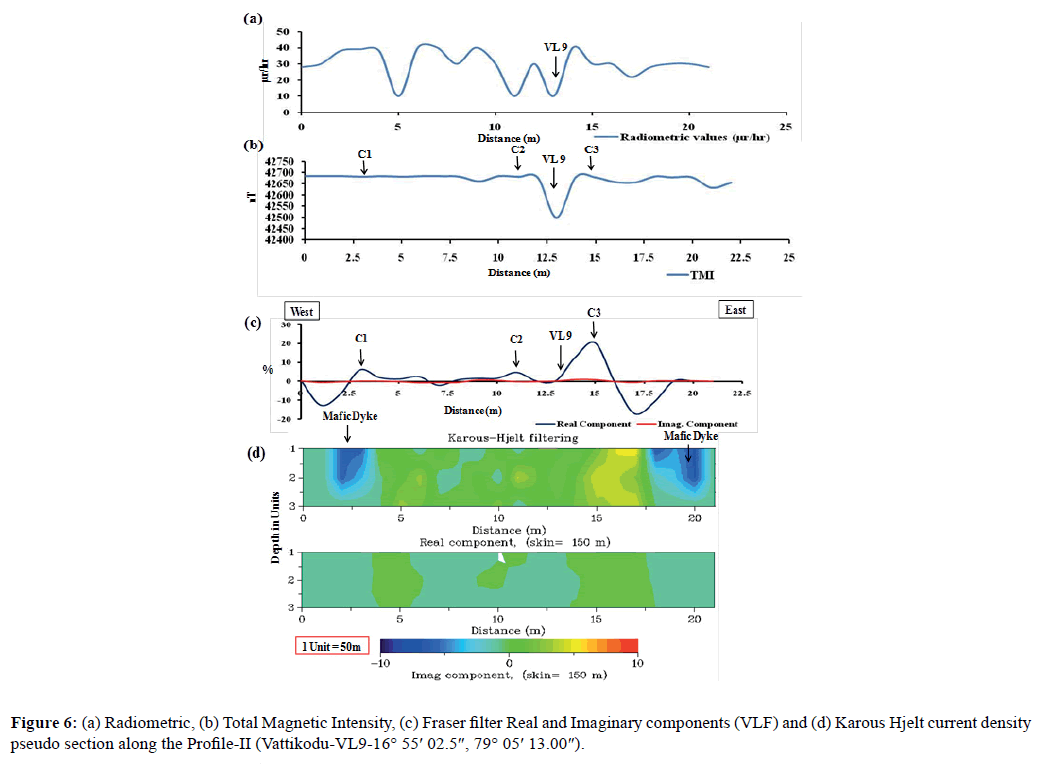
Profile-VI (VL-9) runs across the lamproite body VL-1 (16° 55′ 02.5′′, 79° 5′ 13.00′′) trending N-W direction, is about 20 m long. The filtered real and imaginary components show in Figure 6c, indicate the presence of two resistive and one conductive (C1) bodies in between 2 m to 3 m, and 17.5 m to 21 m and C1 conductive body at 15 m and two mafic dykes are identified. From Figure 6d is the apparent current density pseudo section reveals the vertical dip of the formations with moderate current density distribution. The lamproite Vl-9 is located at 13 m along the profiles in the suspected mafic lamproite dyke in the shear zone. The response of total magnetic Figure 6b and radiometric Figure 6a also corroborated with VLF (EM) results.
Profile- VII (Vattikod, Vl-10)
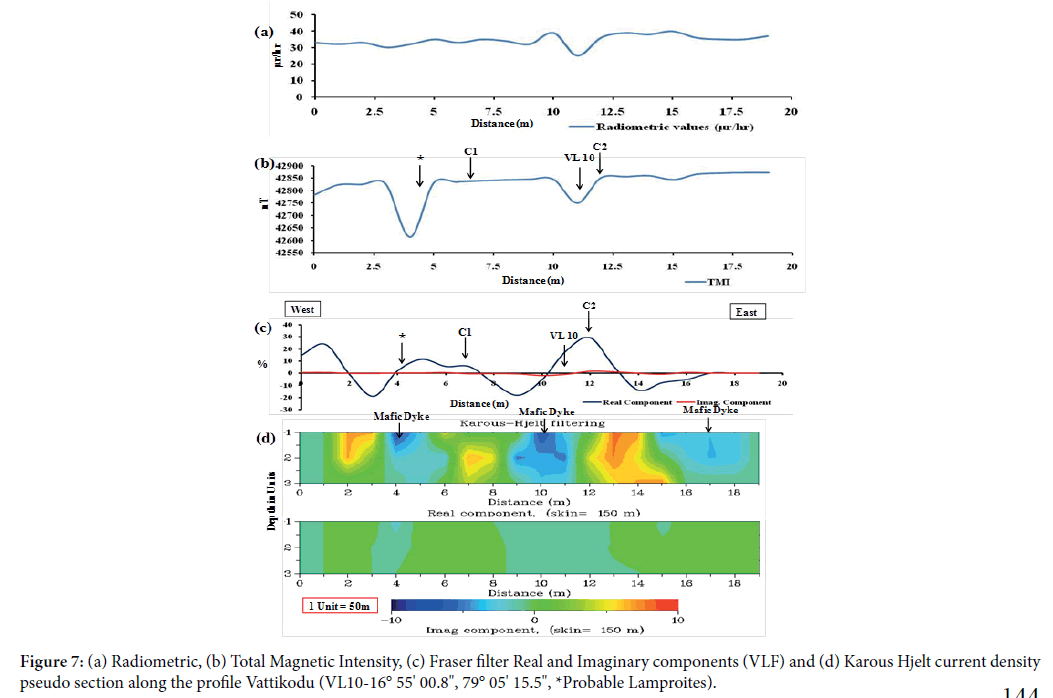
Profile -VII (Vattikod, VL-10 (latitude 16° 55′ 0.8″ and longitude 79° 05′ 15.5″) west of Vattikod village, the total length of 18 m station interval is 1 m, Figure 7c represents the filtered real and imaginary components of the VLF-EM data brought out three conductors C1 at 2 m, C2 at 6 m and C3 at 12 m and three resistive formations at 4 m to 6 m, 9 m to11 m and 13 m to 15 m were traced along the profile. Figure 7d is the apparent current density pseudo section distribution revived across the major conductive zones and resistive formation are dipping vertically two lamproite bodies situated at 4 m (new) and 12 m are along the contact of resistive and conductive zones. Figure 7a and 7b are radiometric and total magnetic intensity agrees with the VLF results.
Conclusion
Investigations of VLF -EM, Total magnetic and radiometric data has clearly brought out the subsurface structures. Positive amplitude of real and imaginary components demarcate the conductors and cross over points coincided with the fractures/faults/contacts, from the current density pseudo section of the traverses I to VII helps in determining the conductors dip attitude , bed rock topography, nature of the conductive zones, lamproite dykes and shear zones. It is infer that the for observed lamproites shows contact between high and low resistive intrusive features within shear zones which might have create conditions favorable for thermogenic origin of the lamproites.
Mineral chemistry of various phases in the Vattikod lamproites have been analyzed by Alok kumar et al., the phlogopite in these lamproites is Ti rich (5-6 wt%) and Al (7-8 wt%) poor. The clinopy 4 oxen is Na-poor and the rich terite is potassic (>4.5 wt%). Showing similarity with the dominant groundmass reported from Cuddapah and Krishna lamproites.
Acknowledgements
The authors are extremely grateful to the UGC New Delhi for the financial support extended by them granting Emeritus professor to Prof. G Ramadass, and RFSMS fellowship to G Sriramulu, Department of Geophysics, Osmania University, Hyderabad. The authors record their sincere thanks to HOD, Dept. of Geophysics, O.U for providing facilities during the field work. I am thankful to Jagadish, Research Scholar, CEG for helping during the fieldwork.
References
- Hutchinson PJ, Barta LS (2002) VLF surveys to delineate long wallmine induced fractures. Leading Edge 21: 401-493.
- Paterson ME and Ronka V (1971) Five years of surveying with the very low frequency electromagnetic methods. Geoexploration 9: 7-26.
- Wright JL (1988) VLF Interpretation manual. Scintrex, Toronto.
- Phillips WJ, Richards WE (1975) A study of the effectiveness of the VLF methods for the location of narrow mineralized zones. Geoexploration 13: 215-216.
- Parkar ME (1980) VLF Electromagnetic mapping for strata-bound mineralization near Aberfeldy, Scotland. Trans Inst Min Metall Scot B89: B123-B133.
- Poddar M, Rathor BS (1983) VLF surveys of the weathered layer in southern India. Geoexploration 31: 524-537.
- Kumar A, Ahmed S, Priya R, Sridhar M (2013) Discovery of Lamproites near Vattikod Area, NW margin of the Cuddapah Basin, Eastern Dharwar craton, Southern India. Jour Geol Soc of India 82: 307-312.
- Sridhar M, Rau TK (2005) Discovery of a new lamproite field- Ramadugu Lamproite field (RLF), Nalgonda district, Andhra Pradesh. Group Discussion on Kimberlites and related rocks. Geol Soc India, Bangalore, pp.55-57.
- Coney DP (1977) Model studies of the VLF-EM method geophysical prospecting Geo-exploration. Geoexploration 15: 19-35.
- Karous M, Hjelt SE (1977) Determination of apparent current density from VLF measurements Report. Department of Geophysics, University of Oulu, Finland, Contribution No.89, pp.10.
- Karous M, Hjelt SE (1983) Linear filtering of VLF dip-angle measurements. Geophysics Prospecting 31: 782-794.
- Fisher G, Le Quang BV, Muller (1983) VLF ground surveys, a powerful tool for the study of shallow two-dimensional structures. Geophysical Prospecting 31: 977-991.
- Sundararajan N, Ramesh Babu V, Shiva Prasad N, Srinivas Y (2006) VLPROS- a Matlab code for processing of VLF-EM data. Comput Geosci 32: 1806-1813.
- Ramesh Babu V, Ram S, Sundararajan N (2007) Modeling of magnetic and VLF-EM with an application to basement fractures-a case study from Raigad, India. Geophysics 71: 133-140.
- Sundararajan N, Chary MN, Nanda kumar G, Srinivas Y (2007) VLF and VES an application to groundwater exploration, Khammam, India. The Leading Edge 26: 708-716.
- Fraser DC (1969) Contouring of VLF-EM data. Geophysics 34: 958-969.
- Ogilvy RD, Lee AC (1991) Interpretation of VLF-EM in phase data using current density sections. Geophysics Prospecting 39: 567-580.

Open Access Journals
- Aquaculture & Veterinary Science
- Chemistry & Chemical Sciences
- Clinical Sciences
- Engineering
- General Science
- Genetics & Molecular Biology
- Health Care & Nursing
- Immunology & Microbiology
- Materials Science
- Mathematics & Physics
- Medical Sciences
- Neurology & Psychiatry
- Oncology & Cancer Science
- Pharmaceutical Sciences
