Statistical Comparison to Determine First Line Regimen of Two Anti-Malarials for Uncomplicated Plasmodium falciparum Malaria among Children under 5 Years
Alnory A1*, Sondous A2 and Abdalajabar A2
1Department of Biostatistics and Epidemiology, University of Gezira, Gezira, Sudan
2Department of Applied Statistics, University of Gezira, Gezira, Sudan
- *Corresponding Author:
- Alnory A
Department of Biostatistics and Epidemiology
University of Gezira, Gezira,
Sudan
Tel: +249912237372
E-mail: profalnory@gmail.com
Received date: November 14, 2017; Accepted date: November 25, 2017; Published date: December 10, 2017
Citation: Alnory A, Sondous A,Abdalajabar A(2017) Statistical Comparison to Determine First Line Regimen of Two Anti-Malarial for Uncomplicated Plasmodium falciparum Malaria among Children under 5 Years.J Biomed Sci Appl Vol. 1 No. 2:9.
Abstract
Comparison of regimen efficacy in clinical medicine has been utilized to improve the effect of drugs against disease The pairs alternative t-test method approach is used in this experimental study to derive efficacy estimates of two anti-malarial regimens. This study aimed at comparing mostly used drugs against malaria in Africa in the present time, namely artesunate-mefloquine and artemether-lumefantrine to determine which of them is more effective treatment of the disease among children under 5 years of age and thus may be considered as a first line treatment, especially when laboratory tests are not available. The results achieved in this study were based on hypothetical experimental data. The data which represented 12 pairs of match’s children were analyzed using t tests with the help of SSS program. The study concluded that artesunate-mefloquine is more effective as a first line treatment than artemether-lumefantrine in children less than five years age of both sexes.
Keywords
Malaria; Children; Sudan; Regimen
Background
The main objective of this study is to enhance methodology in epidemiological research and illustrate a procedure to test therapeutic responses post anti-malarial treatment of two regimens. The purpose of this kind of study is to illustrate to young researcher in the heath field who are not familiar with statistical experimental design how to measure and compare anti-malarial clinical efficacy. Many studies have been made to test the superiority of a traditional drug against another drug [1]. This has become a routine for pharmacists to test their drugs. Malaria in Africa has, especially, become a problematic endemic disease resisting various kinds of drugs and such statistical tests are continuously needed in any attempt to control the disease. For this reason the study aimed at comparing two mostly used drugs against malaria in the present time, namely artesunatemefloquine and artemether-lumefantrine to determine which of them is more effective treatment of the disease among children under 5 years of age. Rapid treatment of malaria is necessary to avoid life-threatening complications, especially in the absence of laboratory tests, so comparing the two most important treatments currently in use in most African countries in the malaria zone will enable us to identify the best treatment as a first line to treat malaria in such cases. The study is basically concerned with explaining the methodology rather than obtaining robust results.
The t- distribution
Definition: If Y is a standard normal random variable and Z is a Gamma random variable with parameters n and h=1, independent of Y. Then X a random variable has a standard Student's t distribution with n degrees of freedom if it can be written as a ratio

Equivalently, we can write:

Where χ2 - Chi-square is a random variable with n degrees of freedom (dividing by n a Chi-square random variable with n degrees of freedom, one obtains a Gamma random variable with parameters α=1/2 and β=2 [2].
Definitions the distribution related to the t distribution
Definition of normal distribution: The normal distribution, also known as the Gaussian distribution, is a probability distribution most often used to describe the behavior of a variable clustered around a mean. When graphed, it takes the shape of a bell curve where the peak of the bell is the mean μ, and the width is determined by the standard deviation σ. The equation
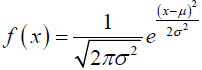
Calculate a normal distribution is, where the standard normal distribution occurs when mean=0 and variance=1. By virtue of the central limit theorem (which states that the distribution of the mean of a large data set tends to a normal distribution), the normal distribution is very useful in statistical analysis of populations and is often encountered in natural sciences [3].
Characteristic function
• The expected value of a normal random variable X is E(x)=μ.
• The variance of a normal random variable X is Var(x)=σ2.
• The moment generating function of a normal random variable X is defined for any
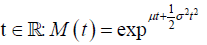
If μ=0 and σ2=1 then the distribution called standard normal distribution [3].
Derivation of t-distribution: For random samples from normal distribution with mean μ and standard deviation σ, σ2/n has a standard normal distribution with mean μ and variance σ2/n.
There for the statistic:
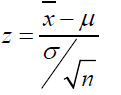
Has a standard normal distribution with mean 0 and variance 1.
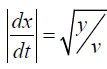
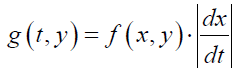
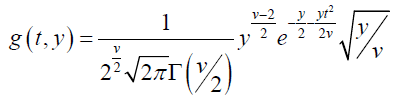
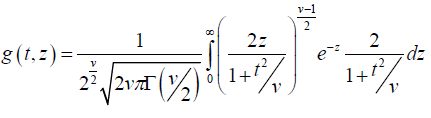
The main problem here is that the standard deviation is unknown and it is necessary to use the sample standard deviation but this needs the following amendment. To find the corresponding distribution we start with the joint probability density function for the variables (s, t).
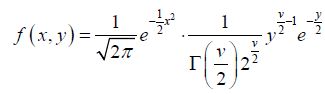
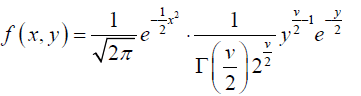
where x has a standard normal distribution with parameters 0,1 and y has a gamma distribution with α=v/2 and β=2.
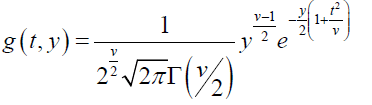
For - ∞ < x < ∞ and y > 0, and f(x, y) = 0 elsewhere, hence. If t is related to x with following relationship

Hence

And

Hence
and we get
Substituting in (1)
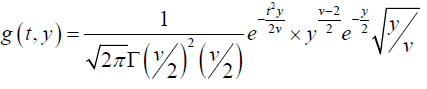
 (2)
(2)
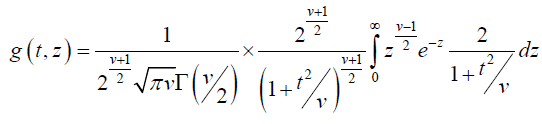
Now substitute
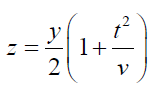
So that
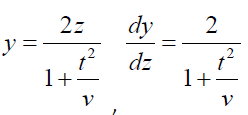
Substituting in (2), we get
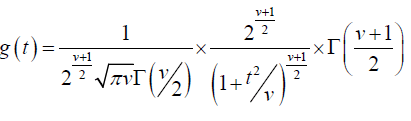
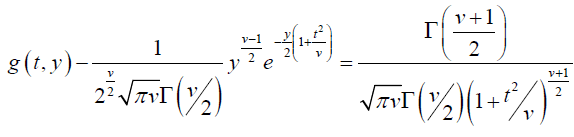
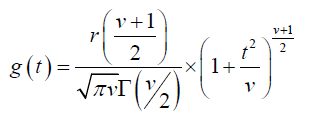
And this is the probability density function of t [4].
Independent t-test assumptions
• The two samples are randomly and independently selected from the two populations.
• The two populations are normally distributed.
• The two sample variances are equal.
Paired t-test assumptions
• Since the observations are paired in this case we test the differences.
• The population of differences has a normal distribution.
• The differences are independent.
• The differences have equal mean and variance
The t-Test for pairs (Equal samples): The t test for pairs is used when the sample size is too small and the variance of the distribution of pairs is not known. Such usage of small sampling theory in clinical medicine is governed by a number of axioms that have to be satisfied when selecting the sample. These axioms are:
1- The selected sample pairs have to be in the same age range.
2- The selected sample pairs have to be of the same sex.
3- The selected sample pairs have to be of the same prognosis.
4- Occupation period of the disease should approximately be equal for the selected pairs patients.
The satisfaction of the axioms above are more important that the sample size [5] (Table 1).
| Pairs of | Treatment | ||||
|---|---|---|---|---|---|
| Patients | Treatment A A |
Treatment B B |
Difference A-B |
||
| 1 | X1 | Y1 | D1 | ||
| 2 | X2 | Y2 | D2 | ||
| 3 | X3 | Y3 | D3 | ||
| 4 | X4 | Y4 | D4 | ||
| 5 | X5 | Y5 | D5 | ||
| 6 | X6 | Y6 | D6 | ||
| 7 | X7 | Y7 | D7 | ||
| 8 | X8 | Y8 | D8 | ||
| 9 | X9 | Y9 | D9 | ||
| 10 | X10 | Y10 | D10 | ||
| 11 | X11 | Y11 | D11 | ||
| 12 | X12 | Y12 | D12 | ||
| Total |  |
 |
 |
||
| Mean |  |
 |
 |
||
Table 1: Cell readings of 12 Alternate pairs given two different treatments.
The table above provides an example of applying the t test. We have 12 matched pairs which were subjected to two different treatments A and B and when the number of pairs is equal (12 in this case) the model works with the differences between the two treatments for testing the null hypothesis that:
To apply the test first calculates the average difference  and the standard error of the mean SD:
Difference To obtain this the common variance is calculated as
 This is then divided by n-1 to give SD2, then we get the standard error of the mean by taking the square root of SD2 divided by the sample size i.e.,
  and finally we divide by the standard error of the mean to get the t statistics as
  .
.
Data:
To collect data on comparative treatments effect is always a complicated task. This especially true when comparing the effect of two anti-malarial drugs. The difficulty arises for a number of reasons.
1. If the plasmodium parasite is scanty, it does not appear in the blood film after taking any of the anti-malarial drugs although it is present in the patient blood. This is a characteristic of people who are repeatedly infected by malaria. For this reason the study should include in the experiment patients who develop the disease for the first time with severe but uncomplicated symptoms.
2. While the treatments are different in two groups, researchers should try to keep as many of the conditions the same as possible. The alternative pairs who will be given the two drugs alternatively should be of the same age group, same sex and having the same prognosis.
3. The inclusion criteria of severe malaria means that only patients with an account of malaria parasite in 100 fields of an oil emersion lens should have a mean number of parasites of 30 and over to satisfy normality assumption. Under such criteria the size of the comparison sample cannot be large because the researcher has to wait for a patient with all the above characteristics to report to health facility. This means that samples are longitudinal in nature.
4. Because samples sizes will be very small, the researcher will have to use small sampling theory tests such as t-student, chi-square or F test. Such framework can only be applied in clinical medicine where experiments are highly controlled. This makes things even more complicated because the patients should be inpatients. Moreover, the researcher should have agreement of collaboration of a doctor and a pathologist working in the facility, in addition to strict ethical considerations and of course financial support.
5. A hypothetical trial experimental trial is presented here to illustrate the application of the procedure using SPSS program. The bench mark parasite counts per 100 fields for hypothetical cohorts of male and female children 0-4 years are based on educated guessing. Treatments to be compared are artesunate-mefloquine and artemetherlumefantrine. The hypothetical cohorts are presented in Tables 2 and 3 successively. Each table shows Parasite count before treatment and Parasite count 24 hours after treatment (Tables 4 and 5).
| Parasite count before treatment | Parasite count 24 hours after treatment | |||
|---|---|---|---|---|
| Patient pairs | Patient 1 | Patient 2 | artesunate-mefloquine | artemether-lumefantrine |
| 1 | 109 | 106 | 33 | 38 |
| 2 | 101 | 103 | 36 | 20 |
| 3 | 111 | 109 | 45 | 25 |
| 4 | 107 | 105 | 50 | 33 |
| 5 | 102 | 101 | 44 | 19 |
| 6 | 107 | 106 | 51 | 32 |
| 7 | 105 | 104 | 34 | 27 |
| 8 | 115 | 108 | 50 | 22 |
| 9 | 110 | 116 | 35 | 43 |
| 10 | 107 | 113 | 35 | 31 |
| 11 | 108 | 102 | 46 | 29 |
| 12 | 107 | 112 | 34 | 32 |
Table 2: Cell readings of 12 Alternate pairs of children (0-4) given two different anti-malarial treatments. Source: hypothetical data (Males A).
| Patient pairs | Parasite count beforetreatment | Parasite count 24 hours after treatment | ||
|---|---|---|---|---|
| Patient 1 | Patient 2 | artesunate-mefloquine | artemether-lumefantrine | |
| 1 | 108 | 104 | 30 | 22 |
| 2 | 105 | 105 | 37 | 22 |
| 3 | 112 | 101 | 25 | 15 |
| 4 | 117 | 105 | 40 | 30 |
| 5 | 112 | 105 | 45 | 29 |
| 6 | 101 | 106 | 52 | 22 |
| 7 | 103 | 104 | 33 | 26 |
| 8 | 105 | 104 | 50 | 20 |
| 9 | 116 | 115 | 55 | 41 |
| 10 | 105 | 112 | 35 | 30 |
| 11 | 102 | 100 | 36 | 24 |
| 12 | 104 | 100 | 34 | 22 |
Table 3 Cell readings of 12 Alternate pairs of children (0-4) given two different anti-malarial treatments. Source: hypothetical data (Females B).
|
|
N | Mean | Std. Deviation | Std. Error Mean |
|---|---|---|---|---|
| Patient 1 1males (0-4) before treatment | 7 | 108.4286 | 3.25869 | 1.23167 |
| 5 | 106.0000 | 4.35890 | 1.94936 | |
| Patient t 1 females(0-4) before treatment | 7 | 105.1429 | 5.01427 | 1.89521 |
| 5 | 110.8000 | 4.54973 | 2.03470 |
Table 4: Descriptive statistics. Source: SPSS output based on hypothetical samples of males and females under 5.
| t-test for Equality of Means | ||||||||
|---|---|---|---|---|---|---|---|---|
| T | df | Sig. (2-tailed) | Mean Difference | Std. Error Difference | 95% Confidence Interval of the Difference | |||
| Lower | Upper | |||||||
| Experiment 1males (0-4) before treatment | Equal variances assumed | 1.110 | 10 | .293 | 2.42857 | 2.18865 | -2.44805- | 7.30520 |
| Equal variances not assumed | 1.053 | 7.079 | .327 | 2.42857 | 2.30586 | -3.01161- | 7.86875 | |
| Experiment 2 females(0-4) before treatment | Equal variances assumed | -1.999 | 10 | .074 | -5.65714- | 2.83039 | -11.96364- | .64936 |
| Equal variances not assumed | -2.034 | 9.290 | .071 | -5.65714- | 2.78062 | -11.91755- | .60326 | |
Table 5: t-test of equality of means. Source: SPSS output based on hypothetical samples of males and females under 5.
Methods of Estimation
The results shown here are, of course, illustrative: All results are based on output from SPSS package
To remind the reader, our experiment involves two outcomes. Malaria parasite count in 100 fields of an emersion lens for twelve pairs of male children represents experiment 1 denoted in the analysis as “patient 1”. Similar experiment for females is denoted as “patient 2”.
Test of independence between males and females samples
Tests the significance of the difference between the two samples means. The procedure provides descriptive statistics for each test variables together with a test of variance equality and a 95% confidence interval for the difference. The two variables involved in our study are the parasite densities of males and females before taking any treatment in the first experiment (patient 1). For simplicity artesunate-mefloquine is referred to as “Quartum” and artemether-lumefantrine as “Artemether”.
Usually, the groups in a two-sample t test are fixed by design, and the grouping variable has one value for each group. However, there are times when assignment to one of two groups can be made on the basis of an existing scale variable [6]. With the Independent-Samples t- Test procedure, all we need to provide is a cut point. The SPSS program divides the sample in two at the cut point and performs the t test. The virtue of this method is that the cut point can easily be changed without the need to recreate the grouping variable by hand every time. The procedure first produces (Table 4).
The descriptive table displays the sample size cut of points, mean, standard deviation, and standard error for both groups. On average parasite count for males (3.5 units of the mean) is less than the comparison group (females), and they vary a little less around their standard deviations (Table 4).
Test of Difference
The procedure produces two tests of the difference between the two groups (Table 3). One test assumes that the variances of the two groups are equal and the other assumes that they are not. The procedure produces t-test for both. The average significance value of the statistic is 0.191. Because this value is greater than 0.10, we can assume that the two groups have equal variances and ignore the second test (Table 5).
The 95% Confidence Interval of the Difference provides an estimate of the boundaries between which the true mean difference lies in 95% of all possible random samples of 12 pairs. Since the significance values of the test are greater than 0.05, we can safely conclude that the average of 0.191 malaria parasites per 100 fields is not due to chance alone and the assumption that the two sample means are equal cannot be accepted. Hence the two samples are independent.
The same test was done for experiment two (patient 2) and arrived to the same conclusion i.e., the two samples are independent.
Paired-samples t- test
The Paired-Samples T Test procedure compares the means of two variables for single pairs. The procedure computes the differences between values of the two variables for each case and tests whether the average differs from 0. In this study on comparative malaria treatment, number of parasites per 100 fields of an oil emersion lens are counted at the beginning of the study, given treatment 1, (a) and measured again. The same procedure was repeated for treatment 2 (Quartum). A third comparison is done for both treatment after taking the drug and test that the difference does differ from 0. Thus, each subject has two counts, often called before and after measures and after treatment for both. An alternative design for which this test is used is a matchedpair (see chapter one for pairs matching criteria) in which each record in the data file contains the response for the patient and also for his or her matched pair. It is the second procedure that is used here.
The procedure provides statistics: for each variable: mean, sample size, standard deviation, and standard error of the mean. For each pair of variables: correlation, average difference in means, t test, and 95% confidence interval for mean difference (one can specify the confidence level).
The descriptive table displays the mean, sample size, standard deviation, and standard error for both groups. Across all 12 pairs, parasite load dropped substantially, a drop of 61% after 24 hours from taking Artemether. Now we have to confirm that this large drop is not due to chance. But before that we have to establish that the variables under the study are approximately normal (Table 6).
| Mean | N | Std. Deviation | Std. Error Mean | ||
|---|---|---|---|---|---|
| Pair 1 | Parasite before Artemether administration for male | 107.42 | 12 | 3.777 | 1.090 |
| Parasite after Artemether administration for male | 41.92 | 12 | 8.743 | 2.524 | |
Table 6: Paired samples statistics for male. Source: SPSS output based on hypothetical samples of males and females under 5.
Tests of normality
The tests of normality overlay a normal curve on actual data, to assess the fit. A significant test means the fit is poor. For Patient 1 (parasite load before treatment - males) the test is not significant; they fit the normal curve well. The conclusion applies for patient 2. (Parasite load before treatment - females). These are the original pairs which are normally distributed so are any other distributions based on them. We test whether the proportion of parasites in the blood follows normal distribution. The test results are shown in Table 7. Both have no significance according Kolmogorov-Smirnov and Shapiro-Wilk tests suggesting that both are approximately normal (Table 8). The fit displays approximately normal curves for both variables (Figures 1A and 1B).
| Factor | Kolmogorov-Smirnov | Shapiro-Wilk | |||||
|---|---|---|---|---|---|---|---|
|
|
Statistic | df | Sig. | Statistic | df | Sig. | |
| Data | Patient 1 | .206 | 12 | .170 | .955 | 12 | .707 |
| Patient 2 | .175 | 12 | .200* | .948 | 12 | .613 | |
Table 7: Tests of normality. Source: SPSS output based on hypothetical samples of males and females under 5.

Figure 1a: Normal curve fitted to observed variables.

Figure 1b: Normal curve fitted to observed variables. Source: SPSS output based on hypothetical samples of males and females under 5.
Testing the Effectiveness of Artemether
Analyses for males
In the descriptive analysis above we have shown that administration of Artemether to male children 0-4 reduces the parasite load by 61% after 24 hours of administration. Now we test the significance of this drop. The test begins by showing correlation for Artemether before and after. At 0.45 the correlation between the before treatment and after treatment levels is not statistically significant. Levels were lower overall, but the change was inconsistent across subjects (Table 8).
| N | Correlation | Sig. | ||
|---|---|---|---|---|
| Pair 1 | Parasite before Artimether administration for male & Parasite after Artimether administration for males | 12 | .450 | .142 |
Table 8 Paired samples correlations for males. Source: SPSS output based on hypothetical samples of males and females under 5.
In Table 7, the Mean column in the paired-samples t test table displays the average difference in parasite count for Artemether experiment between before and after treatment (Table 9).
| Paired Differences | T | df | Sig. (2-tailed) | ||||||
|---|---|---|---|---|---|---|---|---|---|
| Mean | Std. Deviation | Std. Error Mean | 95% Confidence Interval of the Difference | ||||||
| Lower | Upper | ||||||||
| Pair 1 | Parasite before Artemether administration for male - Parasite after Artemether administration for male | 65.500 | 7.810 | 2.255 | 60.538 | 70.462 | 29.051 | 11 | .000 |
Table 9 Paired samples test for males. Source: SPSS output based on hypothetical samples of males and females under 5.
The Std. Deviation column displays the standard deviation of the average difference score. The Std. Error Mean column provides
an index of the variability one can expect in repeated random samples of 12 patients as in this study. The 95% Confidence Interval of the Difference provides an estimate of the boundaries between which the true mean difference lies in 95% of our sample of 12. The t statistic is obtained by dividing the mean difference by its standard error.
The Sig. (2-tailed) column displays the probability of obtaining a t statistic whose absolute value is equal to or greater than the obtained t statistic. Since the significance value for drop in parasite is less than 0.05, we can conclude that the average drop of 62% of parasite per patient is not due to chance variation, and can be attributed to the Artemether. The conclusion from this is that Artemether is a very effective drug for malaria treatment among male’s children 0-4.
The same tests were performed for female’s children which indicated that Across all 12 pairs, parasite load dropped substantially, a drop of 73% after 48 hours from taking Artemether with higher correlation (0.599) and a significant difference from 0.
Testing the Effectiveness of Quartum
Analyses for males
The descriptive Table 10, displays the mean, sample size, standard deviation, and standard error for both groups. Across all 12 pairs, parasite load dropped substantially, a drop of 78% after 24 hours from taking Quartum. Now we have to confirm that this large drop is not due to chance (Table 10).
The descriptive Table 10, displays the mean, sample size, standard deviation, and standard error for both groups. Across all 12 pairs, parasite load dropped substantially, a drop of 78% after 24 hours from taking Quartum. Now we have to confirm that this large drop is not due to chance (Table 10).
| Mean | N | Std. Deviation | Std. Error Mean | ||
|---|---|---|---|---|---|
| Pair 1 | Parasite before Quartum administration for males | 107.0833 | 12 | 4.66044 | 1.34535 |
| Parasite After Quartum administration for males | 29.2500 | 12 | 7.16208 | 2.06752 | |
Table 10 Paired samples statistics for males. Source: SPSS output based on hypothetical samples of males and females under 5.
In Table 11, the Mean column in the paired-samples t test table displays the average difference in parasite count for Quartum experiment between before and after treatment (Table 12).
|
|
N | Correlation | Sig. | |
|---|---|---|---|---|
| Pair 1 | Parasite before Quartum administration for males & Parasite After Quartum administration for males | 12 | .609 | .010 |
Table 11 Paired samples correlations for males. Source: SPSS output based on hypothetical samples of males and females under 5.
| Paired Differences | t | df | Sig. (2-tailed) | ||||||
|---|---|---|---|---|---|---|---|---|---|
| Mean | Std. Deviation | Std. Error Mean | 95% Confidence Interval of the Difference | ||||||
| Lower | Upper | ||||||||
| Pair 1 | Parasite before Quartum administration for males - Parasite After Quartum administration for males | 77.83333 | 5.74984 | 1.65983 | 74.18006 | 81.48660 | 46.892 | 11 | .000 |
Table 12: Paired samples test for males. Source: SPSS output based on hypothetical samples of males and females under 5.
The Std. Deviation column displays the standard deviation of the average difference score. The Std. Error Mean column provides an index of the variability one can expect in repeated random samples of 12 patients as in this study. The 95% Confidence Interval of the Difference provides an estimate of the boundaries between which the true mean difference lies in 95% of our sample of 12. The t statistic is obtained by dividing the mean difference by its standard error.
The Sig. (2-tailed) column displays the probability of obtaining a t statistic whose absolute value is equal to or greater than the obtained t statistic. Since the significance value for drop in parasite is less than 0.05, we can conclude that the average drop of 78% of parasite per patient is not due to chance variation, and can be attributed to the Quartum.
The conclusion from this is that Quartum is a very effective drug for malaria treatment among male children 0-4. The same tests were performed for female’s children which indicated that Across all 12 pairs, parasite load dropped substantially, a drop of 80% after 24 hours from taking Quartum with even higher correlation (0.795) and a significant difference from 0.
Comparison between quartum and artimether
Comparison between quartum and artemether for males: The descriptive Table 13, displays the mean, sample size, standard deviation, and standard error for both groups. For both treatment parasite loads dropped. The percentage difference of the dropped is 71% in favor of Quartum. Now we have to confirm that this large drop is not due to chance (Table 13).
| Mean | N | Std. Deviation | Std. Error Mean | ||
|---|---|---|---|---|---|
| Pair 1 | Parasite after Artemether administration for males | 41.92 | 12 | 8.743 | 2.524 |
| Parasite After Quartum administration for males | 29.2500 | 12 | 7.16208 | 2.06752 | |
Table 13: Paired samples statistics for males. Source: SPSS output based on hypothetical samples of males and females under 5.
The test begins by showing correlation for parasite after Quartum and Artemether administration at (-0.357) the correlation between the Quartum treatment and Artemether treatment levels is inverse butt statistically insignificant. Levels were lower overall, but the change was inconsistent across subjects (Table 14).
| N | Correlation | Sig. | ||
|---|---|---|---|---|
| Pair 1 | Parasite after Artemether administration for males & Parasite After Quartum administration for males | 12 | -.0.357 | .255 |
Table 14: Paired samples correlations for males. Source: SPSS output based on hypothetical samples of males and females under 5.
In Table 15, the Mean column in the paired-samples t test table displays the average difference in parasite count for Quartum and Artemether experiment after treatment.
| Paired Differences | T | df | Sig. (2-tailed) | ||||||
|---|---|---|---|---|---|---|---|---|---|
| Mean | Std. Deviation | Std. Error Mean | 95% Confidence Interval of the Difference | ||||||
| Lower | Upper | ||||||||
| Pair 1 | Parasite after Artemether administration for males - Parasite After Quartum administration for males | 12.66667 | 13.13104 | 3.79061 | 4.32360 | 21.00973 | 3.342 | 11 | .007 |
Table 15: Paired samples test for males. Source: SPSS output based on hypothetical samples of males and females under 5.
The Std. Deviation column displays the standard deviation of the average difference score. The Std. Error Mean column provides an index of the variability one can expect in repeated random samples of 12 patients as in this study. The 95% Confidence Interval of the Difference provides an estimate of the boundaries between which the true mean difference lies in 95% of our sample of 12. The t statistic is obtained by dividing the mean difference by its standard error.
The Sig. (2-tailed) column displays the probability of obtaining a t statistic whose absolute value is equal to or greater than the obtained t statistic. Since the significance value for drop in parasite is less than 0.05, we can conclude that the average drop of (71%) of parasite per patient is not due to chance variation, and can be attributed to the treatment.
The conclusion from this is that Quartum is more effective drug for malaria treatment among male’s children 0-4 than Artemether. The conclusion from this is that Quartum is a very effective drug for malaria treatment among male children 0-4. The same tests were performed for female’s children which indicated that across all 12 pairs, parasite load dropped substantially, a drop of 80% after 24 hours from taking Quartum with moderate correlation (0.524) and a significant difference from 0. The conclusion to be drawn from this is that Quartum is more effective drug for malaria treatment among female’s children 0-4 than Artemether.
Conclusion
At present, probably the most common drugs commonly used, at last in Africa, and has some potency are the so-called artesunatemefloquine and artemether-lumefantrine, but this does not prevent that there is resistance to these drugs from the majority of patients. Using a Monte-Carlo like trial, this illustrative study calculated the cure rate of malaria using these regimens found that both are highly effective. The study revealed that artemetherlumefantrine is more effective drug for malaria treatment among both males and females children 0-4 than Artemether This result has been confirmed for both males and females. If these results were drawn from real controlled data, then one would recommend artesunate-mefloquine as first line antimalarial. We recommend that such trial be sponsored and conducted in Africa.
References
- Snow RW, Guerra CA, Noor AM, Myint HY, Hay SI (2005) The global distribution of clinical episodes of Plasmodium falciparum malaria. Nature 434: 214-217.
- Timothy BS (2015) Marco Taboga. 3rd edn. Amazon Create Space Publication.
- Bartlett MS, Kendall DG (1996) The Statistical Analysis of Variance-Heterogeneity and the Logarithmic Transformation. Royal Statis Society J 8: 128-138.
- Abealgabar S (2017) Test derivation for paired test. Unpublished Master’s Thesis, University of Gezira, Wad Medani, Sudan.
- Adeel A, Alnory A (2002) Socio-economic and demographic effects of malaria eradication: Case study- Gezira State. Soc Sci Med 2: 847-850.
- Alnory A (2003) Statistics for Medical Sciences. 1st edn. Silver Star Printing House, Khartoum, Sudan.

Open Access Journals
- Aquaculture & Veterinary Science
- Chemistry & Chemical Sciences
- Clinical Sciences
- Engineering
- General Science
- Genetics & Molecular Biology
- Health Care & Nursing
- Immunology & Microbiology
- Materials Science
- Mathematics & Physics
- Medical Sciences
- Neurology & Psychiatry
- Oncology & Cancer Science
- Pharmaceutical Sciences