Human Kidney Injury Molecule-1 (Kim-1) Level as an Early Marker for Diabetic Nephropathy in Egyptian Type 2 Diabetic Patients
EL-Attar HA1*, Khalil GI1 and Gaber EW2
1Department of Chemical Pathology, Alexandria University, Egypt
2Department of Internal Medicine, Alexandria University, Egypt
- *Corresponding Author:
- EL-Attar HA
Department of Chemical Pathology, University of Alexandria, Egypt.
Tel: +201020244286
E-mail: hoda.ali55151@yahoo.com
Received date: February 21, 2017; Accepted date: March 07, 2017; Published date: March 10, 2017
Citation: EL-Attar HA, Khalil GI, Gaber EW. Human Kidney Injury Molecule-1 (Kim-1) Level as an Early Marker for Diabetic Nephropathy in Egyptian Type 2 Diabetic Patients. Jour Ren Med. 2017, 1:1.
Abstract
Background: Human Kidney Injury Molecule-1 (KIM-1) is produced in the affected segments of the proximal renal tubule whenever there is a pathophysiological state resulting in dedifferentiation of the epithelium. The kidney injury molecule-1 is a type 1 transmembrane glycoprotein (339 aa). KIM-1 ectodomain is cleaved and shed in a metalloproteinase-dependent fashion. The soluble KIM-1 protein that appears in the urine of humans is about 90 KDa. All forms of chronic kidney disease, including diabetes, are associated with tubulo-interstitial injury.
Aim: The current study was performed try to assess use of urinary KIM-1/Creatinine ratio as a sensitive diagnostic tool for renal injury in the urine of patients with type 2 diabetic Egyptian patients.
Methods: Eighty subjects were subjected to clinical examination included and subdivided as 20 apparently healthy control volunteers (group I) and 60 diabetic patients which were divided into 3 subgroups (Group II, Group III and Group IV) of 20 patients each: according to ACR: (ACR<30 mg/g, 30 – 299 mg/g and ≥ 300 mg/g respectively). All were subjected to laboratory investigations which included: Morning mid-stream urine sample for: 1) Complete urine analysis. 2) Quantitative measurement of urinary albumin. 3) Urinary creatinine. 4) Calculation of urinary albumin to creatinine ratio. 5) Measurement of KIM-1 (ELISA) 6) Calculation of KIM-1 to creatinine ratio. Calculation of estimated glomerular filtration rate (eGFR). Estimation of: fasting and post prandial glucose, urea and creatinine serum levels and blood level of glyclated hemoglobin (HbA1c).
Results: Urinary KIM-1 levels were increased with the progression of nephropathy. Urinary KIM-1 levels were independent risk factor of (eGFR) and albuminuria in diabetic patients. Urinary KIM-1/Cr ratio was more sensitive than KIM-1. There was no correlation between urinary KIM-1/Cr ratio and GFR in all studied groups.
Conclusion: Urinary KIM-1/Cr ratio is a sensitive, noninvasive diagnostic tool for kidney affection in Type 2 diabetic Egyptian patients that seem to predict renal injury in early period independent of albuminuria. Due to lack of correlation, both KIM-1/Cr and Alb/Cr ratios are required to be calculated for Type 2 diabetic patients.
Recommendations: The use of KIM-1/Cr ratio as a diagnostic tool for kidney affection by measuring it in urine of Type 2 diabetic patients at risk of chronic kidney disease.
Keywords
Diabetes; Type-2 Diabetes; Albuminuria; Albumin to creatinine ratio; Human kidney injury molecule-1; KIM-1
Introduction
Human Kidney Injury Molecule-1(KIM-1) is an immunoglobulin superfamily cell- surface protein acting as an epithelial cell scavenger receptor involved in phagocytosis. KIM-1 is able to recognize apoptotic cell surface – specific epitopes phosphatidylserine and oxidized lipoproteins [1].
Kidney injury molecule-1 is a type 1 transmembrane glycoprotein (339 amino acid residues in length) with an N-terminal ectodomain (270 amino acid residues) consisting of an extracellular portion, one transmembrane domain and an intracellular domain [2,3].
In its extracellular portion, there is six-cysteine immunoglobulinlike domain, two N-glycosylation sites and a threonine/serine and proline rich domain characteristic of mucin-like O-glycosylated proteins. The cytoplasmic domain of KIM-1 is relatively short and possesses a potential phosphorylation site, with three tyrosine residues including a predicted tyrosine kinase phosphorylation motif in the cytosolic domain [4,5].
KIM-1 expression is markedly upregulated in rats 24-48 hours after kidney ischemia. It is produced in the affected segments of the proximal renal tubule whenever there is a pathophysiological state resulting in dedifferentiation of the epithelium. Dedifferentiation is a very early manifestation of epithelial cell response to injury [6] In case of ischemia or toxic injury, a pathophysiological state results in dedifferentiation of the epithelium [7,8]. Dedifferentiation is a very early manifestation of the epithelial response to injury [9].
KIM-1 mediates engulfment of apoptotic and necrotic debris in the lumen of injured epithelial tubules. It mediates phagocytosis not only by binding to the cell surface but also by triggering internalization that transforms epithelial cells into semiprofessional phagocytes [1]. It helps to avoid the undesirable attachment of exfoliated cells to one another or fibronectin so as to reduce cast formation and tubular obstruction [9-11].
Diabetic nephropathy (DN), a common complication of diabetes mellitus, is one of the most common causes of end-stage renal disease (ESRD) (12). Its pathogenesis involves complex structural changes, including glomerular and tubular hypertrophy, which is one of the early adaptive renal structural features with progressive accumulation of extracellular matrix component in the glomerular mesangium and tubulo-interstitium [12,13]. All forms of chronic kidney disease, including diabetes, are associated with tubulo-interstitial injury [14,15].
Tubular involvement proved to precede glomerular involvement because several tubular proteins and enzymes are detectable even before the appearance of microalbuminuria and rise in serum creatinine [15]. If tubular lesion is early detected, diabetic nephropathy could be probably controlled by good glycemic control [16,17]. Measurement of serum urea nitrogen, creatinine and urinary protein reflect functional changes in filtration capacity but are not true ‘injury markers [18].
The utility of KIM-1 in urine as a non-invasive marker of kidney injury, urinary levels of KIM-1 increased prior to the appearance of casts in the urine [10]. The kidney epithelium is particularly susceptible to injury due to the character of its blood supply and its ability to concentrate many toxins [5]. KIM-1 ectodomain is cleaved and shed in a metalloproteinase-dependent fashion converts epithelial cells into highly phagocytic cells [1]. The soluble KIM-1 protein that appears in the urine of humans is about 90 Kda [10].
The absence of KIM-1 expression in normal kidney; its marked upregulation and insertion into the apical membranes of the proximal tubules; its persistence in the epithelial cells until the cell has completely recovered; the rapid and robust cleavage of the ectodomain and the ex vivo room temperature stability of the ectodomain. These characteristics might make KIM-1 as an ideal biomarker of kidney injury [5].
Aim
The current study was performed try to assess the use of KIM-1/ Cr ratio level in the urine as a sensitive diagnostic tool for renal injury in type 2 diabetic patients.
Subjects and Methods
20 apparently healthy controls (Group I) and 60 Type 2 diabetic patients which were collected from Nephrology department of MRI, Alexandria University Egypt. They were divided into 3 subgroups (Group II, Group III and Group IV) of 20 patients each: according to ACR: (ACR<30 mg/g, 30 – 299 mg/g and ≥ 300 mg/g respectively were subjected to complete clinical examination and laboratory investigations which included: Morning mid-stream urine sample, obtained using disposable cups without preservatives for: 1) Complete urine analysis. 2) Quantitative measurement of urinary albumin. 3) Urinary creatinine. 4) Calculation of urinary albumin to creatinine ratio. 5) Measurement of KIM-1 (ELISA). 6) Calculation of KIM-1 to creatinine ratio. Calculation of estimated glomerular filtration rate. Blood samples were obtained in the morning after an overnight fast for estimation of: fasting and post prandial glucose, urea, creatinine and alanine aminotransferase serum levels and blood level of glycated hemoglobin (HbA1c) [19,20].
Statistical Analysis
Statistical analysis was done using the Predictive Analytics Software (PASW Statistics 18). Testing for normality, Kolmogorov- Smirnov, Shapiro –Wilk test and D’Agestino tests were used. For abnormally distributed data, Mann-Whitney Test was used. If more than two populations were analysed, Kruskal Wallis test was used. Spearman correlation coefficient (rho). was used for correlations between variables. Significance with P value ≤ 0.05 were considered statistically significant [21,22].
Results
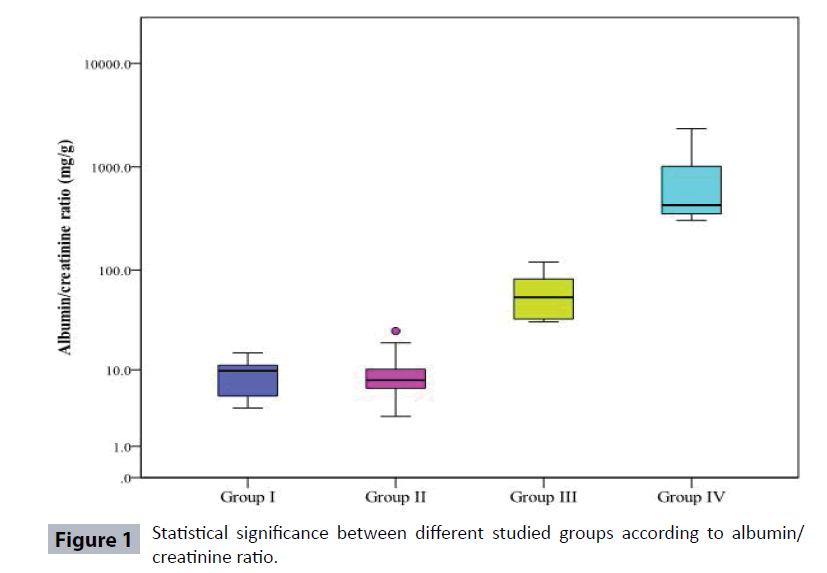
Table 1 and Figure 1 show demographic data, duration and treatment of diabetes and it has been found that diabetic patient’s groups (II, III, and IV) showed a significant increase in age as compared to controls. As regard the gender, males constituted 45%, 50%, 30% and 60% in groups I, II, III, and IV respectively. Type 2 diabetic patients Group IV showed a significant increase in the duration of diabetes when compared to both Group II and Group III.
| Group I | Group II | Group III | Group IV | |||||
|---|---|---|---|---|---|---|---|---|
| Variables | No | % | No | % | No | % | No | % |
| Age | ||||||||
| Min. – Max. | 26.0 – 60.0 | 30.0 – 68.0 | 42.0 – 78.0 | 35.0 – 70.0 | ||||
| Median | 39.5 | 39.5 | 57 | 56 | ||||
| p1 | -- | <0.001* | <0.001* | <0.001* | ||||
| p2 | -- | -- | 0.114 | 0.857 | ||||
| p3 | -- | -- | -- | 0.16 | ||||
| Weight | ||||||||
| Min. – Max. | 69.0 – 94.0 | 75.0 – 110.0 | 85.0 – 107.0 | 67.0 – 104.0 | ||||
| Median | 85 | 87 | 94 | 90 | ||||
| p1 | -- | 0.003* | 0.001* | 0.001* | ||||
| p2 | -- | -- | 0.034* | 0.482 | ||||
| p3 | -- | -- | -- | 0.15 | ||||
| Sex | ||||||||
| Male | 9 | 45 | 10 | 50 | 6 | 30 | 12 | 60 |
| Female | 11 | 55 | 10 | 50 | 14 | 70 | 8 | 40 |
| p1 | -- | 1 | 0.197 | 0.525 | ||||
| p2 | -- | -- | 0.197 | 0.525 | ||||
| p3 | -- | -- | -- | 0.057 | ||||
| Duration of diabetes | ||||||||
| Min. – Max. | -- | 1.0 – 18.0 | 3.0 – 20.0 | 5.0 – 26.0 | ||||
| Median | -- | 6.5 | 9 | 12.5 | ||||
| p1 | -- | -- | -- | - | ||||
| p2 | -- | -- | 0.183 | 0.001* | ||||
| p3 | -- | -- | -- | 0.039* | ||||
| Treatment | ||||||||
| Oral | 0 | 0 | 19 | 95 | 16 | 80 | 20 | 100 |
| Insulin | 0 | 0 | 1 | 5 | 4 | 20 | 0 | 0 |
| p1 | -- | -- | -- | -- | ||||
| p2 | -- | -- | 0.342 | 1 | ||||
| p3 | -- | -- | -- | 0.106 | ||||
Group I: Controls.
Group II: Type2 diabetic patients with ACR less than 30 mg/g.
Group III: Type 2 diabetic patient with ACR = 30-299 mg/g.
Group IV: Type 2 diabetic patients with ACR ≥ 300 mg/g.
p1: Statistical significance from control (Group I).
p2: Statistical significance from Group II.
p3: Statistical significance between Groups III and IV.
Table 1 Comparison between studied groups according to demographic data.
Table 2 shows some laboratory measurements of some chemical parameters in the studied subjects and the eGFR showed only a significant increase when Group IV patients was compared to controls.
| Group I | Group II | Group III | Group IV | |
|---|---|---|---|---|
| FSG( mg/dl) | ||||
| Min. – Max. | 70.0 – 106.0 | 90.0 – 280.0 | 95.0 – 298 | 96.0 – 436.0 |
| Median | 90.5 | 124 | 159 | 187.5 |
| p1 | <0.001* | <0.001* | <0.001* | |
| p2 | 0.176 | 0.005* | ||
| p3 | 0.267 | |||
| PP (mg/dl) | ||||
| Min. – Max. | 80.0 – 120.0 | 117.0 – 393.0 | 115.0 – 389.0 | 129.0 – 489.0 |
| Median | 95 | 177 | 230 | 273 |
| p1 | 0.001* | <0.001* | <0.001* | |
| p2 | 0.168 | 0.004* | ||
| p3 | 0.117 | |||
| HbA1C (%) | ||||
| Min. – Max. | 4.65 – 6.0 | 5.50 – 12.10 | 6.90 – 13.50 | 6.90 – 14.80 |
| Median | 5.15 | 7.45 | 8.35 | 9.55 |
| p1 | -- | <0.001* | <0.001* | <0.001* |
| p2 | -- | -- | 0.034* | 0.482 |
| p3 | -- | -- | -- | 0.15 |
| Creatinine (mg/dl) | ||||
| Min. – Max. | 0.70 – 1.29 | 0.70 – 2.30 | 0.70 – 1.50 | 0.80 – 1.72 |
| Median | 1.02 | 1 | 1.05 | 1.21 |
| p1 | -- | 0.146 | 0.275 | 0.006* |
| p2 | -- | -- | 0.712 | 0.175 |
| p3 | -- | -- | -- | 0.086 |
| Urea (mg/dl) | ||||
| Min. – Max. | 18.0 – 39.0 | 22.0 – 59.0 | 25.0 – 63.0 | 25.0 – 67.0 |
| Median | 27.5 | 32 | 34.5 | 38.5 |
| p1 | -- | 0.016* | 0.002* | <0.001* |
| p2 | -- | -- | 0.533 | 0.116 |
| p3 | -- | -- | -- | 0.202 |
Table 2 Statistical significance between the studied groups according to FSG (mg/dl), PP (mg/dl), HbA1C (%), Urea (mg/dl), Creatinine (mg/dl), CRP (mg/L), ALT (U/L) and eGFR (ml/min/1.73 m2).
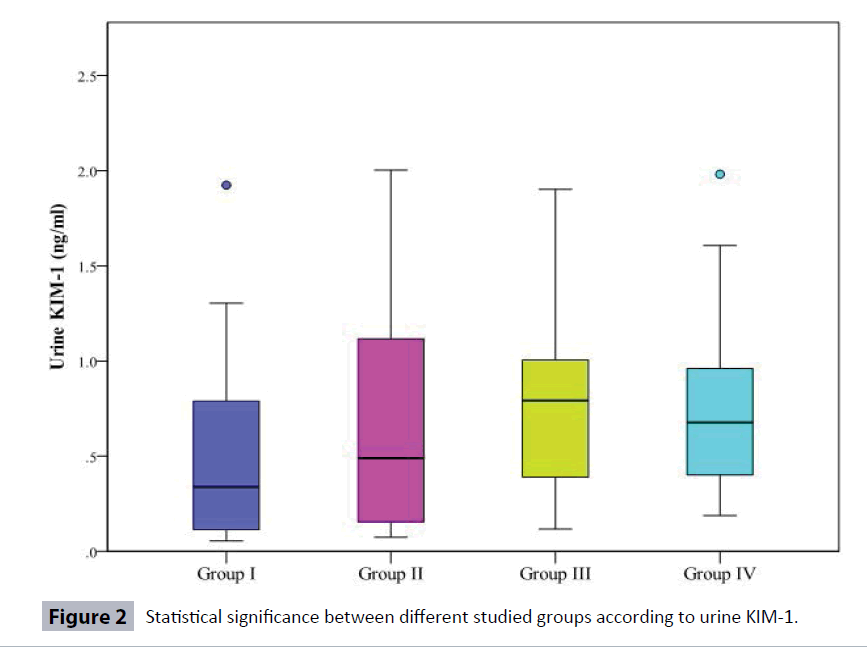
Table 3 and Figure 2 show that urinary KIM-1 was significantly increased in Type 2 diabetic patients (Group III) and (Group IV) when compared to Controls (Group I). Also, urinary KIM-1/ creatinine (KIM-1/Cr) ratio was more sensitive than KIM-1 as it was significantly increased in Type 2 diabetic patients (the three groups II, III, IV) when compared to Controls. Moreover, urinary KIM-1/Cr ratio was significantly increased in Type 2 diabetic patients (Group IV) when compared to (Group II).
| Variables | Group I | Group II | Group III | Group IV |
|---|---|---|---|---|
| GFR (ml/min/1.73m2) | ||||
| Min. – Max. | 77.0 – 166.0 | 46.0 – 162.0 | 47.0 – 146.0 | 60.0 – 133.0 |
| Median | 106.5 | 86.50 | 91.0 | 78.0 |
| p1 | -- | 0.228 | 0.285 | 0.005* |
| p2 | -- | -- | 0.968 | 0.372 |
| p3 | -- | -- | -- | 0.330 |
| ALT(U/L) | ||||
| Min. – Max. | 10.0 – 36.0 | 10.0 – 46.0 | 10.0 – 48.0 | 12.0 – 46.0 |
| Median | 18.50 | 21.0 | 18.50 | 29.50 |
| p1 | -- | 0.597 | 0.860 | 0.010* |
| p2 | -- | -- | 0.935 | 0.076 |
| p3 | -- | -- | -- | 0.110 |
Group I: Controls.
Group II: Type 2 diabetic patients with ACR less than 30 mg/g.
Group III: Type 2 diabetic patient with ACR = 30-299 mg/g.
Group IV: Type 2 diabetic patients with ACR ≥ 300 mg/g.
p1: Statistical significance from control (Group I).
p2: Statistical significance from Group II.
p3: Statistical significance between Groups III and IV.
Table 3 Statistical significance between the studied groups according to FSG (mg/dl), PP (mg/dl), HbA1C (%), Urea (mg/dl), Creatinine (mg/dl), ALT (U/L) and eGFR (ml/min/1.73 m2).
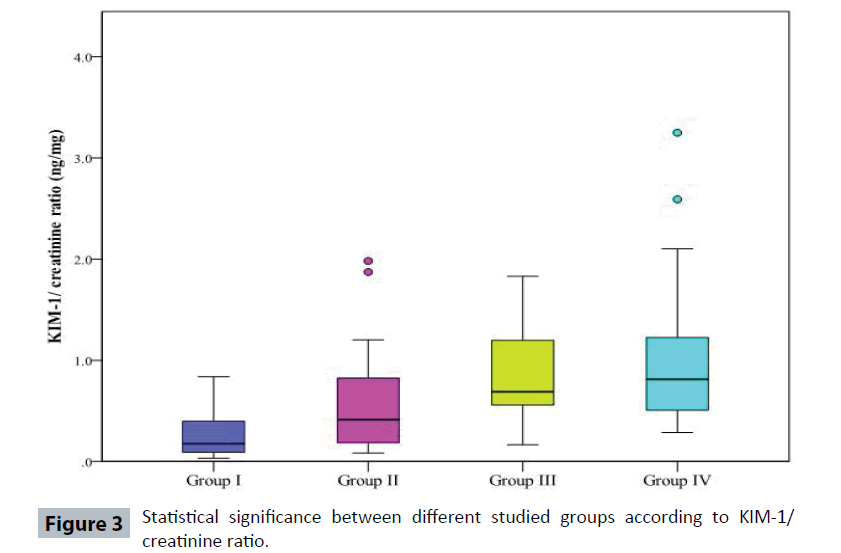
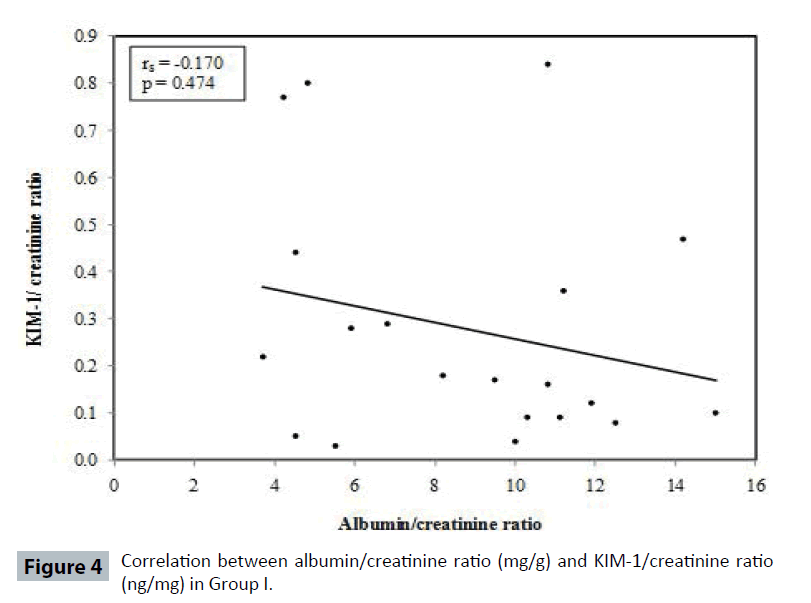
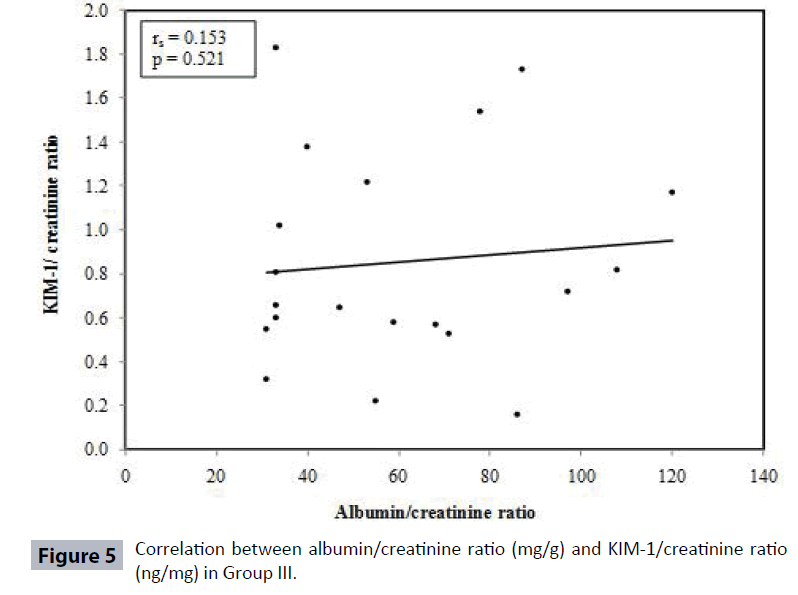
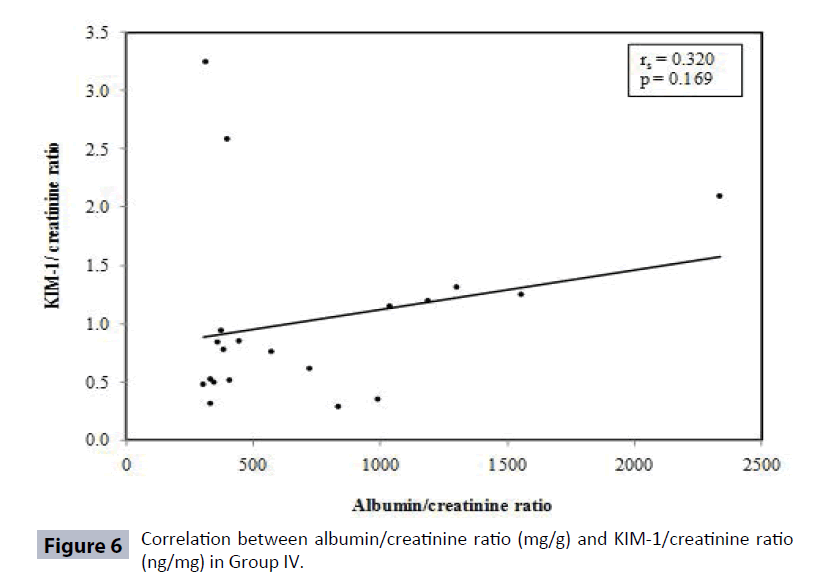
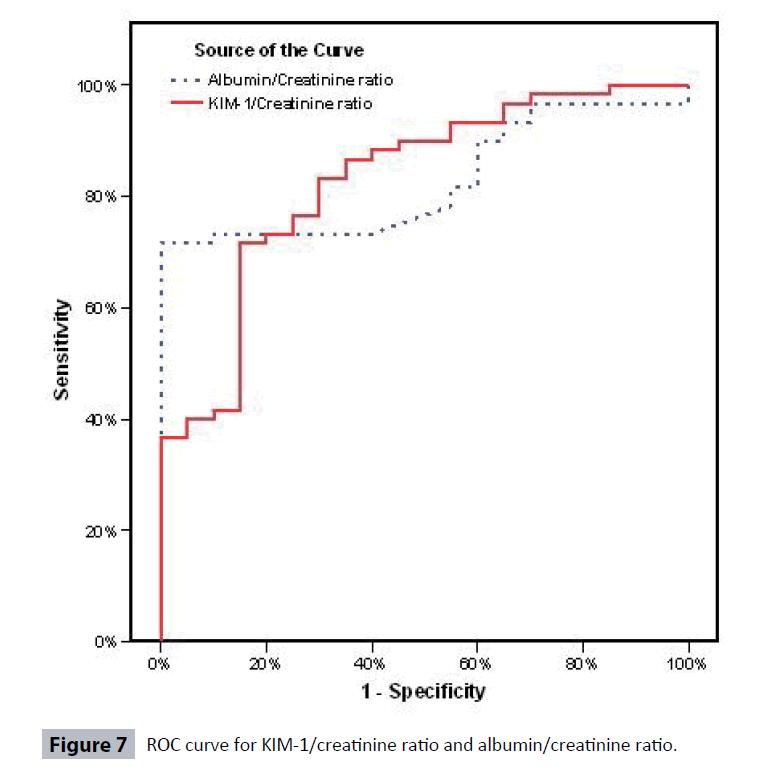
Table 4 and Figures 3-6 show no correlation was found between KIM-1/Cr ratio and albumin/creatinine (Alb/Cr) ratio in Group I (controls), Group III and Group IV patients. Tables 5 and 6 shows that by studying the clinical sensitivity, specificity and efficiency of KIM-1/creatinine ratio and albumin/ creatinine ratio, KIM-1/Cr ratio and Alb/Cr ratio were of the same sensitivity (sensitivity=71.67% for both), while Alb/Cr ratio (specificity=100%) was more specific than KIM-1/Cr ratio (specificity= 85%). As regard efficiency, it has been found that albumin /creatinine ratio (efficiency =78.75%) was more efficient than KIM-1/ creatinine ratio (efficiency=75%). By drawing ROC curve for KIM-I/Cr ratio and albumin/creatinine ratio, the area under the curve was the same for both (AUC= 0.828) with p value highly significant (P<0.001) (Figure 7).
| Variables | Group I | Group II | Group III | Group IV |
|---|---|---|---|---|
| Urine albumin mg/l | ||||
| Min. – Max. | 7.0 – 30.0 | 2.70 – 33.10 | 11.10 – 141.0 | 175.0 – 1000.0 |
| Median | 13.50 | 8.55 | 39.95 | 448.70 |
| p1 | 0.025* | <0.001* | <0.001* | |
| p2 | <0.001* | <0.001* | ||
| p3 | <0.001* | |||
| Urine creatinine mg/dl | ||||
| Min. – Max. | 90.0 – 242.0 | 45.0 – 225.0 | 26.0 – 190.0 | 42.0 – 210.0 |
| Median | 180.50 | 102.50 | 85.0 | 61.50 |
| p1 | <0.001* | <0.001* | <0.001* | |
| p2 | 0.148 | 0.047* | ||
| p3 | 0.250 | |||
| Albumin/creatinine ratio mg/g | ||||
| Min. – Max. | 3.70 – 15.0 | 2.97 – 25.0 | 13.0 – 120.0 | 83.3 – 2335.70 |
| Median | 9.75 | 7.70 | 54.0 | 402.65 |
| p1 | 0.860 | <0.001* | <0.001* | |
| p2 | <0.001* | <0.001* | ||
| p3 | <0.001* | |||
| Urine KIM-1 ng/ml | ||||
| Min. – Max. | 0.06 – 1.92 | 0.08 – 2.0 | 0.12 – 1.90 | 0.19 – 1.98 |
| Median | 0.34 | 0.49 | 0.79 | 0.68 |
| p1 | 0.402 | 0.045* | 0.039* | |
| p2 | 0.379 | 0.358 | ||
| p3 | 0.745 | |||
| KIM-1/ Creatinine ratio ng/mg | ||||
| Min. – Max. | 0.03 – 0.84 | 0.082 – 1.98 | 0.16 – 1.83 | 0.29 – 3.25 |
| Median | 0.17 | 0.41 | 0.69 | 0.81 |
| p1 | 0.023* | <0.001* | <0.001* | |
| p2 | 0.058 | 0.020* | ||
| p3 | 0.787 | |||
Group I: Control.
Group II: Type2 diabetic patients with ACR less than 30 mg/g.
Group III: Type 2 diabetic patient with ACR=30-299 mg/g.
Group IV: Type 2 diabetic patients with ACR≥300 mg/g.
p1: Statistical significance from control (Group I).
p2: Statistical significance from Group II.
p3: Statistical s
Table 4 Statistical significance between different studied groups according to Urinary levels of albumin, creatinine, albumin/ creatinine ratio, KIM-1, and KIM-1/creatinine ratio.
Table 5 shows absence of significant correlation between KIM-1/ Cr ratio and estimated glomerular filtration rate.
| Groups | Rho | P |
|---|---|---|
| Group I | -0.170 | 0.474 |
| Group II | 0.573* | 0.008 |
| Group III | 0.153 | 0.521 |
| Group IV | 0.320 | 0.169 |
| Total sample | 0.512* | <0.001 |
Table 5: Correlation between Albumin/creatinine ratio (mg/g) and KIM- 1/ creatinine ratio (ng/mg) in each studied groups.
Discussion
Type 2 diabetes is a chronic metabolic disorder that results from defects in both insulin action and secretion, which is now increasing at pace throughout the world, and its intensity of occurrence can be inferred by the International Diabetes Federation (IDF) 2006 report stating that around 246 million people worldwide are suffering from this disease and the prevalence is expected to cross the figure of 380 million within 20 years [23].
Egypt is currently in the top 10 countries worldwide with the highest number of people with diabetes. It is estimated to reach 7.7 million Egyptians by 2025 [24].
To estimate the state of glycemic control in diabetic patients, fasting, postprandial glucose levels and HbA1c were measured. While a HbA1c of less than 7% is considered the ultimate goal for diabetic therapy, the American Diabetes Association (ADA) recommends physicians and patients consider making therapeutic changes when a patient’s HbA1c rises to greater than 8%. Improving glycemic control was proved to decrease the risk of diabetic complications in both Type 1 and Type 2 diabetic patients [25].
In the present study, HbA1c in the Controls (Group I) ranged from 4.65 – 6.0% (median=5.15%), fasting and postprandial glucose levels ranged from 70 – 106 mg/dl (median=90.5 mg/ dl) and 80 – 120 mg/dl (median=95 mg/dl) respectively. While in Group II, HbA1c ranged from 5.5 – 12.1 % (median=7.45%), FSG, PP ranged from 90 – 280 mg/dl (median=124 mg/dl) and 117 – 393 mg/dl (median= 177 mg/dl), in Group III, HbA1c ranged from 6.9 – 13.5% (median=8.35%), FSG, PP ranged from 95 – 298 mg/ dl (median=159 mg/dl) and 115-389 mg/dl (median=230 mg/dl), and in Group IV, HbA1c ranged from 6.9 – 14.8% (median=9.55%), FSG, PP ranged from 96 – 436 mg/dl (median= 187.5 mg/dl) and 129 – 489 mg/dl (median=273 mg/dl). There was a significant increase between patients regarding fasting, postprandial glucose levels and HbA1c as compared to Controls (p1<0.001) for all (Table 2).
Fasting serum glucose (FSG) and PP showed a significant increase in (Group IV) when compared to Type 2 diabetic patients in (Group II) (P=0.005, P=0.004 respectively). While HbA1C showed a significant increase in Type 2 diabetic patients in (Group III) when compared to Group II patients (P=0.034). Such findings support that the lack of tight glycemic control is a risk factor for developing diabetic complications such as diabetic nephropathy [16,17].
In the present study, there was a significant increase in serum levels of urea in all patients’ groups when compared to Controls. However, serum levels of creatinine were only significantly elevated in diabetic patients with ACR≥300mg/g (Group IV) when compared to Controls (Group I) (Table 2).
In the present study, no correlation was found between KIM-1/Cr ratio and urea and creatinine (Table 5).
In the present work, estimated glomerular filtration rate (eGFR) ranged in the Controls (Group I) from 77-166 ml/min/1.73 m2 (median= 106.5 ml/min/1.73 m2) while in (Group II) ranged from 46- 162 ml/min (median= 86.5 ml/min/1.73 m2). GFR in patients (Group III) ranged from 47-146 ml/min (median=91 ml/min/1.73 m2) and in (Group IV), it ranged from 60-133 ml/min/1.73 m2 (median=78 ml/min/1.73 m2). There was only a significant decrease in eGFR in Group IV when compared to Controls (Group I) with (P= 0.005) (Table 2) supporting that the change from normal to overt nephropathy is accompanied by a decrease in the eGFR [26].
In the present study, no correlation was found between KIM-1/Cr ratio and eGFR (Table 5).
Nephropathy is a potentially devastating complication of diabetes causing much morbidity and associated with a considerable risk of premature cardiovascular mortality [27,28]. It is the most common cause for end stage renal disease and for patients entering in chronic dialysis care worldwide. It occurs in 25 – 40% of patients with diabetes [29].
Although diabetic nephropathy was traditionally considered a primary glomerular disease, it is now widely accepted that the rate of deterioration of function correlate best with the degree of renal tubulo-interstitial fibrosis which is thought to be a better predictor of disease progression and long term prognosis than is the severity of damage to glomeruli and reflect the role of PCT in orchestrating renal interstitial fibrosis in DN as a result of glucose-dependent alteration in the PCT function [15].
As structural alterations related to diabetes mellitus may be divided into early adaptive alterations and the later pathological changes associated with progression of nephropathy, tubular cell hypertrophy is one of the early adaptive renal structural features of diabetes. Most of these changes can be reversed at an early stage by good glycemic control, but they persist in many patients and may be important in the later development of clinical nephropathy [16].
A key step linking glucotoxicity to cell dysfunction in diabetic nephropathy is the excess of extracellular matrix within the glomerulus and interstitium. In addition, hyperglycemia is responsible for hemodynamic alterations such as glomerular hyperfiltration, shear stress, and microalbuminuria [30,31].
Clinical progression to diabetic nephropathy is defined in terms of changes in urinary albumin excretion rate and decline in glomerular filtration rate [26]. Therefore, albuminuria can be considered as a marker of nephropathy rather than a predictor of renal structural changes [18].
Tubular involvement has been proved to precede glomerular involvement in diabetic kidney disease because several tubular proteins and enzymes are detectable even before the appearance of microalbuminuria and rise in serum creatinine, such as KIM-1, B- NAG, β2-microglobulin, and RBP [10,15].
The present study included eighty subjects divided into two main groups. The control group (Group I) included twenty apparently healthy subjects of comparable socioeconomic status to the patients group. The patients group included sixty diabetic patients. These patients were further sorted into 3 subgroups according to their urinary albumin-creatinine ratio (31). Group II included twenty diabetic subjects with (ACR) less than 30 mg/g. Group III included twenty with (ACR)=30- 299 mg/g and Group IV included twenty diabetic subjects with (ACR) equal to or more than 300 mg/g.
In the present study, kidney injury molecule-1 (KIM-1) in urine in the controls (Group I) ranged from 0.06-1.92 ng/ml (median 0.34 ng/ml), in (Group II) KIM-1 ranged from 0.08-2.0ng/ml (median 0.49 ng/ml), in (Group III) KIM-1 ranged from 0.12- 1.90 ng/ml (median 0.79 ng/ml) and in (Group IV) KIM-1ranged from 0.19- 1.98 ng/ml (median 0.68 ng/ml). There was a significant increase in urinary KIM-1 level between both Group III and Group IV and Controls with p value 0.045 and 0.039 respectively (Table 3).
But when calculating KIM-1 to creatinine ratio, it was found that Kidney injury molecule-1 to creatinine ratio in the Controls (Group I) ranged from 0.03 – 0.84 ng/mg (median 0.17ng/mg). While in diabetic patients who were subdivided according to the ACR, KIM-1/Cr ratio in Group II ranged from 0.082 – 1.98 ng/mg (median 0.41ng/mg). KIM-1/Cr ratio in Group III ranged from 0.16 – 1.83 ng/mg (median 0.69 ng/mg) and in Group IV ranged from 0.29- 3.25 ng/mg (median 0.81ng/mg) (Table 3).
KIM-1/Cr ratio in Group II was significantly increased from the Controls (Group I) with p value 0.023. While KIM-1/Cr ratios in Group III and IV were highly significantly increased from the control with p value<0.001 for both. Also, there was significant increase in KIM-1/ Cr ratio in Group IV as compared to Group II (P 0.02) (Table 3).
To the best of knowledge, KIM-1 has not been investigated in humans in diabetes; however, it has been tested experimentally in AKD and CKD caused by diseases other than diabetes [10]. It can be assumed that the significant increase of KIM-1/Cr ratios in Groups II, III, IV than controls (Group I) is due to injury of proximal tubules with shedding of KIM-1 in urine during tubular injury making it readily detectable in the urine of diabetics. While the lack of significant changes between Group II and III and between Group III and IV may be due to lack of remarkable tubular structural injury between Group II and III and between III and IV. In contrast, the significant changes between Groups II and IV may be related to marked tubular injury.
In the present work, urinary albumin in the Controls (Group I) ranged from 7.0-30 mg/L (median 13.5 mg/L), in Group II 2.7-33.1 mg/L (median 8.55 mg/L), in Group III 13.1-141 mg/L (median 39.95 mg/L) and in Group IV 180-1750 mg/L (median 497.0 mg/L). There was a significant increase in urinary albumin in groups II, III and IV with p value 0.025, <0.001 and <0.001 respectively when compared to (Group I) (Table 3).
There was a significant increase in urinary albumin in both Group III and Group IV when compared to diabetic patients with Group II (P<0.001). Also, there was a significant increase in urinary albumin when comparing Group IV to Group III (P<0.001) (Table 3).
But when albumin was calculated to creatinine ratio, it was found that albumin to creatinine in the Controls (Group I) ranged from 3.7- 15 mg/g (median 9.75 mg/g). While in Group II, it ranged from 2.97 – 25 mg/g (median 7.7 mg/g), in Group III, it ranged from 30 – 120 mg/g (median 54 mg/g) and in Group IV, and it ranged from 304- 2335.7 mg/g (median 426.85 mg/g). (ACR) showed no significant changes between Type 2 diabetics (Group II) when compared to Controls (Group I), but albumin creatinine ratios showed a significant increase in (Group III and IV) when compared to Controls (Group I) with (p<0.001) for both. Also, a significant increase in albumin to creatinine ratio was found between Group III and IV when compared to (Group II) and between Group III and IV (P<0.001 for all) (Table 3).
It has been known that other causes of increased albumin excretion including urinary tract infection, hematuria, acute febrile illness, vigorous exercise, short-term pronounced hyperglycemia, uncontrolled hypertension, and heart failure were excluded in this study. Thus, the increases albumin excretion in this study can be attributed to the diabetic state [32]. In the early stage of diabetic nephropathy, the proximal tubule plays a major role in the development of albuminuria preceded by peptiduria [33].
In the current study, KIM-1/Cr ratio was not correlated with ACR in control group and Type 2 diabetic patients Group III and IV (Table 4) (Figures 4-6). Also, KIM-1/ Cr ratio is independent of albuminuria (Table 4).
Van Timmeren et al. [34]. stained for the presence of KIM-1 protein in tissue specimens from 102 patients who underwent a kidney biopsy for a variety of kidney diseases and showed that positive KIM-1 staining in dedifferentiated proximal tubular cells correlated with tubulo-interstitial fibrosis and inflammation. In a subset of patients who underwent urine collection near the time of biopsy, urinary KIM-1 levels correlated with the tissue expression of KIM-1 [10].
In agreement to our work, where KIM-1 did not correlate positively with proteinuria, previous researchers (5) found that KIM-1 expression correlated positively with interstitial damage, inflammation, and serum creatinine, but did not correlate with proteinuria. To explain this, it was suggested that not all proteinuria is accompanied by tubulointerstitial damage and progressive decline in renal function, using minimal change disease (MCD) as an example. However, Waanders et al. [35] found a correlation of the studied proteinuria and KIM-1 by analyzing the effect of anti-proteinuric regimens of diet and RAAS inhibition on KIM-1 and NAG. In non-diabetic stage III CKD, decreased urinary KIM-1 correlated with decreased proteinuria in each interventional group studied, but not with blood pressure or creatinine clearance. They suggested that improvement of proteinuria resulted in decreased tubulointerstitial damage as reflected by urinary KIM-1 [35].
In the present study, by studying the clinical sensitivity, specificity and efficiency for urinary KIM-1/creatinine ratio, using a cut off value of 0.399 ng/mg as in a previous study [36] or better the best cut off in our study 0.467 ng/mg, the sensitivity was 71.67%, specificity 85%, positive predictive value was 93.48%, negative predictive value was 50% and efficiency was 75% in using our cut off [37] (Table 6).
| Variables | KIM-1/ Cr ratio | |||||||
| Group I | Group II | Group III | Group IV | |||||
| Rho | P | Rho | P | Rho | P | Rho | P | |
| Creatinine (mg/dl) | -0.200 | 0.398 | 0.031 | 0.897 | -0.007 | 0.977 | 0.012 | 0.960 |
| Urea(mg/dl) | -0.295 | 0.206 | -0.224 | 0.343 | -0.097 | 0.683 | 0.127 | 0.593 |
| eGFR (ml/min/1.73 m2) |
0.357 | 0.123 | 0.122 | 0.609 | -0.011 | 0.965 | 0.123 | 0.606 |
Table 6: Correlation between KIM-1/ Creatinine ratio with urea, Creatinine and eGFR.
For albumin/ creatinine ratio using the upper limit of range in the Controls (Group I) 15 mg/g, the sensitivity was 71.67%, specificity was 100%, positive predictive value was 100%, negative predictive value was 54.05% and efficiency was 78.75% [38,39] (Table 7). KIM-1/Cr ratio was of the same sensitivity as albumin/ creatinine ratio. And as regard efficiency, it has been found that albumin / creatinine ratio was more efficient than KIM-1/ creatinine ratio (Table 3). And by drawing ROC curve for KIM-I/Cr ratio and albumin/creatinine ratio, the area under the curve was the same (AUC= 0.828) with p value highly significant (P<0.001) (Figure 7).
| Variables | Control | Cases | Sensitivity % | Specificity % | PPV % | NPV % | Efficiency % | |
|---|---|---|---|---|---|---|---|---|
| KIM-1/ creatinine ratio (ng/mg) |
0.399 | 15 | 16 | 73.33 | 75.0 | 89.80 | 48.39 | 73.75 |
| >0.399 | 5 | 44 | ||||||
| ≤ 0.467 | 17 | 17 | 71.67 | 85.0 | 93.48 | 50.0 | 75.0 | |
| >0.467 | 3 | 43 | ||||||
| Albumin/ creatinine ratio (mg/g) | ≤ 15 | 20 | 17 | 71.67 | 100.0 | 100.0 | 54.05 | 78.75 |
| >15 | 0 | 43 | ||||||
Table 7: Clinical sensitivity, specificity, positive predictive value, negative predictive value and efficiency of KIM-1/ creatinine ratio and albumin/ creatinine ratio.
From previous work, researchers found that evaluation of GFR and urinary albumin excretion are not ideal for determining renal damage in diabetic subjects and about 20% of patients with diabetic nephropathy remain normoalbuminuric despite a reduction in GFR [40]. This direct the attention to study newer makers like KIM-1/Cr.
Conclusion
Urinary KIM-1/Cr ratio is a sensitive, noninvasive diagnostic tool for kidney affection in Type 2 diabetic Egyptian patients that seem to predict renal injury in early period independent of albuminuria. Due to lack of correlation, both KIM-1/Cr and Alb/Cr ratios are required to be calculated for Type 2 diabetic patients.
Recommendations
Extension of the work on a large number of patients of both sexes and in both types of diabetes and using KIM-1/Cr ratio as a sensitive noninvasive diagnostic tool for renal injury by measuring it in urine of Type 2 diabetic patients.
Conflict of Interest
Authors hereby declare no conflict of interest.
References
- Ichimura T, Asseldonk EJ, Humphreys BD, Gunaratnam L, Duffield J, et al. (2008) Kidney injury molecule-1 is a phosphatidyl serine receptor that confers a phagocytic phenotype on epithelial cells. J Clin Invest 118(5): 1657-1668.
- Briskin MJ, McEvoy LM, Butcher EC (1993) MAdCAM-1 has homology to immunoglobulin and mucin-like adhesion receptors and to IgA-1. Nature 363: 461–464.
- Fontanilla J, Han WK (2011) Kidney injury molecule-1 (kim-1) as an early detection tool for acute kidney injury and other renal diseases 5(2): 161-73.
- Huo W, Zhang K, Nie Z, Li Q, Jin F (2010) Kidney injury molecule-1 (KIM-1): A novel kidney-specific injury molecule playing potential double-edged functions in kidney injury. Transplant Rev 24: 143-146.
- Zhang Z, Humphreys BD, Bonventre JV (2013) Shedding of the urinary biomarker kidney injury molecule-1 (KIM-1) is regulated by MAP kinases and juxta-membrane region. J Am Soc Nephrol 18: 2704-2714.
- Bonventre JV (2009) Kidney injury molecule -1 (KIM-1): A urinary biomarker and much more. Nephrol Dial Transplant 24(11): 3265-3268.
- Vaidya VS, Ramirez V, Ichimura T (2006) Urinary kidney injury molecule -1: A sensitive quantitative biomarker for early detection of kidney tubular injury. Am J Physiol Renal Physiol 290: F517-529.
- Zhou Y, Vaidya VS, Brown RP (2008) Comparison of kidney injury molecule-1 and other nephrotoxicity biomarkers in urine and kidney following acute exposure to gentamicin, mercury and chromium. Toxicol Sci 101: 159-170.
- Bonventre JV (2003) De-differentiation and proliferation of surviving epithelial cells in acute renal failure. J Am Soc Nephrol 1: S55-61.
- Rees AJ, Kain R (2008) Kim-1/Tim-1: From biomarker to therapeutic target? Nephrol Dial Transplant 23: 3394-3396.
- Bailly V, Zhang Z, Meier W, Cate R, Sanicola M, et al. (2002) Shedding of kidney injury molecule-1, A putative adhesion protein involved in renal regeneration. J Biol Chem 277: 39739-39748.
- American Diabetes Association (2008) Standers of medical care in diabetes. Diabetes Care 31: S21-31.
- Ding G, Reddy K, Kapasi AA (2002) Angiotensin II induces apoptosis in rat glomerular epithelial cells. Am J Physiol Renal Physiol 283: F173-180.
- Han WK, Bailly V, Abichandani R, Thadhani R (2002) Kidney Injury Molecule-1 (KIM-1): A novel biomarker for human renal proximal tubule injury. Kidney Int 62: 237-244.
- Chaudhary K, Phadke G, Nistala R, Weidmeyer CE (2010) The emerging role of biomarkers in diabetic and hypertensive chronic kidney disease. Curr Diab Rep 10: 37-42.
- Phillips AO (2003) The role of renal proximal tubular cells in diabetic nephropathy. Curr Diab Rep 3: 491-496.
- Fraser DJ, Phillips AO (2007) Diabetic nephropathy. Medicine 35: 503-506.
- Hovind P, Rossing P, Tarnow L, Smidt UM, Parving HH (2001) Progression of diabetic nephropathy. Kidney Int 59: 702-709.
- Varley H (1967) Practical Clinical Biochemistry (4th edn), William Heinemann Medical Books Ltd, London. pp. 145-157.
- Burtis CA, Ashwood ER, Bruns DE (2008) Tietz Fundementals of Clinical Chemistry. (6th edn). Elsevier Saunders Company, USA.
- Daly LE, Bourke GJ (2000) Interpretation and uses of medical statistics. (5thedn). Blackwell Science Publications, Oxford pp. 146-170.
- Puri BK (2002) SPSS in Practice: An illustrated guide. Arnold, London p.320.
- Jain S, Saraf S (2008) Type 2 diabetes mellitus – Its global prevalence and therapeutic strategies. Diabetes and Metabolic Syndrome: Clinical research and reviews. Diabetes Research and Clinical Practice 80: 392-398.
- The International Diabetes Federation (2008) Egyptian foot care centre to improve diabetes foot care with grant from the association. IDF Press Release Brussels/Alexandria. March 13, 2008.
- Marshall SM (2004) Recent advances in diabetic nephropathy. Post-graduate Medical Journal 80: 624-633.
- Ogawa S, Mori T, Nako K, Ishizuka T, Ito S (2008) Reduced albuminuria with Sarpogrelate is accompanied by a decrease in monocyte chemo attractant protein-1 levels in type 2 diabetes. Clin J Am Soc Nephrol 3: 362-368.
- Shlipak M (2011) Diabetic nephropathy: Prevention and progression. Am Fam Physician 83: 732-733.
- Mogensen CE, Chachati A, Christensen CK, Close CF, Deckert T, et al. (1985) Microalbuminuia: An early marker of renal involvement in diabetes. Renal Failure 9: 85-95.
- Dronavalli S, Duka I, Bakris GL (2008) Pathogenesis of diabetic nephropathy. Nature Clinical Practice Endocrinology and Metabolism 4: 444-452.
- Caramori ML, Fioretto P, Mauer M (2000) The need for early predictors of diabetic nephropathy risk: Is albumin excretion rate sufficient? Diabetes 49: 1399-1408.
- American Diabetic Association (2004) Nephropathy in diabetes. Diabetes Care 27: 79-83.
- Eknoyan G, Hostetter T, Bakris GI, Hebert L, Levey AS, et al. (2003) Proteinuria and other markers of chronic kidney disease: A position statement of the national kidney foundation and the national institute of diabetes and digestive and kidney diseases. Am J Kidney Dis 42: 617-622.
- Russo LM, Sandoval RM, Campos SB, Molitoris BA, Comper WD, et al. (2009) Impaired tubular uptake explains albuminuria in early diabetic nephropathy. J Am Soc Nephrol 20: 489-494.
- Van Timmeren MM, Bakker SJ, Vaidya VS, Bailly V, Schuurs TA, et al. (2006) Tubular kidney injury molecule-1 in protein-overload nephropathy. Am J Physiol Renal Physiol 291: F456-464.
- Waanders F, Vaidya VS, Van Goor H (2009) Effect of rennin-angiotensin-aldosterone system inhibition, dietary sodium restriction, and/or diuretics on urinary kidney injury molecule-1 expression in non-diabetic kidney disease: A post hoc analysis of a randomized controlled trial. Am J Kidney Dis 53: 16-25.
- Chaturvedi S, Farmer T, Kapke GF (2009) Assay Validation for KIM-1: Human urinary renal dysfunction biomarker. Int J Biol Sci 5: 128-134.
- American Diabetes Association (2006) Clinical practice and recommendations. Diagnosis and classification of diabetes mellitus. Diabetes Care 29: S43-48.
- Schwedler S, Gumodified S (2003) C-reactive protein in diabetic chronic kidney disease. Nephrol Dial Transplant 18: 2300-2307.
- Figaro MK, Kritchvesky SB, Resnick HE, Shorr RI, Butler J, et al. (2006) Diabetes, inflammation, and functional decline in older adults: Findings from the health, aging and body composition study. Diabetes Care 29: 2039-2045.
- Bhowmick K, Kutty A, Shetty H (2007) Glycemic control modifies the association between microalbuminuria and C-reactive protein in type 2 diabetes mellitus. Indian J Clin Biochem 22: 53-59.
Open Access Journals
- Aquaculture & Veterinary Science
- Chemistry & Chemical Sciences
- Clinical Sciences
- Engineering
- General Science
- Genetics & Molecular Biology
- Health Care & Nursing
- Immunology & Microbiology
- Materials Science
- Mathematics & Physics
- Medical Sciences
- Neurology & Psychiatry
- Oncology & Cancer Science
- Pharmaceutical Sciences
