GIS Determination of Malaria Hot Spots in Qeshm Island,Iran
1Non-Communicable Diseases Research Center, Endocrine and Metabolic Research Institute, Tehran University of Medical Sciences, Tehran, Iran
2Infectious and Tropical Diseases Research Center, Hormozgan Health Institute, Hormozgan University of Medical Sciences, Bandar Abbas, Iran
3Department of Medical Entomology and Vector Control, Research Center for Health Sciences, Institute of Health, Shiraz University of Medical Sciences, Shiraz, Iran
4Zoonoses Research Center, Jahrom University of Medical Sciences, Jahrom, Iran
5Department of Medical Pathology, School of Medicine, Tehran University of Medical Sciences, Tehran, Iran
- Corresponding Author:
- Azam Rafatpanah
Zoonoses Research Center
Jahrom University of Medical Sciences, Jahrom, Iran
Tel: +987154340232
E-mail: A.rafatpanah45@yahoo.com
Received Date: January 12, 2019; Accepted Date: January 30, 2019; Published Date: February 06, 2019
Citation: Zandian E, Nodez SMM, Khosravani M, Rafatpanah A, Latifi R (2019) GIS Determination of Malaria Hot Spots in Qeshm Island, Iran. J Zoonotic Dis Public Health. Vol.3 No.1:1
Copyright: © 2019 Zandian E, et al. This is an open-access article distributed under the terms of the Creative Commons Attribution License, which permits unrestricted use, distribution, and reproduction in any medium, provided the original author and source are credited.
Abstract
Malaria disease is considered a healthy challenge in the south of Iran. Anopheles stephensi is more responsible for the transmission of Plasmodium vivax to indigenous people in the endemic areas of Iran. Since GIS is beneficial tool in epidemiological study of tropical infections, all data were recorded into this software and spatial mapping of our site was provided. In total, 173 cases were reported during 2008-2017 from Qeshm Island, Hormozgan province, south of Iran. Data was analyzed by ArcGIS v 10.5 to depict the risky and hot spots related to our site. Winpepi v 3.18 was applied to evaluate the short seasonal peaks. Larak Island is located at the east of Qeshm Island where was identified as a cold spot of malaria transmission. Four districts including central part (Qeshm city, Dargahan & laft), Ramkan, Suza, and Hengam determined as the hot spots of malaria infection. Seasonal patterns appeared the significant short peak of 2 months (September- October) and August-October (P<0.005). In addition, 5 months (June to October) were more involved with malaria disease. This study presented that the foreign laborers as imported malaria cases were more involved groups in Qeshm Island. In order to accelerate the elimination phase of malaria, GIS mapping can be used for monitoring hot spots authentically.
Keywords
Malaria; GIS; Anopheles stephensi; Qeshm Island; Iran
Introduction
Malaria is caused by Plasmodium parasite, which is released through the bite of female Anopheles spp. into the human bloodstream [1]. Plasmodium falciparum, P. vivax, P. malariae, and P. ovale parasites are responsible for malaria disease. Furthermore, Plasmodium knowlesi as a zoonotic protozoan discriminates a causative agent of malaria infection in the human community [2]. Iran has been categorized into the pre-elimination phase of this disease by WHO organization since 2009 [3]. Men are mostly involved with malaria and 18.5% of cases are women. Besides, Plasmodium vivax is the major causing parasite species (≈90%) of malaria that is more widespread in rural or undeveloped regions [4]. Anopheles stephensi, A. culicifacies, A. fluviatilis, and A. superpictus deserve as vectors of malaria [5] but An. stephensi is a predominant malaria vector in southern Iran [6]. This species presented a resistance to DDT and lambdacyhalothrin insecticides especially within indoor residual spraying (IRS) strategy in endemic areas [7]. There was a huge decline in the number of malaria cases during the 2008-2016 so that the incidence rate reached from 11,460 to 705 because of intensive control interventions [8]. On the other hand, imported malaria cases originated from neighborhood countries have been increased in three provinces (i.e. Hormozgan, Sistan & Baluchistan and Kerman provinces) in recent years [9,10]. Since, malaria is significantly associated with environmental and metrological factors, it can be monitored by GIS [11]. Geographical information system (GIS) is commonly used for control and management of malaria. Herein, it extrapolates a visual model based on climatic factors, vector distribution, and breeding place of mosquitoes [12]. Risk maps obtain from indices of infectious diseases linked to demographic variables in GIS [13]. Spatial modeling is the strong approach that can combine and analyze pathogens/host/vector distribution through time or space simultaneously [14]. This valuable tool has been applied in some researches associated with malaria aspects (e.g. hot spot, ecology, and distribution of vectors) [15,16]. Many precious efforts were undertaken toward the elimination of this disease in Hormozgan province. The numbers of malaria patients were 91 in 2017 compared with 578 cases in 2009 in this region. Qeshm Island is ranked fourth based on the number of malaria cases among all counties in Hormozgan province. We carried out a study in Qeshm Island for the first time to design a GIS map of hot spots in accordance to our data from 2008 to 2017. Our finding can be used into elimination programme of malaria in Qeshm district and other parts of the south of Iran.
Materials and Methods
Study site
This descriptive cross-sectional study was conducted in Qeshm Island, Hormozgan province, south of Iran. The Island (26°41′43″N, 55°37′06″E) is located in the Persian Gulf with an area of 1,491 km2 and 136,548 inhabitants. The average rainfall is 183.2 mm also temperature is nearly 27°C. The early spring to the end of summer seasons are warm with a high level of relative humidity. Most people employed in the fishing industry and traditional markets. Moreover, many foreign workers visit this county for working and commercial activities each year [17].
Data processing and methodology
Malaria cases were identified by microscopic examination of blood smear and rapid diagnostic tests (RDTs) through active case detection (ACD) and passive case detection (PCD) surveillances over ten-year period (2008-2017). Ten-year incidence rates of malaria disease (No. of positive slides for malaria parasite (during 2008-2017) x 1000/Total population at risk in 2017 for 7 districts of Qeshm Island was calculated. A Hot Spot Analysis was applied based on Getis-Ord Gi statistic. These statistics provides confidence level bin (Gi_Bin) for each district. High positive Z scores (standard deviations) and low P-values (statistical probabilities) for each bin demonstrate high malaria incidences clusters (hot spots) and low negative Z scores and low P values indicate cold spots of malaria incidences, that show the low malaria incidences in cold spots compared with neighboring areas. The districts in the +/-3 bins identify statistical significance a 99% CI, the areas in the +/-2 bins show a 95% CI, the districts in the +/-1 bins identify a 90% CI and the places in bin 0 are not statistically significant. ArcGIS 10.5 was used for hot spot analysis. Cochran Armitage (CA) test was performed in order to evaluate the malaria incidences linear trend over the past 10 years. The malaria incidence rate is the number of positive slides of parasite divided by the total population at risk in a year multiplied by 1000). To appraise the seasonal patterns, the numbers of cases were required for a set of full years (10 years) and before data using, monthly data for every year must be combined. We analyzed deviations from a uniform incidence (the expected distribution) with Freedman's test, by entering monthly cases; the test uses a step distribution similar to a Kolmogorov-Smirnov type statistic for a discrete distribution. The critical values of the test were P < 0.05. The Ratchet circular scan test was applied for evaluating the short seasonal peaks. Peak periods of 2 and 3 successive months are employed and the numbers of cases in every possible period of that length are compared. Hewitt's rank-sum test was used to investigate a seasonal peak. Test examined whole possible rank sums for successive months by ranking the total monthly cases for each period of 4, 5 and 6 months. Also, the peak periods have highest rank sum. For evaluation of malaria incidences, linear trend and appraisal of seasonal patterns, data were analyzed by WinPepi software, version 3.18.
Ethical considerations
This study was confirmed by the ethical committee of Hormozgan University of Medical Sciences (HUMS) also was conducted in accordance to the ethical principles and the national norms and standards for conducting Medical Research in Iran.
Results
A total of 173 cases (161 males (93.06%) and 12 females (6.93%)) were recorded in the center for disease control and prevention (CDC) of Qeshm Island during the 10-year period (2008-2017). From which, 27(15.6%) cases were indigenous and 146 (84.4%) of them were determined as imported malaria cases. In addition to, all local patients were affected by vivax malaria and falciparum was founded in imported cases.
Hot spot analysis
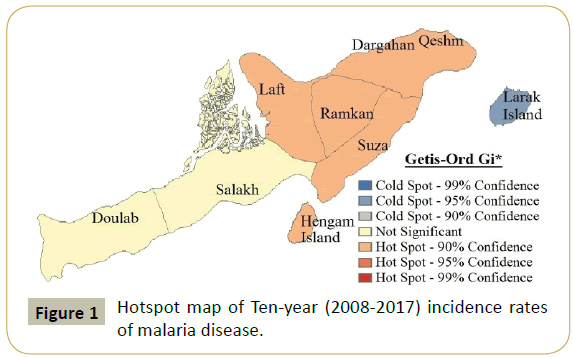
This study demonstrated that none of the districts were significantly hotspots of malaria incidances (95% CI). Larak Island is located at the east of Qeshm Island that was identified as a cold spot of malaria incidances. No malaria cases were found from Larak Island for 10 years. Four districts including central part (Qeshm city, Dargahan & laft), Ramkan, Suza, and Hengam were determined as the hot spots of malaria infection (90% CI) that indicate high incidences of malaria is clustered in central part compared in neighboring areas. More foreign workers lived in the central parts of Qeshm Island (Figure 1 and Table 1).
| Districts | MIR |
|---|---|
| Salakh | 0.84 |
| Suza | 0.54 |
| Doulab | 0.843 |
| Larak Island | 0 |
| Hengam Island | 1.88 |
| Central part | 1.42 |
| Ramkan | 1.83 |
Table 1: Malaria incidence rates (MIR) in each district of Qeshm Island over 10 years.
Linear trend analysis
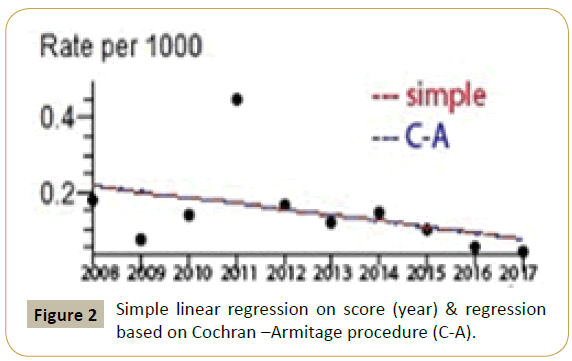
The regression-based on C-A (degree freedom: 1) procedure remarkably showed a decreasing linear trend of malaria incidence rates (P= 0.00). The relative drop in malaria incidence rate was 12.55% per year (95% Confidence Interval for relative change: -22.98 to -0.71%) (Figure 2).
Appraisal of seasonal variation
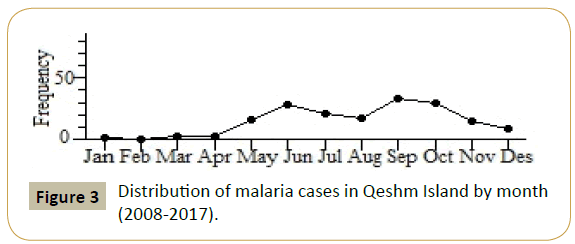
There were significant deviations from a uniform monthly incidence of malaria in 10 years period (P< 0.01). 36.4% of malaria cases were reported from September to October and 46.2% of them from August to October. Seasonal patterns appeared the significant short peak of 2 months (September-October) and August-October (P< 0.05) (Figure 3).
Discussion
GIS is reliable tool for public health especially malaria that provide us spatial trends and distribution of disease [18]. It determines the association between the incidence of malaria and epidemiological data of hot spots visually whereby GIS assists malariologists and authorities who engaged in the strategies to eliminate malaria [19,20]. Qeshm is a famous free economic zone in Iran. The foreign laborers work at business centers or fishing industry with less knowledge of malaria and poor sanitation conditions [21]. They live in marginal parts and receive inadequate health services. Often they didn’t cooperate with health cares and kept themselves away from seeking medical visitors. This situation can spread malaria in the community more than usual. Our result is line with a study performed by Rodríguez-Morales et al. in Colombia [22]. This knowledge showed that more cases inhabited in hot spots of Qeshm Island (Qeshm city, Dargahan & laft), Ramkan, Suza, and Hengam) and no cases were recorded from Larak district (Figure 1 and Table 1). Most of them were Pakistani. The similar pattern has been presented in other involved areas in south of Iran [23]. As claimed by Who, 57 indigenous cases have been reported in 2017, and noteworthy less than the 12,000 indigenous cases recorded in 2000 throughout the world [24]. Hot spots of our places were consisted of fluid populations. It’s more likely that movement to malarious destination increase the incidence rate of infection [25]. The burden of disease is reduced along recent years in our given area (Figure 2). Moreover, local transmission of falciparum malaria has been stopped since 2014 in Qeshm Island. It sounds that proper surveillance (active and passive), spraying, authentic diagnostic technics, strong disease reporting system, global fund partnership, and expanding the border patrol stations had the pivotal impact on the reduction of this involvement [6,7,26]. Fortunately, awareness rate and attitude of malaria aspects are acceptable among rural inhabitants in south of Iran that can lead to improve personal protection against Anopheles bites [27]. Our data revealed that the most cases belonged to June-October months specially September- October (Figure 3). In contrast, malaria has been observed in Sep-Oct (11) whereas that pattern had a peak during July-Aug in other districts [28]. In general, malaria transmission has been seen during all seasons except January–February in south of Iran. In other terms, female of Anopheles species (e.g. An. stephensi, An. culicifacies, An. dthali, and An. fluviatilis) with different blood feeding behaviors (exophagic/endophagic) have greater chance to seek own hosts for feeding [29]. Temporal pattern of vivax malaria were December to March and February-June in Peru compared to this research [30]. Also, April and September were the predominant months engaged with malaria based on GIS mapping view in India [31]. Temperature, relative humidity, rainfall, and topographic components boost the population of Anophelinae species [32]. Notably, the temperature oscillation has powerful influence on malaria incidence in some parts [33]. Malaria transmission expands more rapidly at 35°C in India [34]. Ditches, trenches, oasis, and hollows under palm trees provide the favorable setting for reproduction of mosquitoes in Qeshm Island. Indeed, spatio-temporal models presented that landscape trait particularly vegetation affects the development of female mosquitoes [35].
Malaria is still reported from Hormozgan province. Many control programs with high cost and specialist manpower have been administrated against malaria since around 60 years ago in this zone and we can’t ignore the glorious successes derived from control even elimination stage of this infection.
Conclusion
Resistant/tolerance to insecticides in the genus Anopheles, the failure rates of treatment with antimalarial drugs and illegal immigration have established malaria in Qeshm Island and Hormozgan province. The authors believe that diagnosis and treatment of relapse cases in malaria vivax also control of Iran- Pakistan border are the most determinative approaches for elimination and reestablish of this tropical disease in Iran. Besides, GIS can be helpful into control and surveillance of malaria disease alongside other methods.
Acknowledgement
We would like to offer our appreciation to staffs and Health providers of the center for disease control and prevention (CDC) of Qeshm county, for record of malaria patients’ information and keeping motivated throughout this project.
References
- Scholte EJ, Knols BGJ, Takken W (2006) Infection of the malaria mosquito Anopheles gambiae with the entomopathogenic fungus Metarhizium anisopliae reduces blood feeding and fecundity. J Invertebr Pathol 91: 43-49.
- Chew CH, Lim YAL, Lee PC, Mahmud R, Chua KH, et al. (2012) Hexaplex PCR detection system for identification of five Human Plasmodium Species with an internal control. J Clin Microbiol 50: 4012-4019.
- Samadi Kafil H (2017) Malaria in Iran: is the elimination phase? Ann Trop Med Parasitol 10: 1-2.
- Norouzinejad F, Raeisi A, Norouzinejad A, Ghaffari F (2016) Epidemiological status of malaria in Iran, 2011–2014. Asian Pac J Trop Med 9: 1055-1061.
- Salahimoghadam A, Khoshdel AR, Barati M, Sedaghat MM (2014) An overview and mapping of Malaria and its vectors in Iran. Hormozgan Med J 18: 473-485.
- Khosravani M, Rafatpanah A, Amiri SA, Zare A (2017) The field practices of Lambdacyhalothrin and Deltamethrin insecticides against adult mosquitoes of Anopheles stephensi as the main vector of malaria: residual effects. Zahedan. J Res Med Sci 19: e7629.
- Azizi k, Moemenbellah-Fard MM, Khosravani M, Fakoorziba MR, Soltani A, et al. (2014) Lethal and Residual Effects of Lambdacyhalothrin, Deltamethrin and Cyfluthrin Insecticides on Adult Mosquitoes of Anopheles stephensi Liston (Diptera: Culicidae) on Different Surfaces. J Health Sci Surv Sys 2: 30-35.
- Turki H, Rashid G, Shekari M, Raeisi A, Sharifi-Sarasiabi KH, et al. (2017) Malaria Elimination Program: Absence of asymptomatic malaria and low parasitic in the endemic area of Rudan district, Hormozgan Province, Iran. Hormozgan Med J 21: 225-231.
- Ebrahimzadeh-Leylabadlo H (2018) Malaria Eliminating: What Lies Ahead of Iran? J Arthropod-Borne Dis 12: 100.
- Zoghi S, Mehrizi A, Raeisi A, Haghdoost A, Turki H, et al. (2012) Survey for asymptomatic malaria cases in low transmission settings of Iran under elimination programme. Malaria J 11: 126.
- Mohammadkhani M, Khanjani N, Bakhtiari B, Sheikhzadeh KH (2016) The relation between climatic factors and malaria incidence in Kerman, South East of Iran. Parasite Epidemiol Control 1: 205-210.
- Tanser FC, Sueur DL (2002). The application of geographical information systems to important public health problems in Africa. Int J Health Geogr 1: 4.
- Hay SI, Battle KE, Pigott DM, Smith DL, Moyes CL, et al. (2013) Global mapping of infectious disease. Phil Trans R Soc B 368: 20120250-20120250.
- Ostfeld RS, Glass GE, Keesing F (2005) Spatial epidemiology: an emerging (or re-emerging) discipline. Trends Ecol Evol 20: 328-336.
- Hanafi-Bojd AA, Azari-Hamidian Sh, Vatandoost H, Charrahy Z (2011) Spatio-temporal distribution of malaria vectors (Diptera: Culicidae) across different climatic zones of Iran. Asian Pac J Trop Med 498-504.
- Hanafi-Bojd AA, Vatandoost H, Oshaghi MA, Charrahyb Z, Haghdoostc AA, et al. (2012) Spatial analysis and mapping of malaria risk in an endemic area, south of Iran: A GIS-based decision making for planning of control. Acta Tropica1 22: 132–137.
- Khosravani M, Mohebbi Nodez SM, Rafatpanah A, Mosalla S, et al. (2018) The first study of snake and scorpion envenomation in Qeshm Island, South of Iran. J Entomol Zool Stud 6: 982-987.
- Gwitira I, Murwira A, Zengeya FM, Shekede MD (2018) Application of GIS to predict malaria hotspots based on Anopheles arabiensis habitat suitability in Southern Africa. Int J Appl Earth Obs Geoinformation 64: 12–21.
- Zhang W, Wang L, Fang L, Ma J, Xu Y, et al. (2008) Spatial analysis of malaria in Anhui province, China. Malaria Journal 7: 206.
- Adeolaa AM, Botaia JO, Olwochb JM, Rautenbacha HCJdW, Kalumbaa AM, et al. (2015) Application of geographical information system and remote sensing in malaria research and control in South Africa: a review. South Afr J Epidemiol Infect 30: 114–121.
- Mohebbi Nodez SM, Khosravani M, Rafatpanah A, Jafarpour S, Jaberhashemi SA, et al. (2018) Imported malaria and epidemiologic components of this infection in Qeshm Island, Iran. Int J Mosq Res 5: 143-149.
- Rodríguez-Morales AJ, Orrego-Acevedo CA, Zambrano-Mu˜noz Y, García-Follecoc FJ, Herrera-Giraldo AC, et al. (2015) Mapping malaria in municipalities of the Coffee Triangle region of Colombia using Geographic Information Systems (GIS). J Infect Public Health 8: 603-611.
- Barati M, Keshavarz-valian H, Habibi-nokhandan M, Raeisi A, Faraji L, et al. (2012) Spatial outline of malaria transmission in Iran. Asian Pac J Trop Med 5: 789-795.
- https://www.who.int/malaria/publications/atoz/e-2020-progress-report/en/
- Martin C, Curtis B, Fraser C, Sharp B (2002) The use of a GIS-based malaria information system for malaria research and control in South Africa. Health & Place 8: 227–236.
- Jaberhashemi SA, Khosravani M, Mohebbi Nodez SM, Rafatpanah A (2018) The general inclination and global fund effects upon malaria incidence in Bashagard County, Iran. Int J Mosq Res 5: 133-137.
- Nejati J, Moosa-Kazemi SH, Saghafipour A, Soofi KH (2017) Knowledge, attitude and practice (KAP) on malaria, from high malaria burden rural communities, southeastern Iran. J Parasit Dis 42: 62-67.
- Salehi M, Mokhtari Amirmajdi M, Eftekharzadeh Mashhadi I, Hakemi Y, Eftekharzadeh Mashhadi A, et al. (2010) Analysis of Malaria Epidemic Features in Sistan and Baluchistan Province, Southeast of Iran, 2005-2008. Iran Red Crescent Med J 12: 247-253.
- Yeryan M, Basseri HR, Hanafi-Bojd AA, Raeisi A, Edalat H, et al. (2016) Bio-ecology of malaria vectors in an endemic area, Southeast of Iran. Asian Pac J Trop Med 9: 32–38.
- Bautista CT, Chan AST, Ryan JR, Calampa C, Roper MH, et al (2006) Epidemiology and spatial analysis of malaria in the northern Peruvian Amazon. Am J Trop Med Hyg 75: 1216–1222.
- Qayum A, Lynn AM, Arya R, Jaiswal SK (2013) GIS Integrated Epidemiological Indices for Risk Area Identification towards Malaria Control Measures. Int J Eng and Advanced Technology 10: 10.
- Pirmoradi AR, Noorifard M, Salahi Moghaddam AR (2012) Ecological Study on Malaria in Bandar Abbas District Using Geospatial Information System (GIS). J Army Univ Med Sci 10: 35-44.
- Halimi M, Farajzadeh M, Delavari M, Takhtardeshir A, Moradi A, et al. (2014) Modelling spatial relationship between climatic conditions and annual parasite incidence of malaria in the southern part of Sistan & Balouchistan Province of Iran using spatial statistic models. Asian Pac J Trop Dis 4: S167-S172.
- Kumar Ra P, Nathawat MS, Onagh M (2012) Application of multiple linear regression model through GIS and remote sensing for malaria mapping in Varanasi district, India. J Health Sci 6: 731-749.
- Dufourda C, Dumont Y (2013) Impact of environmental factors on mosquito dispersal in the prospect of sterile insect technique control. Comput Math Appl 66: 1695–1715.
Open Access Journals
- Aquaculture & Veterinary Science
- Chemistry & Chemical Sciences
- Clinical Sciences
- Engineering
- General Science
- Genetics & Molecular Biology
- Health Care & Nursing
- Immunology & Microbiology
- Materials Science
- Mathematics & Physics
- Medical Sciences
- Neurology & Psychiatry
- Oncology & Cancer Science
- Pharmaceutical Sciences


