ISSN : 0976-8505
Der Chemica Sinica
Electrochemical Stripping Studies Of Felodipine
A Mohamed Sikkandera1*, C Vedhib2, P Manisankarc3
1Department of Chemistry, Velammal Engineering College, Chennai 600 066, Tamil Nadu, India
2Department of Chemistry, V.O Chidambaram College, Tuticorin 628 008, Tamil Nadu, India
3Department of Industrial Chemistry, Alagappa University, Karaikudi 630 003, Tamil Nadu, India
Abstract
Research on increasing sensitivity of electroanalytical methods has led to the development of the techniques of stripping voltammetry. The concentration step is carried out for a definite time under reproducible conditions and the stripping process in most cases is performed in some voltammetric scanning procedure. The resulting “stripping voltammogram” shows peaks, the heights of which are generally proportional to the concentration of the corresponding electroactive species and the potentials of which have the same qualitative meaning as their half-wave potentials in polarography. Dilute solutions in the range 10-6 to 10-9 M/dm3 and less, are analysed with excellent precision and selectivity. Thus this technique extends the range of classical polarography by three to four times making possibly the analysis in nano range. The important characteristics of stripping voltammetric peaks are its height, width and peak potential. They are affected by the type of electrodes and scan rate. The same electrode is used both in the concentration and stripping processes. The process is not disturbed by the presence of organic substances other than analyte, provided they are not adsorbed on the electrode surface.Compared with other highly sensitive electroanalytical methods such as linear-sweep oscillographic polarography and square wave or pulse polarography, stripping voltammetry gives the same performance at lower cost.
Keywords:
Electrochemical stripping analysis, DPSV, Accumulation potential, Initial scan potential
Introduction
The electrochemical stripping analysis involves a preconcentration of the analyte on the working electrode prior to its determination by means of an electrochemical technique [1,2]. It is a more important technique in trace analysis, since it has the lowest detection limit in the trace analysis. The original method involves the cathodic electrodeposition of amalgam forming metals on a hanging mercury drop working electrode followed by the anodic voltammetric determination of the accumulated metal during a positive signal potential scan. In 1980s and 1990s several advances have been made in the development of alternative schemes which further enhanced the scope and power of stripping analysis. Consequently, numerous variants of stripping analysis exist currently which differ in their method of accumulation and measurements [3-6]. Stripping voltammetry enables the determination of electroactive components in the concentration range from 10-6 to 10-9 M/dm3.
Materials and Methods
Electrochemical adsorption generally means the attachment of molecules or ions on the surface of the electrodes. The amount of adsorbate on a fully covered electrode surface depends on the size of the analyte. Less soluble analyte tends to promote strong accumulation. The stripping peak current mainly depends on the preconcentration time. Rate of mass transport by convection controls the peak current and detection limit. The mass-transport phenomena are greatly influenced by temperature [about 2% per oC] and hence the solution in the cell must be thermostated. Electrode materials and their geometry also affect the stripping analysis. At platinum electrodes, the presence of platinum oxide film hinders both deposition and stripping. The organic surface-active substances as impurities in supporting electrolyte influence the double layer structure on the electrode. The solution concentration should not be too high to avoid higher percentage of impurities. A rest period between the deposition and stripping process ensures the cease of convection in the solution. The electrolytic stripping process depends on the experimental parameters of the electrodeposition process. The medium does not hinder the concentration process but has deleterious effects on the stripping process. The use of the same medium for concentration and stripping processes can render the analysis difficult for the following reasons. The near coincidence of the half-wave potentials of two electroactive species hinders the stripping process and not the deposition process. In some cases, the medium for “concentration” is given; stripping cannot be carried out in such a medium where adsorption phenomena arise. In strongly acidic media, the stripping is hindered by relatively high residual current by the reduction of hydrogen ions. To overcome this difficulty, the medium is changed after the concentration process. One may use sine wave, square wave and pulse polarography to get a possible detection of 10-10 M/dm3. Trace analysis requires successful solution for (i) sensitivity (ii) selectivity and (iii) adsorption in very dilute solutions. Sensitivity can be increased by carrying out the pre concentration in the system in which the stripping will be performed. This is the principle involved in electrochemical stripping method.
Current is measured as a function of changing electrode potential; peaks are formed on the polarization wave. Peak positions are characteristic of the given substance and their heights are (or area) proportional to the concentration of the solution. Voltammetric stripping processes are termed either cathodic or anodic in accordance with the functioning of the process (reduction or oxidation respectively). Differential pulse stripping voltammetry is primarily used for the determination of trace analysis. Detection limits are typically in the range of 10-8 to 10-10 M/dm3.Generally two approaches can be made in stripping voltammetry. In the first approach complete electrolysis of the substance in the solution and monitoring of the current density are necessary for complete dissolution of the deposit. This approach achieves high precision and accurate results under favourable conditions. But it is a lengthy process especially with large volumes. In small volumes, the depolarizer is removed from the solution in a relatively short time. The second approach involves pre-electrolysis under reproducible conditions for a certain time interval, so that the amount of substance deposited at the electrode is a reproducible fraction of the total initial amount of the substance in the solution (2 to 3%). In aqueous media, a potential range from +1.5 to -2.5 V (vs SCE) is available for stripping determination.
Results and Discussion
A variety of carbon materials are now finding applications as electrode materials. Among these, glassy carbon is a specific variety of synthetic carbon material, prepared by controlled heat treatment of phenol-formaldehyde resin up to 3000°C. The material was first prepared in 1962. It was found to have good electronic conductivity and hence found application as early as 1965. Simple methods of preparing glassy carbon electrodes have been described. The electrochemical aspects GCE from time to time have also been reported in review articles [7-9]. From the earlier studies, it was realised that GCE materials prepared at high heat-treatment shows good electrochemical activity. Heattreatment under vacuum is recommended for removing oxygen free functional groups. It also decreases the chance of pitting of GCE during electrochemical polarisation. The presence of fluoride ions in the electrolyte was found to improve the stability of GCE. GCE is polished using alumina in the form of emery paper or powder, which activates it in electron transfer reactions. This behaviour has been thoroughly investigated using electrochemical as well as other microscopic techniques [10-14]. Recently a pre-treatment procedure for GCE that employs AC polarisation has also been recommended. The most important pretreatment procedure involves cycling between selected anodic and cathodic potential regions at a fairly slow sweep rates, 10 mVs-1 for 10-15 minutes [15-18].
Conclusion
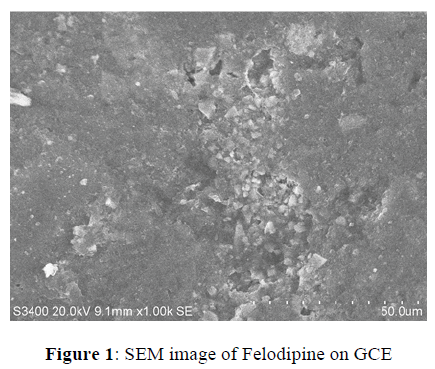
Adsorptive stripping voltammetry enhances the scope of stripping measurements towards numerous trace analysis. Depending on the redox behaviour of the compound, the quantification of the adsorbed organic analyte may either proceed through oxidation or reduction. The adsorption and oxidation behaviours of the analyte, Felodipne were used for stripping analysis by previous accumulation and later oxidation (stripping) of the electroactive group, using differential pulse stripping techniques. Cyclic voltammetric studies led to the selection of pH 13.0. The oxidation peak around 400 mV was chosen for the study. Experiments were carried out to find the best potential for the adsorption step in chosen medium. Preconcentration-stripping voltammograms were recorded for accumulation potentials (Eacc) varying from 100 to 600 mV and at accumulation time (tacc) of 15 seconds, it showed the best peak current for an accumulation potential at 300 mV. Above this peak current was found to decrease, which may be due to maximum electrode surface coverage under these conditions. Thus, the pH 13.0 and an Eacc of 300 mV were chosen as optimum for further studies. SEM photograph showed in (Figure 1). Deposition of Felodipne during accumulation on GCE and exhibited sponge with granular like structure. The initial scan potential (Eis), is another important parameter like accumulation potential. The surface electron distribution represented by accumulation potential is not solely responsible for the resulting voltammogram. When voltammograms were recorded at fixed Eacc values but varying Eis values, neither the peak potential nor the peak current corresponded to the original value. Initial scan potential (Eis) at -100 mV yielded higher peak current than other Eis.
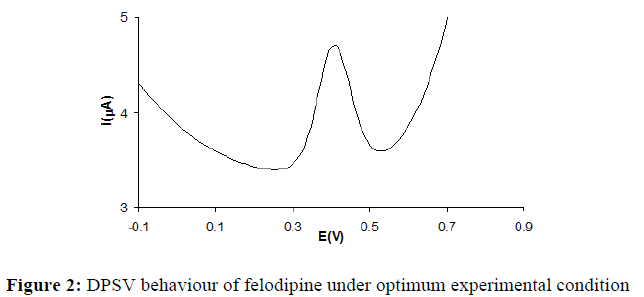
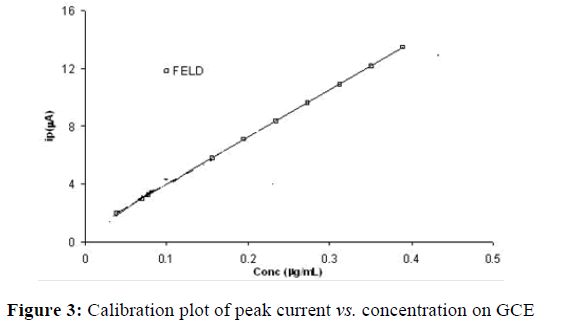
As the pulse height was increased from 25 to 150 mV, the peak current was found to decrease. Maximum Peak current value was obtained for 50 mV pulse amplitude and hence, pulse amplitude of 50 mV was chosen for further studies. The effect of pulse period was studied from 50 to 350 ms. The maximum peak current was observed a pulse period of 200 ms. Above 200 ms, peak current value showed only minor variations. Studies on effect of variation of pulse width demonstrated that the stripping peak current decreased with increasing pulse width from 25 to 100 ms. Thus, a pulse period of 50 ms and a pulse width of 50 ms were used for further studies. Maximum peak response at 8 mV scan increment was observed. The scan increment was varied between 2 and 24 mV. The optimum conditions that resulted in good peak response were used to study the effect of concentration. A typical stripping voltammetric response under optimum experimental condition for FELD of concentration 0.2 μg/mL is given in (Figure 2). Under the optimum experimental conditions, the square wave form applied to the stripping of the FELD yielded a good analytical signal than the differential pulse form for an assayed concentration of 0.2 μg/mL. Differential pulse stripping voltammograms were recorded at various FELD concentrations using the optimum conditions. From them, a linear calibration plot was obtained for this compound at a concentration between 0.1 μg/mL and 0.41 μg/mL. The calibration plots obtained are presented in (Figure 3).
The reproducibility of the stripping signal was ascertained in terms of relative standard deviation (2.2 %) for six measurements carried out at a concentration of 0.2 μg/mL. The pharmaceutical samples analyzed were collected from medical shops at Karaikudi, Tamilnadu, India. Tablets and injection having Felodipine drug were examined for estimation of drug present in them. Solution obtained by dissolution of tablets was subsequently diluted so that drug concentration lies in the range of calibration plot. Stripping voltammogram of the drug showing at pH 13.0 for the drug recorded under exactly identical conditions. Keeping dilution factor in consideration, it was found that drug concentration determined using this method and it is in good agreement with reported value. The amounts of drug determined experimentally and reported in tablets are listed in (Table 1). Measurement of drug in a urine
| Parameter | Eacc | DT | Eis | PH | PW | PP | SI | Ep (mV) | ip (mA) | |
| Accumulation potential (Eacc) mV | 100 | 15 | -200 | 25 | 25 | 50 | 4 | 383.1 | 1.978 | |
| 200 | 383.7 | 1.989 | ||||||||
| 300 | 383.9 | 2.199 | ||||||||
| 400 | 384.4 | 1.507 | ||||||||
| 500 | 384.7 | 1.485 | ||||||||
| 600 | 385.0 | 1.308 | ||||||||
| Parameter | Eacc | DT | Eis | PH | PW | PP | SI | Ep (mV) | ip (mA) | |
| Deposit time (DT) sec | 300 | 15 | -200 | 25 | 25 | 50 | 4 | 395.6 | 1.208 | |
| 30 | 396.1 | 2.290 | ||||||||
| 45 | 396.4 | 1.972 | ||||||||
| 60 | 397.2 | 1.764 | ||||||||
| 75 | 398.4 | 1.552 | ||||||||
| 90 | 398.9 | 1.343 | ||||||||
| Initial scan potential (Eis) mV | 300 | 30 | -300 | 25 | 25 | 50 | 4 | 398.1 | 1.854 | |
| -200 | 398.4 | 2.162 | ||||||||
| -100 | 399.1 | 2.407 | ||||||||
| 0 | 399.4 | 1.827 | ||||||||
| 100 | 399.5 | 1.792 | ||||||||
| 200 | 399.1 | 1.308 | ||||||||
| 300 | 399.4 | 1.225 | ||||||||
| Pulse Height (PH) mV | 300 | 30 | -100 | 25 | 25 | 50 | 4 | 404.5 | 1.901 | |
| 50 | 404.9 | 2.405 | ||||||||
| 75 | 405.2 | 2.272 | ||||||||
| 100 | 405.7 | 2.025 | ||||||||
| 150 | 405.9 | 1.872 | ||||||||
| 200 | 406.7 | 1.671 | ||||||||
| Pulse width (PW) ms | 300 | 30 | -100 | 50 | 25 | 50 | 4 | 415.2 | 1.988 | |
| 50 | 416.2 | 2.391 | ||||||||
| 75 | 416.4 | 2.262 | ||||||||
| 100 | 417.6 | 2.151 | ||||||||
| 150 | 417.9 | 1.941 | ||||||||
| 200 | 418.2 | 1.811 | ||||||||
| Pulse Period (PP) ms |
300 | 30 | -100 | 50 | 50 | 50 | 4 | 423.2 | 2.122 | |
| 100 | 423.7 | 2.272 | ||||||||
| 150 | 424.4 | 2.301 | ||||||||
| 200 | 425.5 | 2.422 | ||||||||
| 250 | 425.1 | 2.307 | ||||||||
| 300 | 426.4 | 2.272 | ||||||||
| 350 | 426.7 | 2.116 | ||||||||
| Scan Increment (SI) mV | 300 | 30 | -100 | 5 | 50 | 200 | 4 | 426.1 | 2.272 | |
| 8 | 426.4 | 2.301 | ||||||||
| 12 | 426.8 | 2.472 | ||||||||
| 16 | 427.0 | 2.327 | ||||||||
| 20 | 427.1 | 2.399 | ||||||||
| 24 | 427.2 | 2.395 | ||||||||
Table 1: DPSV behaviour of Felodipine on GCE at pH 13.0
sample collected after 8 h from administration of the drug. 1.0 ml of the urine sample was mixed with 0.1 M NaOH solution and the pH was brought to 13.0. The DPSV was carried out under the optimum experimental conditions. This experiment was repeated for 5 times and the average weight of drugs in 1.0 ml of urine sample is found. There was no appreciable interference due to the presence of small amount urine present in the electrolyte hence the same calibration plot was used. There was no degradation of the analyte in solution during experiment. The other matters present in tablets and urine samples are not interfering with the study. This method is simple and suitable method for the determination of drugs.
References
- Vydra F, Stulik K, Jula E, Kova (1976) "Electrochemical Stripping Analysis", Halsted Press, New York.
- Wang J (1985)"Stripping Analysis", VCH Publishers, Inc. Dear Field Beach, FL, USA.
- Paneli MG, Voulgaropoulos A (1993) Electroanalysis 5: 355.
- Kalvoda R, Kopanica M (1989). Pure Appl Chem 61: 97-112.
- Brainina K, Neyman E (1993)"Electrochemical Stripping Methods", American chemical society, Washington, DC, USA.
- Vandon Berg C.M.G, (1991). Anal Chim Acta 250: 265.
- Vender LWE, Dieker JW (1980) Anal Chem Acta 119: 1.
- Cross M, Jordan J(1984) Pure. Appl Chem 56: 1095-1130.
- Kamau GN (1988) Anal Chem Acta 207: 1.
- Manisankar P, Vedhi C, Selvanathan G (2003) Electrochemical determination of methyl parathion using a modified electrode. Toxicol and Environ Chem85: 233: 241.
- Manisankar P, Selvanathan G, Vedhi C (2005) Appl Clay Sci 29: 249-257.
- Manisankar P, Selvanathan G, Vedhi C (2006) Talanta68: 686-692.
- Manisankar P, Muralidharan B, Gopu G, Vedhi C (2008) Appl Clay Sc 42: 206-213.
- Sirmagül B, Ozdener F, Gulbas Z, Erol K (2007). Int J Clin Exp Med 7: 142-148.
- Muralidharan B, Gopu G, Vedhi C,Manisankar P (2009) J Appl Electrochem 39 : 1177.
- Mohamed SA, Vedhi C, Manisankar P (2011) IISTE 1: 1-7.
- Mohamed SA, Vedhi C, Manisankar P (2012) Der Chemica Sinica 3: 413-420.
- Mohamed SA, Vedhi C, Manisankar P (2012) IJIC 3:29.

Open Access Journals
- Aquaculture & Veterinary Science
- Chemistry & Chemical Sciences
- Clinical Sciences
- Engineering
- General Science
- Genetics & Molecular Biology
- Health Care & Nursing
- Immunology & Microbiology
- Materials Science
- Mathematics & Physics
- Medical Sciences
- Neurology & Psychiatry
- Oncology & Cancer Science
- Pharmaceutical Sciences


