Is European Decarbonization in The Right Path?
Mara Madaleno*
GOVCOPP - Research Unit in Governance, Competitiveness and Public Policy, and DEGEIT -Department of Economics, Management and Industrial Engineering, University of Aveiro, Campus de Santiago, 3810-193, Aveiro, Portugal
- *Corresponding Author:
- Mara Madaleno
GOVCOPP - Research Unit in Governance
Competitiveness and Public Policy
and DEGEIT -Department of Economics
Management and Industrial Engineering
University of Aveiro, Campus de Santiago
3810-193, Aveiro, Portugal
E-mail: maramadaleno@ua.pt
Received date: July 31, 2017; Accepted date: August 12, 2017; Published date: August 18, 2017
Citation: Madaleno M (2017) Is European Decarbonization in The Right Path? Glob Environ Health Saf. Vol. 1 No. 1: 2.
Abstract
By using the decoupling index and the decoupling method of Tapio we infer about the decoupling state (considering energy consumption and emissions) of each of the 10 European countries, the highest issuers per GDP unit, between 1995 and 2014, and considering different sectors (transports and electricity). Results are useful not only for understanding what happened until the present moment, but more importantly to serve as a guide towards what is still needed to do in order to prevent carbon emissions increases. Unified energy policies would not be the good recipe for the whole area. Even though there may be political will to construct the common goals and objectives, different policy design for subgroups of member states ought to probably be considered considering that results reveal an heterogeneous behavior reached in terms of strong decoupling until 2014. Results are useful for policy makers, energy producers and consumers as well.
Keywords
Greenhouse gas emissions; Decoupling; Energy consumption; Tapio; European strategy
Introduction
Power systems decarbonization corresponds to the primary actions pursued to fight air pollution and climate change. The 2020 European strategy and the recently ratified Paris agreement are among the main documents in the European Union (EU) with respect to energy and climate policy. However, throughout the EU we still verify high levels of CO2 emissions among countries, mainly caused by their heavily resilience in fossil fuel energy sources to produce electricity, imposed by still high renewable sources transition costs, technology barriers and difficulties concerning storage of energy produced. This high resilience forms a backdrop for policy concerns with respect to energy supply security, energy efficiency and low carbon target failures correspond to a still high economy concern.
The European Council agreed in 2014 on a target of improving overall energy efficiency by at least 27% in 2030, which should not be translated into national binding targets, but Member States are free to set higher national targets if they want to. However, it is still hard to compute exact efficiency potentials reached thus far just by substituting high carbon intensive energy sources by those low carbon intensive, at the same time national economies allow for continuous economic growth. Decoupling refers exactly to the separation between environmental hurt (carbon emission increases) and (due to) economic growth. As stated by Li et al. [1] in the sustainability literature, decoupling respects to the decrease of a country’s carbon emissions without causing negative impacts over that country economic growth.
In a recent study, Liobikienė et al. [2] results showed that the growth of the economy and primary energy consumption stimulate GHG emissions in EU-28; meanwhile, the increase of renewable energy sources share decreased them. The authors argue that if the EU will achieve its targets committed in the Europe 2020 strategy, even assuming fast economic growth, the target to reduce GHG emissions by 20% by 2020 compared to 1990 will be achieved. By observing different economic growth tendencies, changes in energy consumption and renewable energy (RES) shares, the authors argue that only recent tendencies (2005-2012) are appropriate to implement GHG emission targets. But this considering Europe 2020 strategy, not for the Paris agreement. Policy implications derived from these results state that EU countries should reduce energy consumption more and increase RES share in order to reach the GHG emissions level committed by the Paris agreement.
Previous literature studies exploring decoupling at the national or regional level, observe if they performed well or worse [3-5]. Authors tend to use the decoupling index method or the Tapio [6] model when they are analyzing the relationship between carbon emission and economic growth. As such, if it is easy to know if an economy is decoupled from carbon emission, it is harder to know about the factors that have resulted in these observations. As such, the present article adds to the decoupling existent literature by first decomposing carbon emissions considering RES contributions. So, we demonstrate the advantages of driving decoupling research at the EU country level, allowing for more accurate future carbon reduction policies design. We also add by using the decomposition method of the Logarithmic Mean Divisia Index (LMDI) and decoupling method of Tapio [6]. Both are used in a way to allow us to compute the magnitude of the impact that each factor has on the decoupling index of each country. Results will be useful not only for understanding what happened until the present moment, but more importantly to serve as a guide towards what is still needed to do in order to prevent carbon emissions increases. Results will be useful for policy makers and energy producers and consumers as well since they are presented at an individual country and sector levels.
Our study is relevant for four main reasons. First, usually the decoupling effect is studied at the national or regional level and little attention is provided at the sector level. Performing an analysis at the sectoral level allows to determine the contribution of each sector to greenhouse gas emissions when data is available. This is important because the contribution of carbon emissions by the energy-electricity sector is clearly higher than that of transports, turning evident that it makes little sense to aggregate the data from these sectors to the national level. Second, the literature tends to use the decoupling index method or the Tapio [6] model when analyzing the relationship between carbon emissions and economic growth, but these methods are limited in terms of results produced. Such analysis provides limited information on the cause of the observed carbon emissions and economic growth relationship. As such, we could know whether a region’s economy is decoupled from carbon emissions but not much about the factors resulting into these observations. Thus, we also consider energy consumption into this decoupling effect. Thirdly, carbon emissions are usually used into the decoupling study, but Greenhouse Gases (GHGs) provide a better picture onto the gases in the atmosphere that absorb and emit infra-red radiation from the sun's rays that are reflected back into space or absorbed and transformed into heat. The main greenhouse gases are water vapor, carbon dioxide (CO2), methane (CH4), nitrous oxide (N2O), ozone (O3), chlorofluorocarbonates (CFCs), hydrochlorofluorocarbonates (HCFCs). Thus, carbon emissions are only a part of GHGs, turning more useful to study the nexus between GHG and economic growth. Fourth, we perform the decoupling analysis at a country individual level and using a sectoral approach considering the electricity and the transport sectors for the top ten European countries in terms of higher GHG emissions. We would have liked to add the heating and cooling sector to this analysis but it was not possible to have this data in individual terms. Using sector analysis we are able to discern GHG emissions better than when using national level data, because each sector has its particular specificities and this could enable the formulation of future GHG policies with greater accuracy. Moreover, we propose to use GHG emissions and not CO2 emissions as it is usually done in the decomposition literature.
The rest of the article develops as follows. Section 2 presents the data used, while section 3 the methodology and the results attained, at the same time presenting a clear discussion for the results attained. Section 4 concludes this work.
Data Discussion
Table 1 justifies the choice of the ten European countries under study. After collecting all available data we placed a ranking among the countries in Europe with higher levels of Greenhouse Gases with respect to total GVA (gross value added) to account for dimension (GHG/GVA). We observe that the countries that were in the top ten emitters in 2005 are not the same ten which belong to the top ten in 2014. In fact, we observe some changes in the ranking positions for some countries whereas others still kept their ranking from one year to the other (for example, Spain, Italy, Austria, France, Sweden). When countries change to a lower ranking position this means that they have improved the ratio GHG/GVA, thus performing better in terms of pollution emission when compared to economic growth.
| Ranking | Country | 2005 | Country | 2014 | |
|---|---|---|---|---|---|
| 1 | GHG/VAB | BG - Bulgaria | 1108.89 | EE - Estonia | 878.45 |
| 2 | EE - Estonia | 1086.80 | BG - Bulgaria | 714.26 | |
| 3 | RO - Romania | 941.79 | CZ - Czech Republic | 557.05 | |
| 4 | CZ - Czech Republic | 863.89 | GR - Greece | 543.08 | |
| 5 | SK - Slovakia | 764.24 | CY - Cyprus | 503.44 | |
| 6 | HR - Croatia | 654.24 | IS - Iceland | 499.96 | |
| 7 | GR - Greece | 634.72 | HR - Croatia | 423.92 | |
| 8 | CY - Cyprus | 612.13 | FI - Finland | 412.23 | |
| 9 | HU - Hungary | 604.77 | SI - Slovenia | 409.32 | |
| 10 | LT - Lithuania | 599.77 | RO - Romania | 408.41 | |
| 11 | SI - Slovenia | 573.79 | SK - Slovakia | 388.75 | |
| 12 | IE - Ireland | 562.36 | HU - Hungary | 367.71 | |
| 13 | FI - Finland | 558.15 | IE - Ireland | 364.69 | |
| 14 | BE - Belgium | 545.67 | LV - Latvia | 364.52 | |
| 15 | LU - Luxembourg | 544.78 | DE - Germany | 357.52 | |
| 16 | PT - Portugal | 501.05 | LT - Lithuania | 347.13 | |
| 17 | DK - Denmark | 499.34 | BE - Belgium | 345.34 | |
| 18 | IS - Iceland | 497.92 | NL - Netherlands | 342.07 | |
| 19 | DE - Germany | 488.30 | PT - Portugal | 335.90 | |
| 20 | LV - Latvia | 487.03 | MT - Malta | 320.39 | |
| 21 | ES - Spain | 475.96 | ES - Spain | 314.66 | |
| 22 | NL - Netherlands | 465.47 | UK - United Kingdom | 304.29 | |
| 23 | UK - United Kingdom | 464.11 | DK - Denmark | 297.79 | |
| 24 | MT - Malta | 452.03 | LU - Luxembourg | 290.53 | |
| 25 | IT - Italy | 433.58 | IT - Italy | 287.47 | |
| 26 | AT - Austria | 428.54 | AT - Austria | 280.96 | |
| 27 | FR - France | 375.81 | FR - France | 262.36 | |
| 28 | SE - Sweden | 291.99 | SE - Sweden | 185.86 |
Note: The main greenhouse gases (GHG) are water vapor, carbon dioxide (CO2), methane (CH4), nitrous oxide (N2O), ozone (O3), chlorofluorocarbonates (CFCs), hydrochlorofluorocarbonates (HCFCs). (metadata - INE). Source sector of air emissions, t CO2 eq, Absolute Value, 103, t CO2 eq=tonne of carbon dioxide equivalent. Gross Value Added (GVA) - Gross production value less the cost of raw materials and other consumption in the production process Absolute Value, transformed into 103. (metadata - INE). Values are gross when not deducting the consumption of fixed capital. Data source: PORDATA.
Table 1: Ranking of the European countries total emission of greenhouse gases (global warming potential - the ratio GHG/GVA): 2005 and 2014.
To conduct the present study we have collected data from Pordata Europe and from Eurostat for all European countries having selected the sectors interesting to study: Energy-Electricity and Transports. As previously mentioned the ten countries under analysis were those evidenced in Table 1 ranking by order (EEEstonia; BG-Bulgaria; CZ-Czech Republic; GR-Greece; CY-Cyprus; IS-Iceland; HR-Croatia; FI-Finland; SI-Slovenia; RO-Romania). The analysis period goes from 1995 until 2014.
Greenhouse Gases account for gases in the atmosphere that absorb and emit infra-red radiation from the sun's rays that are reflected back into space or absorbed and transformed into heat. The main greenhouse gases are water vapour, carbon dioxide (CO2), methane (CH4), nitrous oxide (N2O), ozone (O3), chlorofluorocarbonates (CFCs), hydrochlorofluorocarbonates (HCFCs) (metadata comes from INE). Data has been collected by source sector of air emissions, in t CO2 eq (tonne of carbon dioxide equivalent), absolute value, in 10^3. Gross Value Added (GVA) is the gross production value less the cost of raw materials and other consumption in the production process (metadata - INE). Values were collected by sector of economic activity, in euros, absolute values, represented in 10^6, and transformed afterwards into 10^3. Also, we have collected data with respect to Final Energy Consumption, being the energy supplied to the final consumer’s door for all energy uses (metadata- Eurostat), whose data was also collected by economic activity sector. Data collected for energy consumption is measured in toe (tonne of oil equivalent), in absolute values and 10^3. We followed the Classification of Economic Activities (NACE) Rev.2 as the data is presented.
Figure 1 presents the evolving patterns from 2004 until 2015 of renewables share overall and by sectors. It is clearly evident that Iceland has the highest share of energy from renewable sources and Cyprus the lowest, and that the share of energy from renewable sources in the transport sector jumped in Finland from 2012 onwards (21.99% in 2015). The share of energy from renewable sources for electricity is higher in Iceland (surpassing the 100% in 2007) and lower in Cyprus (8.44% in 2015 is the highest reported percentage).
Methodology and Results Discussion
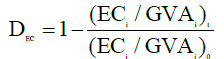
Our main research question is to infer about the country’s and sector decoupling situation. For that we start by using two main methods to measure GHG emissions which are the decoupling index and the Tapio [6] decoupling model. The decoupling index analyzes the decoupling relationship between energy consumption and economic growth. It is calculated by using:
 (1)
(1)
Where DEC is the decoupling index of the relationship between energy consumption (EC) and economic growth (GVA-Gross value added since we work with sectors; the index for driving force) ranging from (-∞, 1]. The subscript i refers to the sector (Electricity; Transports) and 0 and t indicate base period and reporting period, respectively. Results are presented in Table 2 by sector and country. Due to the lack of data in terms of energy consumption for Island the country was removed from the sample for the accounting of this decoupling index.
| Decoupling Index EC - Energy Industries | |||||||||
|---|---|---|---|---|---|---|---|---|---|
| EE | BG | CZ | GR | CY | HR | FI | SI | RO | |
| 1995-1996 | -7.69% | -23.56% | 10.92% | -5.91% | -6.25% | -0.63% | -3.30% | 5.39% | 10.98% |
| 1996-1997 | 22.73% | 20.00% | 2.44% | -3.67% | 9.58% | -1.82% | 4.10% | 6.62% | 8.04% |
| 1997-1998 | 10.46% | 15.40% | 5.76% | 2.93% | 1.73% | -1.07% | 7.85% | 7.74% | 5.58% |
| 1998-1999 | 20.67% | 14.74% | 18.89% | 13.34% | 0.44% | 7.06% | 1.78% | 4.06% | 13.74% |
| 1999-2000 | 13.04% | 12.21% | -1.80% | -4.15% | 2.25% | 7.78% | 7.71% | -11.40% | 0.31% |
| 2000-2001 | 0.12% | 9.92% | 11.81% | 9.31% | 7.74% | -3.75% | 3.86% | 11.09% | 8.26% |
| 2001-2002 | 17.12% | 14.85% | 0.14% | 8.60% | 3.61% | 6.43% | -3.82% | 10.13% | 0.81% |
| 2002-2003 | -4.29% | -1.21% | 2.27% | 2.16% | -4.53% | -0.09% | -3.13% | -15.24% | 0.78% |
| 2003-2004 | 2.23% | 1.88% | 7.49% | 8.45% | 4.55% | 2.18% | 2.95% | 4.92% | 14.62% |
| 2004-2005 | 5.97% | 11.71% | 8.22% | -0.60% | 30.67% | -0.01% | 8.16% | -4.66% | 8.44% |
| 2005-2006 | 12.57% | 7.86% | 8.24% | 3.30% | 9.47% | 3.80% | 0.04% | 1.27% | 16.80% |
| 2006-2007 | -1.80% | 8.54% | 10.69% | -7.32% | 3.96% | 4.28% | 12.26% | 10.87% | 9.94% |
| 2007-2008 | 0.42% | 8.57% | 6.42% | 7.14% | -3.90% | -0.02% | 1.83% | 5.48% | 11.31% |
| 2008-2009 | 15.84% | 31.47% | 1.49% | 10.63% | 10.89% | 11.03% | -7.12% | 0.00% | 26.66% |
| 2009-2010 | 9.73% | -2.35% | 3.41% | -18.05% | 9.76% | 4.31% | -6.88% | -0.09% | 16.58% |
| 2010-2011 | 6.94% | 10.01% | 6.66% | 2.57% | 1.46% | 11.68% | 0.23% | 8.36% | 2.06% |
| 2011-2012 | 6.61% | 6.74% | 2.22% | 11.82% | 13.41% | 14.87% | -6.51% | 5.74% | -3.66% |
| 2012-2013 | -7.73% | -2.91% | 4.56% | 11.12% | -16.94% | -0.90% | 0.13% | 3.84% | 8.65% |
| 2013-2014 | 17.81% | 3.15% | 12.09% | -10.09% | -24.46% | 3.53% | 1.19% | 3.59% | 1.95% |
| Decoupling Index EC - Transports | |||||||||
| EE | BG | CZ | GR | CY | HR | FI | SI | RO | |
| 1995-1996 | 4.03% | 12.19% | -27.70% | 6.51% | -0.93% | 5.24% | 6.17% | -7.71% | -5.10% |
| 1996-1997 | 12.17% | 2.38% | 2.42% | 5.50% | 2.06% | -1.65% | 5.53% | 9.61% | -1.75% |
| 1997-1998 | 4.55% | -25.71% | 0.60% | -5.08% | 2.72% | -6.50% | 5.34% | 17.72% | 11.72% |
| 1998-1999 | 3.23% | 9.77% | -2.67% | -1.61% | 3.02% | -15.03% | 2.71% | 8.45% | 16.98% |
| 1999-2000 | 13.65% | 14.24% | 5.79% | 12.27% | 8.24% | 8.49% | 10.11% | 7.72% | 0.08% |
| 2000-2001 | -8.19% | 3.92% | 0.86% | 0.48% | -4.78% | 9.31% | 4.69% | 1.67% | -18.96% |
| 2001-2002 | 4.27% | 3.72% | -1.99% | -0.52% | -0.42% | 5.30% | 0.93% | 3.96% | 1.45% |
| 2002-2003 | 13.95% | -1.50% | -7.65% | 3.19% | -11.43% | 2.98% | -2.88% | 2.87% | 4.56% |
| 2003-2004 | 5.46% | -0.38% | -3.81% | 3.89% | 4.74% | 0.88% | 4.11% | 3.52% | 11.59% |
| 2004-2005 | 3.45% | -4.98% | -3.60% | 0.75% | 4.99% | 3.08% | 3.01% | 1.99% | 19.38% |
| 2005-2006 | 5.78% | 8.79% | 2.47% | -1.72% | 5.88% | 3.86% | -2.44% | 2.32% | 13.49% |
| 2006-2007 | -0.08% | 5.22% | 2.18% | 1.80% | 5.25% | 1.32% | 5.21% | -2.63% | 6.44% |
| 2007-2008 | 1.03% | -2.76% | 0.19% | 8.31% | -0.41% | 3.63% | 6.06% | -12.24% | -1.67% |
| 2008-2009 | -11.53% | 1.97% | -7.93% | -22.19% | -1.58% | -15.26% | -6.38% | 3.72% | -9.74% |
| 2009-2010 | 5.70% | 6.92% | 8.89% | 5.97% | -0.15% | 1.85% | -2.21% | -2.30% | -19.56% |
| 2010-2011 | 12.70% | -0.31% | -0.13% | -1.92% | 2.80% | 4.80% | 3.69% | -2.38% | -19.47% |
| 2011-2012 | 6.04% | -3.71% | 3.70% | 5.01% | 7.46% | 2.46% | 5.19% | -1.29% | 34.68% |
| 2012-2013 | 4.79% | 14.57% | 0.97% | 1.52% | 5.13% | 0.79% | -5.29% | 4.86% | -13.53% |
| 2013-2014 | -1.87% | -5.94% | 2.54% | 3.40% | 0.10% | 3.57% | 0.76% | 5.59% | 3.89% |
Note: EE - Estonia; BG - Bulgaria; CZ - Czech Republic; GR - Greece; CY - Cyprus; HR - Croatia; FI - Finland; SI- Slovenia; RO - Romania.
Table 2 : Decoupling index relationship between energy consumption and economic growth.
With respect to 2013-2014 and the electricity sector we observe that in all countries there is a positive weak decoupling in all countries except in Greece and Cyprus and for transports the same, except in Estonia and Bulgaria. There are strong values reported in 2008-2009 for both sectors and in percentage terms the decoupling index values in electricity are higher than those reported in the transport sector.
Still there are some countries like Romania were most of the time we observe positive percentage changes, meaning GHG emissions have increased by unit GVA and that there are still many efforts to be pursued in the future with respect to emission decreases. Even so, Greece and Cyprus reveal relatively high negative variations in the last analysis period but in the energy - electricity sector. A lot more remains to be done in the transport sector one of the more polluting ones and were countries still have to face challenges in order to reach the 2020 goals.
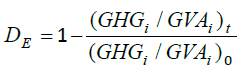
Moreover, following Wan et al. [7] we compute also the decoupling index considering an index for environmental pressure proxy by emissions and not energy consumption, but instead of using CO2 emissions as the authors, we use GHG as in equation (2).
 (2)
(2)
Where DE is the decoupling index of the relationship between greenhouse gas emissions (GHG) and economic growth (GVAGross value added since we work with sectors; the index for driving force) ranging from (-∞, 1]. For both indexes, when the growth rate of energy consumption (1) or GHG emissions (2) is greater than the growth rate of GVA, such that (0,1), a decoupling relationship exists, but when the growth rate of energy consumption (1) or GHG emissions (2) is lesser than the growth rate of GVA, such that (-∞,0], it means we are in a state of nondecoupling. Table 3 presents the results of the decoupling index considering GHG emissions (or environmental pressure).
| Decoupling Index GHG - Electricity - Energy Industries | |||||||||||||||
|---|---|---|---|---|---|---|---|---|---|---|---|---|---|---|---|
| EE | BG | CZ | GR | CY | IS | HR | FI | SI | RO | ||||||
| 1995-1996 | 0.22% | -23.93% | 2.92% | 1.61% | -2.12% | 0.00% | 3.59% | -23.86% | 12.64% | 6.31% | |||||
| 1996-1997 | 14.68% | 12.85% | 6.81% | -9.51% | -1.70% | 0.00% | 1.29% | 16.90% | 2.09% | 5.32% | |||||
| 1997-1998 | 7.11% | 3.31% | 1.67% | -0.76% | -4.22% | -62.02% | -14.07% | 22.58% | 2.39% | 4.66% | |||||
| 1998-1999 | 3.81% | 6.12% | 5.64% | 6.87% | -3.65% | 35.53% | -1.03% | 6.84% | 15.57% | 12.65% | |||||
| 1999-2000 | 18.09% | 14.49% | 0.12% | -4.47% | 0.87% | 19.74% | 18.06% | 17.24% | 0.10% | -1.19% | |||||
| 2000-2001 | 11.19% | -5.16% | 5.26% | 9.62% | 8.00% | 38.82% | -9.66% | -22.71% | -6.94% | 8.07% | |||||
| 2001-2002 | 10.98% | 17.98% | 0.51% | 8.29% | -2.10% | -83.54% | -10.31% | -10.43% | 1.09% | 13.04% | |||||
| 2002-2003 | -3.00% | 0.20% | 2.88% | -2.72% | -7.82% | 13.27% | -5.88% | -26.44% | 7.08% | -9.57% | |||||
| 2003-2004 | 4.70% | 2.82% | 10.73% | 0.29% | 3.79% | 5.52% | 22.31% | 15.89% | 5.12% | 23.19% | |||||
| 2004-2005 | 15.45% | 11.16% | 4.78% | 0.18% | -3.08% | -86.06% | 0.79% | 34.84% | 1.91% | 6.57% | |||||
| 2005-2006 | 14.57% | 7.39% | 9.05% | 8.52% | -6.64% | 47.91% | 9.72% | -37.15% | 3.59% | 9.13% | |||||
| 2006-2007 | -8.92% | -0.10% | 3.27% | -4.84% | 3.01% | -335.16% | -9.16% | 15.48% | 2.45% | 4.75% | |||||
| 2007-2008 | 7.87% | -10.17% | 8.31% | 0.80% | -7.77% | 91.62% | 13.78% | 18.46% | 1.21% | 14.56% | |||||
| 2008-2009 | -0.11% | 6.65% | -1.12% | -2.13% | -2.19% | -60.38% | 0.28% | -35.66% | -16.20% | 14.40% | |||||
| 2009-2010 | -12.74% | -4.17% | -7.05% | -12.40% | 3.27% | 69.22% | 8.73% | -12.53% | 2.08% | 27.65% | |||||
| 2010-2011 | 10.06% | 1.78% | 5.95% | -5.31% | -6.78% | -92.41% | 2.24% | 18.44% | 5.32% | -4.54% | |||||
| 2011-2012 | 10.94% | 15.27% | 5.13% | 0.96% | -0.44% | -58.21% | 13.95% | 8.12% | 8.09% | 0.61% | |||||
| 2012-2013 | -12.25% | 11.21% | 6.88% | 15.24% | 13.20% | 1.43% | 4.50% | -7.00% | 7.51% | 23.20% | |||||
| 2013-2014 | 7.31% | -1.53% | 15.43% | 5.94% | -7.60% | -4.03% | 12.58% | 12.48% | 27.76% | 5.86% | |||||
| Decoupling Index GHG - Transports | |||||||||||||||
| EE | BG | CZ | GR | CY | IS | HR | FI | SI | RO | ||||||
| 1995-1996 | 7.84% | 7.54% | -7.75% | 5.93% | -3.65% | 0.00% | 0.49% | 4.53% | -11.42% | -10.91% | |||||
| 1996-1997 | 9.82% | -1.77% | 3.92% | 3.83% | 0.11% | 0.00% | 0.70% | 5.82% | 12.19% | -1.57% | |||||
| 1997-1998 | 5.21% | -29.54% | 0.08% | -6.98% | 2.87% | 5.09% | -4.31% | 5.61% | 15.22% | 11.79% | |||||
| 1998-1999 | 10.02% | 6.83% | -4.41% | -1.11% | 2.96% | 1.74% | -16.81% | 3.71% | 8.38% | 17.47% | |||||
| 1999-2000 | 13.91% | 16.11% | 6.47% | 14.10% | 7.93% | -1.60% | 8.02% | 6.12% | 3.71% | 0.60% | |||||
| 2000-2001 | -10.20% | 4.84% | -0.52% | -1.90% | -0.39% | -0.21% | 9.17% | 5.10% | 2.56% | -20.14% | |||||
| 2001-2002 | 3.56% | 4.30% | -2.31% | -0.78% | -1.42% | 3.28% | 5.75% | 0.82% | 8.77% | 1.03% | |||||
| 2002-2003 | 15.06% | -1.60% | -7.95% | 2.47% | -11.01% | -23.15% | 2.59% | -2.51% | 0.42% | 4.22% | |||||
| 2003-2004 | 6.12% | 1.48% | -3.64% | 3.82% | 0.24% | 2.76% | 0.65% | 5.07% | 3.34% | 10.84% | |||||
| 2004-2005 | 7.08% | -3.76% | -4.86% | 1.84% | 4.11% | -0.48% | 4.10% | 3.10% | 1.87% | 19.33% | |||||
| 2005-2006 | 3.49% | 7.41% | 2.65% | -1.19% | 7.08% | -22.66% | 3.64% | -1.40% | 1.47% | 13.09% | |||||
| 2006-2007 | 1.92% | 4.28% | 2.42% | 1.64% | 2.23% | 13.16% | 0.48% | 6.42% | -1.74% | 8.83% | |||||
| 2007-2008 | 0.76% | -2.59% | 1.51% | 10.06% | 0.21% | 3.96% | 5.40% | 8.89% | -12.54% | -0.78% | |||||
| 2008-2009 | -14.45% | -0.14% | -6.87% | -29.00% | -3.62% | 0.93% | -16.04% | -5.90% | 1.32% | -7.85% | |||||
| 2009-2010 | 5.41% | 8.05% | 9.09% | 5.55% | -0.24% | 0.24% | 1.97% | -2.07% | 2.14% | -18.35% | |||||
| 2010-2011 | 11.87% | -0.30% | 1.29% | 0.79% | 6.23% | 9.66% | 5.62% | 6.95% | -5.01% | -15.57% | |||||
| 2011-2012 | 6.29% | -2.22% | 2.97% | 8.05% | 6.93% | -0.13% | 3.98% | 5.19% | -1.70% | 31.95% | |||||
| 2012-2013 | 3.57% | 16.74% | 0.87% | -8.04% | 4.89% | 6.10% | 0.71% | -4.00% | 5.94% | -14.30% | |||||
| 2013-2014 | -0.64% | -8.39% | 3.10% | 6.69% | -0.12% | 5.20% | 3.38% | 8.00% | 5.95% | 2.67% | |||||
Note: EE - Estonia; BG - Bulgaria; CZ - Czech Republic; GR - Greece; CY - Cyprus; IS - Iceland; HR - Croatia; FI -Finland; SI - Slovenia; RO - Romania.
Table 3 : Decoupling index relationship between GHG emissions and economic growth.
It is evident that the decoupling elasticity in the period 2005-2008 has decreased. In this period the economies were growing but at the same time emissions were also increasing but at a lower rate than GVA growth. This improvement in both the electricity and transport sectors might be due to the implementation of public policies such as Kyoto. The years 2008-2009 are very atypical in all countries and for both sectors in terms of percentage values of the decoupling index. A potential explanation for this observation is the adverse impact on the electricity-energy sector and that of transports also caused by the 2007/2008 global financial crisis. Even so, we do not observe an expansionary negative decoupling as do Wan et al. [7] for the industry sector in China.
It is clearly evident that there is no reported path in terms of decoupling of emissions with respect to economic growth, but there are countries like Cyprus where there is evidence of strong decoupling (the negative constant reported values), more evidence in all countries for weak decoupling (positive and lower than 1 values) and evidence of weak negative decoupling between 2008-2009 and 2009-2010 for almost all countries. This fact is attributed mostly to the negative effect of the economicfinancial crisis spread all over the world causing negative values of both emissions and GVA mostly due to the non-growth effect and impact over GHG. Values are clearly higher in the electricity industry than in the transport sector and only in Bulgaria and Cyprus there are negative emissions decoupling percentages in 2013-2014 for both sectors.
It should also be noticed that in some countries the negative percentages can be justified not only by strict emissions reductions during the financial crisis years but because electricity consumption has simultaneously decreased. As such, the consumption patterns together with lower GVA levels may justify these decreases. Thus, lower emissions may be due to lower energy consumption or lower GVA levels as also stated by Magazzino et al. [8]. In fact, reduction of emission intensity of GVA means reducing pollution per unit of GVA, but if GVA grows the emissions also grow along with it. It is a clear fact that for instance, if GVA of a nation remains constant, then reduction in values of emission intensity reduces the pollution proportionately. On the other hand, if the GVA growth rate increases then the overall reduction in value of absolute emission may or may not reduce, which might have happen in recent years as results seem to indicate. To be able to see if GVA grew and GHG emissions decreased we have to move one step forward and use the Tapio [6] decomposition approach.
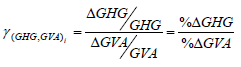
The Tapio [6] decoupling model is based over the elasticity concept. It uses the flexibility index to analyze the decoupling relationship between environmental pressure and economic growth and is represented by:
 (3)
(3)
Where γ(GHG,GVA)i is the elasticity of the decoupling indicators between GHG emissions and economic growth (GVA), representing the impact of sector emissions to sector economic growth. Table 4 presents the eight states of decoupling as proposed by Tapio [6].
| State | Environmental Pressure | Economic Growth | Elasticity: γ | |
|---|---|---|---|---|
| Negative Decoupling | Expansive Negative Decoupling | (0; +∞)= ΔGHG>0 | (0; +∞)= ΔGVA>0 | γ∈(1.2; +∞) |
| Strong Negative Decoupling | (0; +∞)= ΔGHG>0 | (-∞;0)= ΔGVA <0 | γ∈(-∞;0) | |
| Weak Negative Decoupling | (-∞;0)= ΔGHG<0 | (-∞;0)= ΔGVA <0 | γ∈(0;0.8) | |
| Decoupling | Weak Decoupling | (0; +∞)= ΔGHG>0 | (0; +∞)= ΔGVA >0 | γ∈(0;0.8) |
| Strong Decoupling | (-∞;0)= ΔGHG<0 | (0; +∞)= ΔGVA <0 | γ∈(-∞;0) | |
| Recessive Decoupling | (-∞;0)= ΔGHG<0 | (-∞;0)= ΔGVA >0 | γ∈(1.2; +∞) | |
| Coupling | Expansive Coupling | (0; +∞)= ΔGHG>0 | (0; +∞)= ΔGVA >0 | γ∈(0.8;1.2) |
| Recessive Coupling | (-∞;0)= ΔGHG<0 | (-∞;0)= ΔGVA <0 | γ∈(0.8;1.2) | |
Table 4: Eight different decoupling states ([6]; Figure 1).
Coupling is defined as elasticity values of 0.8 to 1.2. The growth of the variables per se can be positive or negative, expressed as expansive coupling and recessive coupling, respectively. In weak decoupling both variables increase (0 < elasticity < 0.8), in strong decoupling GVA grows and GHG decreases (elasticity < 0) and in recessive decoupling both variables decrease (elasticity > 1.2). Negative decoupling includes expansive negative decoupling when both variables increase (elasticity > 1.2), strong negative decoupling when GVA decreases and GHG increases (elasticity < 0) and weak negative decoupling when both variables decrease (0 < elasticity < 0.8). The ideal situation is that corresponding to strong decoupling and to a lower extent that of recessive decoupling, where we have negative variations in GHG as desired but still positive economic growth in the former, and negative variations in GHG higher than those negative variations in GVA (although a negative change in GVA is bad in economic terms) in the later.
Tables 5a-5g presents the Tapio results for all the ten countries considered individually and for both sectors (electricity/energy and transports). For the electricity sector we observe coupling during 1995-1996, 2008-2009 and for transports only during 2007-2008 in Estonia. Comparing both sectors in Estonia we observe more periods of strong decoupling in the electricity sector indicating effective attempts in cutting emissions whereas we have evidence of long periods of weak decoupling in the transport sector, meaning economic growth accompanied with more emissions, even more stronger in 2013-2014 in the transport sector with the Tapio [6] index being higher than 1.2.
| Decoupling Index Tapio - Electricity/Energy Industries | Decoupling Index Tapio - Transports Industry | |||||||
|---|---|---|---|---|---|---|---|---|
| EE - Estonia | EE - Estonia | |||||||
| Period | ΔGHG/GHG | ΔGVA/GVA | γ | State | ΔGHG/GHG | ΔGVA/GVA | γ | State |
| 1995-1996 | 0.04 | 0.04 | 0.94 | Expansive Coupling | 0.04 | 0.13 | 0.33 | Weak Decoupling |
| 1996-1997 | -0.03 | 0.14 | -0.20 | Strong Decoupling | 0.06 | 0.18 | 0.36 | Weak Decoupling |
| 1997-1998 | -0.11 | -0.04 | 2.69 | Recessive Decoupling | 0.03 | 0.09 | 0.35 | Weak Decoupling |
| 1998-1999 | -0.04 | -0.01 | 6.88 | Recessive Decoupling | -0.06 | 0.04 | -1.62 | Strong Decoupling |
| 1999-2000 | -0.04 | 0.18 | -0.20 | Strong Decoupling | -0.01 | 0.15 | -0.05 | Strong Decoupling |
| 2000-2001 | -0.02 | 0.11 | -0.14 | Strong Decoupling | 0.19 | 0.08 | 2.31 | Expansive Negative Decoupling |
| 2001-2002 | -0.02 | 0.10 | -0.24 | Strong Decoupling | 0.07 | 0.10 | 0.63 | Weak Decoupling |
| 2002-2003 | 0.16 | 0.12 | 1.27 | Expansive Negative Decoupling | -0.05 | 0.12 | -0.42 | Strong Decoupling |
| 2003-2004 | -0.01 | 0.04 | -0.13 | Strong Decoupling | 0.02 | 0.09 | 0.25 | Weak Decoupling |
| 2004-2005 | -0.06 | 0.11 | -0.52 | Strong Decoupling | 0.03 | 0.11 | 0.30 | Weak Decoupling |
| 2005-2006 | -0.06 | 0.10 | -0.59 | Strong Decoupling | 0.07 | 0.11 | 0.66 | Weak Decoupling |
| 2006-2007 | 0.19 | 0.09 | 2.03 | Expansive Negative Decoupling | 0.05 | 0.07 | 0.72 | Weak Decoupling |
| 2007-2008 | -0.09 | -0.02 | 5.90 | Recessive Decoupling | -0.05 | -0.04 | 1.17 | Recessive Coupling |
| 2008-2009 | -0.15 | -0.15 | 0.99 | Recessive Coupling | -0.08 | -0.19 | 0.40 | Weak Negative Decoupling |
| 2009-2010 | 0.33 | 0.18 | 1.83 | Expansive Negative Decoupling | 0.06 | 0.12 | 0.50 | Weak Decoupling |
| 2010-2011 | 0.02 | 0.14 | 0.16 | Weak Decoupling | 0.00 | 0.14 | 0.03 | Weak Decoupling |
| 2011-2012 | -0.10 | 0.01 | -9.43 | Strong Decoupling | 0.01 | 0.08 | 0.14 | Weak Decoupling |
| 2012-2013 | 0.17 | 0.04 | 3.90 | Expansive Negative Decoupling | -0.02 | 0.01 | -1.97 | Strong Decoupling |
| 2013-2014 | -0.03 | 0.05 | -0.50 | Strong Decoupling | 0.01 | 0.00 | 2.48 | Expansive Negative Decoupling |
| 1995-2014 | 0.04 | 2.15 | 0.02 | Weak Decoupling | 0.43 | 2.65 | 0.16 | Weak Decoupling |
Table 5a: Tapio decoupling index in electricity and transports sectors: the top ten European issuers of GHG per GVA for the period 1995-2014.
| Decoupling Index Tapio - Electricity/Energy Industries | Decoupling Index Tapio - Transports Industry | |||||||
|---|---|---|---|---|---|---|---|---|
| BG - Bulgaria | BG - Bulgaria | |||||||
| Period | ΔGHG/GHG | ΔGVA/GVA | γ | State | ΔGHG/GHG | ΔGVA/GVA | γ | State |
| 1995-1996 | -0.01 | -0.20 | 0.03 | Weak Negative Decoupling | -0.02 | 0.06 | -0.40 | Strong Decoupling |
| 1996-1997 | 0.07 | 0.23 | 0.31 | Weak Decoupling | 0.00 | -0.01 | -0.37 | Strong Negative Decoupling |
| 1997-1998 | -0.04 | -0.01 | 4.79 | Recessive Decoupling | 0.27 | -0.02 | -12.43 | Strong Negative Decoupling |
| 1998-1999 | -0.13 | -0.07 | 1.79 | Recessive Decoupling | 0.04 | 0.12 | 0.36 | Weak Decoupling |
| 1999-2000 | -0.01 | 0.16 | -0.04 | Strong Decoupling | -0.04 | 0.14 | -0.29 | Strong Decoupling |
| 2000-2001 | 0.16 | 0.10 | 1.55 | Expansive Negative Decoupling | 0.03 | 0.08 | 0.34 | Weak Decoupling |
| 2001-2002 | -0.10 | 0.10 | -0.94 | Strong Decoupling | 0.04 | 0.09 | 0.48 | Weak Decoupling |
| 2002-2003 | 0.07 | 0.08 | 0.97 | Expansive Coupling | 0.10 | 0.08 | 1.21 | Expansive Negative Decoupling |
| 2003-2004 | -0.01 | 0.02 | -0.60 | Strong Decoupling | 0.05 | 0.07 | 0.76 | Weak Decoupling |
| 2004-2005 | 0.01 | 0.13 | 0.06 | Weak Decoupling | 0.12 | 0.07 | 1.54 | Expansive Negative Decoupling |
| 2005-2006 | 0.01 | 0.09 | 0.12 | Weak Decoupling | 0.06 | 0.15 | 0.42 | Weak Decoupling |
| 2006-2007 | 0.12 | 0.12 | 1.01 | Expansive Coupling | -0.02 | 0.02 | -0.77 | Strong Decoupling |
| 2007-2008 | 0.05 | -0.05 | -1.05 | Strong Negative Decoupling | 0.05 | 0.02 | 2.22 | Expansive Negative Decoupling |
| 2008-2009 | -0.08 | -0.02 | 5.14 | Recessive Decoupling | -0.04 | -0.04 | 0.97 | Recessive Coupling |
| 2009-2010 | 0.07 | 0.02 | 2.86 | Expansive Negative Decoupling | -0.03 | 0.06 | -0.53 | Strong Decoupling |
| 2010-2011 | 0.15 | 0.17 | 0.88 | Expansive Coupling | 0.02 | 0.02 | 1.15 | Expansive Coupling |
| 2011-2012 | -0.13 | 0.02 | -5.27 | Strong Decoupling | 0.04 | 0.01 | 2.72 | Expansive Negative Decoupling |
| 2012-2013 | -0.14 | -0.03 | 5.09 | Recessive Decoupling | -0.12 | 0.06 | -1.95 | Strong Decoupling |
| 2013-2014 | 0.06 | 0.05 | 1.35 | Expansive Negative Decoupling | 0.14 | 0.05 | 2.69 | Expansive Negative Decoupling |
| 1995-2014 | 0.06 | 1.29 | 0.05 | Weak Decoupling | 0.86 | 1.67 | 0.52 | Weak Decoupling |
| Decoupling Index Tapio - Electricity/Energy Industries | Decoupling Index Tapio - Transports Industry | |||||||
| CZ - Czech Republic | CZ - Czech Republic | |||||||
| Period | ΔGHG/GHG | ΔGVA/GVA | γ | State | ΔGHG/GHG | ΔGVA/GVA | γ | State |
| 1995-1996 | 0.08 | 0.11 | 0.70 | Weak Decoupling | 0.11 | 0.03 | 3.81 | Expansive Negative Decoupling |
| 1996-1997 | -0.06 | 0.01 | -4.20 | Strong Decoupling | 0.01 | 0.05 | 0.18 | Weak Decoupling |
| 1997-1998 | -0.03 | -0.02 | 1.94 | Recessive Decoupling | 0.03 | 0.03 | 0.97 | Expansive Coupling |
| 1998-1999 | -0.04 | 0.02 | -2.52 | Strong Decoupling | 0.12 | 0.07 | 1.69 | Expansive Negative Decoupling |
| 1999-2000 | 0.07 | 0.07 | 0.98 | Expansive Coupling | 0.01 | 0.08 | 0.16 | Weak Decoupling |
| 2000-2001 | 0.04 | 0.09 | 0.38 | Weak Decoupling | 0.06 | 0.06 | 1.10 | Expansive Coupling |
| 2001-2002 | -0.02 | -0.02 | 1.29 | Recessive Decoupling | 0.05 | 0.02 | 2.00 | Expansive Negative Decoupling |
| 2002-2003 | -0.01 | 0.02 | -0.23 | Strong Decoupling | 0.13 | 0.05 | 2.63 | Expansive Negative Decoupling |
| 2003-2004 | 0.00 | 0.12 | 0.01 | Weak Decoupling | 0.05 | 0.01 | 3.72 | Expansive Negative Decoupling |
| 2004-2005 | 0.01 | 0.06 | 0.16 | Weak Decoupling | 0.08 | 0.03 | 2.50 | Expansive Negative Decoupling |
| 2005-2006 | -0.01 | 0.09 | -0.10 | Strong Decoupling | 0.04 | 0.07 | 0.57 | Weak Decoupling |
| 2006-2007 | 0.06 | 0.09 | 0.62 | Weak Decoupling | 0.05 | 0.08 | 0.67 | Weak Decoupling |
| 2007-2008 | -0.07 | 0.01 | -5.61 | Strong Decoupling | -0.01 | 0.01 | -1.13 | Strong Decoupling |
| 2008-2009 | -0.07 | -0.08 | 0.86 | Recessive Coupling | -0.03 | -0.09 | 0.31 | Weak Negative Decoupling |
| 2009-2010 | 0.08 | 0.01 | 11.02 | Expansive Negative Decoupling | -0.06 | 0.04 | -1.56 | Strong Decoupling |
| 2010-2011 | -0.005 | 0.06 | -0.08 | Strong Decoupling | -0.01 | 0.00 | -8.57 | Strong Decoupling |
| 2011-2012 | -0.04 | 0.01 | -2.67 | Strong Decoupling | -0.02 | 0.01 | -1.67 | Strong Decoupling |
| 2012-2013 | -0.06 | 0.01 | -4.24 | Strong Decoupling | -0.01 | -0.0003 | 29.59 | Recessive Decoupling |
| 2013-2014 | -0.05 | 0.12 | -0.42 | Strong Decoupling | 0.03 | 0.06 | 0.48 | Weak Decoupling |
| 1995-2014 | -0.14 | 1.15 | -0.12 | Strong Decoupling | 0.83 | 0.80 | 1.04 | Expansive Coupling |
Table 5b: Tapio decoupling index in electricity and transports sectors: the top ten European issuers of GHG per GVA for the period 1995-2014 (continued).
| Decoupling Index Tapio - Electricity/Energy Industries | Decoupling Index Tapio - Transports Industry | |||||||
|---|---|---|---|---|---|---|---|---|
| BG - Bulgaria | BG - Bulgaria | |||||||
| Period | ΔGHG/GHG | ΔGVA/GVA | γ | State | ΔGHG/GHG | ΔGVA/GVA | γ | State |
| 1995-1996 | -0.01 | -0.20 | 0.03 | Weak Negative Decoupling | -0.02 | 0.06 | -0.40 | Strong Decoupling |
| 1996-1997 | 0.07 | 0.23 | 0.31 | Weak Decoupling | 0.00 | -0.01 | -0.37 | Strong Negative Decoupling |
| 1997-1998 | -0.04 | -0.01 | 4.79 | Recessive Decoupling | 0.27 | -0.02 | -12.43 | Strong Negative Decoupling |
| 1998-1999 | -0.13 | -0.07 | 1.79 | Recessive Decoupling | 0.04 | 0.12 | 0.36 | Weak Decoupling |
| 1999-2000 | -0.01 | 0.16 | -0.04 | Strong Decoupling | -0.04 | 0.14 | -0.29 | Strong Decoupling |
| 2000-2001 | 0.16 | 0.10 | 1.55 | Expansive Negative Decoupling | 0.03 | 0.08 | 0.34 | Weak Decoupling |
| 2001-2002 | -0.10 | 0.10 | -0.94 | Strong Decoupling | 0.04 | 0.09 | 0.48 | Weak Decoupling |
| 2002-2003 | 0.07 | 0.08 | 0.97 | Expansive Coupling | 0.10 | 0.08 | 1.21 | Expansive Negative Decoupling |
| 2003-2004 | -0.01 | 0.02 | -0.60 | Strong Decoupling | 0.05 | 0.07 | 0.76 | Weak Decoupling |
| 2004-2005 | 0.01 | 0.13 | 0.06 | Weak Decoupling | 0.12 | 0.07 | 1.54 | Expansive Negative Decoupling |
| 2005-2006 | 0.01 | 0.09 | 0.12 | Weak Decoupling | 0.06 | 0.15 | 0.42 | Weak Decoupling |
| 2006-2007 | 0.12 | 0.12 | 1.01 | Expansive Coupling | -0.02 | 0.02 | -0.77 | Strong Decoupling |
| 2007-2008 | 0.05 | -0.05 | -1.05 | Strong Negative Decoupling | 0.05 | 0.02 | 2.22 | Expansive Negative Decoupling |
| 2008-2009 | -0.08 | -0.02 | 5.14 | Recessive Decoupling | -0.04 | -0.04 | 0.97 | Recessive Coupling |
| 2009-2010 | 0.07 | 0.02 | 2.86 | Expansive Negative Decoupling | -0.03 | 0.06 | -0.53 | Strong Decoupling |
| 2010-2011 | 0.15 | 0.17 | 0.88 | Expansive Coupling | 0.02 | 0.02 | 1.15 | Expansive Coupling |
| 2011-2012 | -0.13 | 0.02 | -5.27 | Strong Decoupling | 0.04 | 0.01 | 2.72 | Expansive Negative Decoupling |
| 2012-2013 | -0.14 | -0.03 | 5.09 | Recessive Decoupling | -0.12 | 0.06 | -1.95 | Strong Decoupling |
| 2013-2014 | 0.06 | 0.05 | 1.35 | Expansive Negative Decoupling | 0.14 | 0.05 | 2.69 | Expansive Negative Decoupling |
| 1995-2014 | 0.06 | 1.29 | 0.05 | Weak Decoupling | 0.86 | 1.67 | 0.52 | Weak Decoupling |
| Decoupling Index Tapio - Electricity/Energy Industries | Decoupling Index Tapio - Transports Industry | |||||||
| CZ - Czech Republic | CZ - Czech Republic | |||||||
| Period | ΔGHG/GHG | ΔGVA/GVA | γ | State | ΔGHG/GHG | ΔGVA/GVA | γ | State |
| 1995-1996 | 0.08 | 0.11 | 0.70 | Weak Decoupling | 0.11 | 0.03 | 3.81 | Expansive Negative Decoupling |
| 1996-1997 | -0.06 | 0.01 | -4.20 | Strong Decoupling | 0.01 | 0.05 | 0.18 | Weak Decoupling |
| 1997-1998 | -0.03 | -0.02 | 1.94 | Recessive Decoupling | 0.03 | 0.03 | 0.97 | Expansive Coupling |
| 1998-1999 | -0.04 | 0.02 | -2.52 | Strong Decoupling | 0.12 | 0.07 | 1.69 | Expansive Negative Decoupling |
| 1999-2000 | 0.07 | 0.07 | 0.98 | Expansive Coupling | 0.01 | 0.08 | 0.16 | Weak Decoupling |
| 2000-2001 | 0.04 | 0.09 | 0.38 | Weak Decoupling | 0.06 | 0.06 | 1.10 | Expansive Coupling |
| 2001-2002 | -0.02 | -0.02 | 1.29 | Recessive Decoupling | 0.05 | 0.02 | 2.00 | Expansive Negative Decoupling |
| 2002-2003 | -0.01 | 0.02 | -0.23 | Strong Decoupling | 0.13 | 0.05 | 2.63 | Expansive Negative Decoupling |
| 2003-2004 | 0.00 | 0.12 | 0.01 | Weak Decoupling | 0.05 | 0.01 | 3.72 | Expansive Negative Decoupling |
| 2004-2005 | 0.01 | 0.06 | 0.16 | Weak Decoupling | 0.08 | 0.03 | 2.50 | Expansive Negative Decoupling |
| 2005-2006 | -0.01 | 0.09 | -0.10 | Strong Decoupling | 0.04 | 0.07 | 0.57 | Weak Decoupling |
| 2006-2007 | 0.06 | 0.09 | 0.62 | Weak Decoupling | 0.05 | 0.08 | 0.67 | Weak Decoupling |
| 2007-2008 | -0.07 | 0.01 | -5.61 | Strong Decoupling | -0.01 | 0.01 | -1.13 | Strong Decoupling |
| 2008-2009 | -0.07 | -0.08 | 0.86 | Recessive Coupling | -0.03 | -0.09 | 0.31 | Weak Negative Decoupling |
| 2009-2010 | 0.08 | 0.01 | 11.02 | Expansive Negative Decoupling | -0.06 | 0.04 | -1.56 | Strong Decoupling |
| 2010-2011 | -0.005 | 0.06 | -0.08 | Strong Decoupling | -0.01 | 0.00 | -8.57 | Strong Decoupling |
| 2011-2012 | -0.04 | 0.01 | -2.67 | Strong Decoupling | -0.02 | 0.01 | -1.67 | Strong Decoupling |
| 2012-2013 | -0.06 | 0.01 | -4.24 | Strong Decoupling | -0.01 | -0.0003 | 29.59 | Recessive Decoupling |
| 2013-2014 | -0.05 | 0.12 | -0.42 | Strong Decoupling | 0.03 | 0.06 | 0.48 | Weak Decoupling |
| 1995-2014 | -0.14 | 1.15 | -0.12 | Strong Decoupling | 0.83 | 0.80 | 1.04 | Expansive Coupling |
Moreover, the period 2004-2005 in electricity in Estonia, Finland and Romania, and the most recent periods seem to be the more “actives” in terms of strong decoupling
Table 5c: Tapio decoupling index in electricity and transports sectors: the top ten European issuers of GHG per GVA for the period 1995-2014.
| Decoupling Index Tapio - Electricity/Energy Industries | Decoupling Index Tapio - Transports Industry | |||||||
|---|---|---|---|---|---|---|---|---|
| GR - Greece | GR - Greece | |||||||
| Period | ΔGHG/GHG | ΔGVA/GVA | γ | State | ΔGHG/GHG | ΔGVA/GVA | γ | State |
| 1995-1996 | -0.02 | -0.002 | 8.41 | Recessive Decoupling | 0.03 | 0.09 | 0.29 | Weak Decoupling |
| 1996-1997 | 0.08 | -0.02 | -5.01 | Strong Negative Decoupling | 0.04 | 0.08 | 0.51 | Weak Decoupling |
| 1997-1998 | 0.05 | 0.05 | 1.18 | Expansive Coupling | 0.10 | 0.03 | 3.28 | Expansive Negative Decoupling |
| 1998-1999 | 0.01 | 0.08 | 0.07 | Weak Decoupling | 0.02 | 0.01 | 2.95 | Expansive Negative Decoupling |
| 1999-2000 | 0.09 | 0.04 | 2.11 | Expansive Negative Decoupling | -0.05 | 0.10 | -0.53 | Strong Decoupling |
| 2000-2001 | 0.01 | 0.12 | 0.08 | Weak Decoupling | 0.05 | 0.03 | 1.69 | Expansive Negative Decoupling |
| 2001-2002 | -0.01 | 0.08 | -0.13 | Strong Decoupling | 0.02 | 0.01 | 1.94 | Expansive Negative Decoupling |
| 2002-2003 | 0.02 | -0.004 | -5.18 | Strong Negative Decoupling | 0.05 | 0.08 | 0.67 | Weak Decoupling |
| 2003-2004 | 0.02 | 0.03 | 0.89 | Expansive Coupling | 0.02 | 0.06 | 0.34 | Weak Decoupling |
| 2004-2005 | 0.01 | 0.02 | 0.88 | Expansive Coupling | 0.00 | 0.02 | 0.13 | Weak Decoupling |
| 2005-2006 | -0.04 | 0.05 | -0.71 | Strong Decoupling | 0.04 | 0.03 | 1.45 | Expansive Negative Decoupling |
| 2006-2007 | 0.06 | 0.01 | 4.73 | Expansive Negative Decoupling | 0.03 | 0.05 | 0.66 | Weak Decoupling |
| 2007-2008 | -0.02 | -0.01 | 1.53 | Recessive Decoupling | -0.04 | 0.07 | -0.64 | Strong Decoupling |
| 2008-2009 | -0.06 | -0.08 | 0.76 | Weak Negative Decoupling | 0.13 | -0.13 | -1.01 | Strong Negative Decoupling |
| 2009-2010 | -0.04 | -0.15 | 0.30 | Weak Negative Decoupling | -0.11 | -0.06 | 1.91 | Recessive Decoupling |
| 2010-2011 | 0.03 | -0.02 | -1.96 | Strong Negative Decoupling | -0.11 | -0.10 | 1.07 | Recessive Coupling |
| 2011-2012 | 0.01 | 0.02 | 0.56 | Weak Decoupling | -0.18 | -0.11 | 1.63 | Recessive Decoupling |
| 2012-2013 | -0.10 | 0.07 | -1.50 | Strong Decoupling | 0.10 | 0.02 | 5.83 | Expansive Negative Decoupling |
| 2013-2014 | -0.07 | -0.01 | 6.51 | Recessive Decoupling | -0.01 | 0.06 | -0.25 | Strong Decoupling |
| 1995-2014 | 0.02 | 0.26 | 0.08 | Weak Decoupling | 0.06 | 0.33 | 0.18 | Weak Decoupling |
| Decoupling Index Tapio - Electricity/Energy Industries | Decoupling Index Tapio - Transports Industry | |||||||
| CY - Cyprus | CY - Cyprus | |||||||
| Period | ΔGHG/GHG | ΔGVA/GVA | γ | State | ΔGHG/GHG | ΔGVA/GVA | γ | State |
| 1995-1996 | 0.05 | 0.03 | 1.70 | Expansive Negative Decoupling | 0.03 | -0.003 | -11.72 | Strong Negative Decoupling |
| 1996-1997 | 0.06 | 0.04 | 1.45 | Expansive Negative Decoupling | 0.04 | 0.04 | 0.97 | Expansive Coupling |
| 1997-1998 | 0.10 | 0.05 | 1.85 | Expansive Negative Decoupling | 0.05 | 0.08 | 0.61 | Weak Decoupling |
| 1998-1999 | 0.07 | 0.03 | 2.19 | Expansive Negative Decoupling | 0.03 | 0.06 | 0.46 | Weak Decoupling |
| 1999-2000 | 0.05 | 0.05 | 0.83 | Expansive Coupling | 0.02 | 0.11 | 0.22 | Weak Decoupling |
| 2000-2001 | -0.04 | 0.04 | -0.90 | Strong Decoupling | 0.03 | 0.03 | 1.14 | Expansive Coupling |
| 2001-2002 | 0.06 | 0.03 | 1.62 | Expansive Negative Decoupling | -0.01 | -0.02 | 0.40 | Weak Negative Decoupling |
| 2002-2003 | 0.08 | -0.003 | -29.84 | Strong Negative Decoupling | 0.06 | -0.05 | -1.30 | Strong Negative Decoupling |
| 2003-2004 | 0.02 | 0.06 | 0.31 | Weak Decoupling | 0.05 | 0.06 | 0.95 | Expansive Coupling |
| 2004-2005 | 0.06 | 0.03 | 2.22 | Expansive Negative Decoupling | 0.02 | 0.06 | 0.31 | Weak Decoupling |
| 2005-2006 | 0.05 | -0.01 | -3.95 | Strong Negative Decoupling | -0.01 | 0.07 | -0.08 | Strong Decoupling |
| 2006-2007 | 0.04 | 0.07 | 0.56 | Weak Decoupling | 0.07 | 0.09 | 0.73 | Weak Decoupling |
| 2007-2008 | 0.04 | -0.03 | -1.37 | Strong Negative Decoupling | 0.02 | 0.02 | 0.90 | Expansive Coupling |
| 2008-2009 | 0.01 | -0.01 | -0.44 | Strong Negative Decoupling | 0.00 | -0.03 | -0.01 | Strong Negative Decoupling |
| 2009-2010 | -0.03 | 0.00 | -20.24 | Strong Decoupling | 0.02 | 0.02 | 1.13 | Expansive Coupling |
| 2010-2011 | -0.04 | -0.10 | 0.40 | Weak Negative Decoupling | -0.03 | 0.03 | -0.95 | Strong Decoupling |
| 2011-2012 | -0.04 | -0.05 | 0.91 | Recessive Coupling | -0.08 | -0.01 | 8.16 | Recessive Decoupling |
| 2012-2013 | -0.20 | -0.08 | 2.51 | Recessive Decoupling | -0.10 | -0.05 | 1.87 | Recessive Decoupling |
| 2013-2014 | 0.04 | -0.03 | -1.14 | Strong Negative Decoupling | -0.03 | -0.03 | 0.96 | Recessive Coupling |
| 1995-2014 | 0.36 | 0.10 | 3.52 | Expansive Negative Decoupling | 0.20 | 0.57 | 0.34 | Weak Decoupling |
Table 5d: Tapio decoupling index in electricity and transports sectors: the top ten European issuers of GHG per GVA for the period 1995-2014.
| Decoupling Index Tapio - Electricity/Energy Industries | Decoupling Index Tapio - Transports Industry | |||||||
|---|---|---|---|---|---|---|---|---|
| IS - Iceland | IS - Iceland | |||||||
| Period | ΔGHG/GHG | ΔGVA/GVA | γ | State | ΔGHG/GHG | ΔGVA/GVA | γ | State |
| 1995-1996 | -0.50 | 0.00 | 0.00 | --- | -0.02 | 0.00 | 0.00 | --- |
| 1996-1997 | -0.38 | 0.00 | 0.00 | --- | 0.02 | 0.00 | 0.00 | --- |
| 1997-1998 | 0.60 | -0.01 | -48.20 | Strong Negative Decoupling | 0.01 | 0.06 | 0.11 | Weak Decoupling |
| 1998-1999 | -0.38 | -0.03 | 12.26 | Recessive Decoupling | 0.04 | 0.06 | 0.69 | Weak Decoupling |
| 1999-2000 | -0.20 | -0.003 | 61.96 | Recessive Decoupling | 0.00 | -0.01 | -0.40 | Strong Negative Decoupling |
| 2000-2001 | -0.25 | 0.23 | -1.11 | Strong Decoupling | 0.02 | 0.01 | 1.15 | Expansive Coupling |
| 2001-2002 | 0.67 | -0.09 | -7.25 | Strong Negative Decoupling | 0.01 | 0.04 | 0.15 | Weak Decoupling |
| 2002-2003 | -0.20 | -0.08 | 2.58 | Recessive Decoupling | 0.14 | -0.07 | -2.00 | Strong Negative Decoupling |
| 2003-2004 | 0.00 | 0.06 | 0.00 | Weak Decoupling | 0.07 | 0.10 | 0.69 | Weak Decoupling |
| 2004-2005 | 0.75 | -0.06 | -12.62 | Strong Negative Decoupling | 0.01 | 0.01 | 1.80 | Expansive Negative Decoupling |
| 2005-2006 | -0.43 | 0.10 | -4.42 | Strong Decoupling | 0.17 | -0.04 | -4.12 | Strong Negative Decoupling |
| 2006-2007 | 3.25 | -0.02 | -139.20 | Strong Negative Decoupling | 0.04 | 0.19 | 0.19 | Weak Decoupling |
| 2007-2008 | -0.88 | 0.40 | -2.19 | Strong Decoupling | -0.06 | -0.02 | 3.44 | Recessive Decoupling |
| 2008-2009 | 0.50 | -0.06 | -7.73 | Strong Negative Decoupling | -0.03 | -0.02 | 1.48 | Recessive Decoupling |
| 2009-2010 | -0.67 | 0.08 | -8.02 | Strong Decoupling | -0.05 | -0.05 | 1.05 | Recessive Coupling |
| 2010-2011 | 1.00 | 0.04 | 25.34 | Expansive Negative Decoupling | -0.04 | 0.06 | -0.65 | Strong Decoupling |
| 2011-2012 | 0.50 | -0.05 | -9.63 | Strong Negative Decoupling | -0.01 | -0.01 | 0.90 | Recessive Coupling |
| 2012-2013 | 0.00 | 0.01 | 0.00 | Weak Decoupling | 0.02 | 0.08 | 0.21 | Weak Decoupling |
| 2013-2014 | 0.00 | -0.04 | 0.00 | --- | 0.00 | 0.06 | 0.04 | Weak Decoupling |
| 1995-2014 | -0.81 | 0.43 | -1.90 | Strong Decoupling | 0.38 | 0.52 | 0.73 | Weak Decoupling |
| Decoupling Index Tapio - Electricity/Energy Industries | Decoupling Index Tapio - Transports Industry | |||||||
| HR - Croatia | HR - Croatia | |||||||
| Period | ΔGHG/GHG | ΔGVA/GVA | γ | State | ΔGHG/GHG | ΔGVA/GVA | γ | State |
| 1995-1996 | -0.03 | 0.00 | -9.59 | Strong Decoupling | 0.10 | 0.11 | 0.95 | Expansive Coupling |
| 1996-1997 | 0.10 | 0.11 | 0.87 | Expansive Coupling | 0.09 | 0.10 | 0.92 | Expansive Coupling |
| 1997-1998 | 0.12 | -0.02 | -5.92 | Strong Negative Decoupling | 0.03 | -0.02 | -1.73 | Strong Negative Decoupling |
| 1998-1999 | 0.04 | 0.03 | 1.41 | Expansive Negative Decoupling | 0.07 | -0.09 | -0.74 | Strong Negative Decoupling |
| 1999-2000 | -0.10 | 0.10 | -0.94 | Strong Decoupling | 0.00 | 0.09 | 0.03 | Weak Decoupling |
| 2000-2001 | 0.10 | 0.00 | 15.52 | Expansive Negative Decoupling | 0.01 | 0.11 | 0.10 | Weak Decoupling |
| 2001-2002 | 0.14 | 0.03 | 4.19 | Expansive Negative Decoupling | 0.06 | 0.12 | 0.47 | Weak Decoupling |
| 2002-2003 | 0.09 | 0.03 | 2.92 | Expansive Negative Decoupling | 0.08 | 0.11 | 0.74 | Weak Decoupling |
| 2003-2004 | -0.14 | 0.11 | -1.32 | Strong Decoupling | 0.04 | 0.04 | 0.84 | Expansive Coupling |
| 2004-2005 | 0.00 | 0.01 | 0.29 | Weak Decoupling | 0.03 | 0.07 | 0.41 | Weak Decoupling |
| 2005-2006 | -0.03 | 0.08 | -0.33 | Strong Decoupling | 0.06 | 0.10 | 0.62 | Weak Decoupling |
| 2006-2007 | 0.17 | 0.07 | 2.37 | Expansive Negative Decoupling | 0.07 | 0.08 | 0.93 | Expansive Coupling |
| 2007-2008 | -0.13 | 0.01 | -14.53 | Strong Decoupling | -0.02 | 0.03 | -0.79 | Strong Decoupling |
| 2008-2009 | -0.06 | -0.05 | 1.05 | Recessive Coupling | 0.00 | -0.14 | -0.001 | Strong Negative Decoupling |
| 2009-2010 | -0.08 | 0.01 | -7.21 | Strong Decoupling | -0.04 | -0.02 | 2.21 | Recessive Decoupling |
| 2010-2011 | 0.04 | 0.07 | 0.64 | Weak Decoupling | -0.02 | 0.03 | -0.73 | Strong Decoupling |
| 2011-2012 | -0.11 | 0.04 | -2.71 | Strong Decoupling | -0.03 | 0.01 | -2.97 | Strong Decoupling |
| 2012-2013 | -0.07 | -0.03 | 2.61 | Recessive Decoupling | 0.02 | 0.02 | 0.69 | Weak Decoupling |
| 2013-2014 | -0.11 | 0.02 | -5.79 | Strong Decoupling | -0.01 | 0.03 | -0.36 | Strong Decoupling |
| 1995-2014 | -0.13 | 0.81 | -0.16 | Strong Decoupling | 0.67 | 1.12 | 0.60 | Weak Decoupling |
Table 5e: Tapio decoupling index in electricity and transports sectors: the top ten European issuers of GHG per GVA for the period 1995-2014.
| Decoupling Index Tapio - Electricity/Energy Industries | Decoupling Index Tapio - Transports Industry | |||||||
|---|---|---|---|---|---|---|---|---|
| FI - Finland | FI - Finland | |||||||
| Period | ΔGHG/GHG | ΔGVA/GVA | γ | State | ΔGHG/GHG | ΔGVA/GVA | γ | State |
| 1995-1996 | 0.24 | 0.00 | 51.97 | Expansive Negative Decoupling | 0.00 | 0.05 | 0.00 | Weak Decoupling |
| 1996-1997 | -0.08 | 0.11 | -0.75 | Strong Decoupling | 0.05 | 0.11 | 0.43 | Weak Decoupling |
| 1997-1998 | -0.12 | 0.14 | -0.86 | Strong Decoupling | 0.01 | 0.07 | 0.16 | Weak Decoupling |
| 1998-1999 | -0.02 | 0.05 | -0.46 | Strong Decoupling | 0.02 | 0.06 | 0.31 | Weak Decoupling |
| 1999-2000 | -0.06 | 0.13 | -0.49 | Strong Decoupling | -0.01 | 0.06 | -0.17 | Strong Decoupling |
| 2000-2001 | 0.24 | 0.01 | 17.31 | Expansive Negative Decoupling | 0.01 | 0.06 | 0.15 | Weak Decoupling |
| 2001-2002 | 0.10 | -0.002 | -51.74 | Strong Negative Decoupling | 0.01 | 0.02 | 0.64 | Weak Decoupling |
| 2002-2003 | 0.23 | -0.02 | -9.38 | Strong Negative Decoupling | 0.02 | -0.01 | -1.58 | Strong Negative Decoupling |
| 2003-2004 | -0.11 | 0.06 | -1.86 | Strong Decoupling | 0.03 | 0.08 | 0.32 | Weak Decoupling |
| 2004-2005 | -0.34 | 0.01 | -22.80 | Strong Decoupling | 0.00 | 0.03 | 0.01 | Weak Decoupling |
| 2005-2006 | 0.49 | 0.09 | 5.54 | Expansive Negative Decoupling | 0.01 | -0.002 | -7.40 | Strong Negative Decoupling |
| 2006-2007 | -0.06 | 0.11 | -0.56 | Strong Decoupling | 0.03 | 0.10 | 0.27 | Weak Decoupling |
| 2007-2008 | -0.21 | -0.03 | 6.60 | Recessive Decoupling | -0.05 | 0.04 | -1.09 | Strong Decoupling |
| 2008-2009 | 0.05 | -0.23 | -0.20 | Strong Negative Decoupling | -0.05 | -0.10 | 0.46 | Weak Negative Decoupling |
| 2009-2010 | 0.21 | 0.07 | 2.83 | Expansive Negative Decoupling | 0.04 | 0.02 | 2.05 | Expansive Negative Decoupling |
| 2010-2011 | -0.20 | -0.02 | 12.75 | Recessive Decoupling | -0.02 | 0.06 | -0.26 | Strong Decoupling |
| 2011-2012 | -0.16 | -0.09 | 1.83 | Recessive Decoupling | -0.02 | 0.03 | -0.88 | Strong Decoupling |
| 2012-2013 | 0.06 | -0.01 | -12.12 | Strong Negative Decoupling | -0.002 | -0.04 | 0.04 | Weak Negative Decoupling |
| 2013-2014 | -0.12 | 0.01 | -15.07 | Strong Decoupling | -0.09 | -0.01 | 6.40 | Recessive Decoupling |
| 1995-2014 | -0.19 | 0.38 | -0.50 | Strong Decoupling | -0.03 | 0.82 | -0.03 | Strong Decoupling |
| Decoupling Index Tapio - Electricity/Energy Industries | Decoupling Index Tapio - Transports Industry | |||||||
| SI - Slovenia | SI - Slovenia | |||||||
| Period | ΔGHG/GHG | ΔGVA/GVA | γ | State | ΔGHG/GHG | ΔGVA/GVA | γ | State |
| 1995-1996 | -0.07 | 0.07 | -1.07 | Strong Decoupling | 0.17 | 0.05 | 3.55 | Expansive Negative Decoupling |
| 1996-1997 | 0.08 | 0.10 | 0.77 | Weak Decoupling | 0.02 | 0.16 | 0.10 | Weak Decoupling |
| 1997-1998 | 0.04 | 0.07 | 0.62 | Weak Decoupling | -0.14 | 0.02 | -8.28 | Strong Decoupling |
| 1998-1999 | -0.12 | 0.05 | -2.53 | Strong Decoupling | -0.05 | 0.04 | -1.32 | Strong Decoupling |
| 1999-2000 | 0.06 | 0.06 | 0.98 | Expansive Coupling | 0.04 | 0.08 | 0.50 | Weak Decoupling |
| 2000-2001 | 0.13 | 0.06 | 2.33 | Expansive Negative Decoupling | 0.03 | 0.06 | 0.54 | Weak Decoupling |
| 2001-2002 | 0.04 | 0.05 | 0.78 | Weak Decoupling | -0.03 | 0.06 | -0.45 | Strong Decoupling |
| 2002-2003 | -0.04 | 0.03 | -1.35 | Strong Decoupling | 0.04 | 0.04 | 0.89 | Expansive Coupling |
| 2003-2004 | 0.02 | 0.08 | 0.28 | Weak Decoupling | 0.04 | 0.07 | 0.51 | Weak Decoupling |
| 2004-2005 | 0.00 | 0.02 | 0.17 | Weak Decoupling | 0.07 | 0.09 | 0.76 | Weak Decoupling |
| 2005-2006 | 0.01 | 0.05 | 0.19 | Weak Decoupling | 0.05 | 0.07 | 0.76 | Weak Decoupling |
| 2006-2007 | 0.03 | 0.06 | 0.57 | Weak Decoupling | 0.13 | 0.11 | 1.18 | Expansive Coupling |
| 2007-2008 | -0.03 | -0.02 | 1.54 | Recessive Decoupling | 0.18 | 0.05 | 3.82 | Expansive Negative Decoupling |
| 2008-2009 | -0.04 | -0.18 | 0.25 | Weak Negative Decoupling | -0.14 | -0.12 | 1.09 | Recessive Coupling |
| 2009-2010 | 0.02 | 0.04 | 0.49 | Weak Decoupling | -0.01 | 0.01 | -1.08 | Strong Decoupling |
| 2010-2011 | 0.00 | 0.06 | 0.05 | Weak Decoupling | 0.08 | 0.03 | 2.69 | Expansive Negative Decoupling |
| 2011-2012 | -0.05 | 0.04 | -1.35 | Strong Decoupling | 0.01 | -0.004 | -3.26 | Strong Negative Decoupling |
| 2012-2013 | -0.05 | 0.03 | -1.47 | Strong Decoupling | -0.05 | 0.01 | -9.87 | Strong Decoupling |
| 2013-2014 | -0.23 | 0.07 | -3.46 | Strong Decoupling | -0.01 | 0.05 | -0.28 | Strong Decoupling |
| 1995-2014 | -0.22 | 0.96 | -0.23 | Strong Decoupling | 0.41 | 1.23 | 0.33 | Weak Decoupling |
Table 5f: Tapio decoupling index in electricity and transports sectors: the top ten European issuers of GHG per GVA for the period 1995-2014.
| Decoupling Index Tapio - Electricity/Energy Industries | Decoupling Index Tapio - Transports Industry | |||||||
|---|---|---|---|---|---|---|---|---|
| RO - Romania | RO - Romania | |||||||
| Period | ΔGHG/GHG | ΔGVA/GVA | γ | State | ΔGHG/GHG | ΔGVA/GVA | γ | State |
| 1995-1996 | 0.04 | 0.11 | 0.37 | Weak Decoupling | 0.40 | 0.26 | 1.53 | Expansive Negative Decoupling |
| 1996-1997 | -0.11 | -0.06 | 1.90 | Recessive Decoupling | 0.02 | 0.01 | 3.32 | Expansive Negative Decoupling |
| 1997-1998 | -0.16 | -0.12 | 1.35 | Recessive Decoupling | -0.06 | 0.07 | -0.82 | Strong Decoupling |
| 1998-1999 | -0.16 | -0.04 | 3.92 | Recessive Decoupling | -0.17 | 0.00 | -38.69 | Strong Decoupling |
| 1999-2000 | 0.06 | 0.04 | 1.29 | Expansive Negative Decoupling | 0.04 | 0.04 | 0.85 | Expansive Coupling |
| 2000-2001 | 0.07 | 0.16 | 0.41 | Weak Decoupling | 0.20 | 0.00 | 78.90 | Expansive Negative Decoupling |
| 2001-2002 | -0.05 | 0.09 | -0.62 | Strong Decoupling | 0.03 | 0.04 | 0.74 | Weak Decoupling |
| 2002-2003 | 0.07 | -0.02 | -3.69 | Strong Negative Decoupling | 0.05 | 0.10 | 0.53 | Weak Decoupling |
| 2003-2004 | -0.10 | 0.17 | -0.62 | Strong Decoupling | 0.05 | 0.18 | 0.28 | Weak Decoupling |
| 2004-2005 | -0.01 | 0.06 | -0.19 | Strong Decoupling | -0.07 | 0.15 | -0.50 | Strong Decoupling |
| 2005-2006 | 0.05 | 0.15 | 0.31 | Weak Decoupling | 0.04 | 0.19 | 0.20 | Weak Decoupling |
| 2006-2007 | 0.01 | 0.06 | 0.12 | Weak Decoupling | 0.05 | 0.15 | 0.33 | Weak Decoupling |
| 2007-2008 | -0.05 | 0.11 | -0.44 | Strong Decoupling | 0.12 | 0.11 | 1.08 | Expansive Coupling |
| 2008-2009 | -0.16 | -0.01 | 10.91 | Recessive Decoupling | -0.01 | -0.09 | 0.17 | Weak Negative Decoupling |
| 2009-2010 | -0.08 | 0.27 | -0.32 | Strong Decoupling | -0.06 | -0.21 | 0.30 | Weak Negative Decoupling |
| 2010-2011 | 0.10 | 0.05 | 1.88 | Expansive Negative Decoupling | 0.01 | -0.13 | -0.08 | Strong Negative Decoupling |
| 2011-2012 | -0.08 | -0.08 | 1.07 | Recessive Coupling | 0.06 | 0.56 | 0.11 | Weak Decoupling |
| 2012-2013 | -0.22 | 0.02 | -12.31 | Strong Decoupling | -0.01 | -0.13 | 0.08 | Weak Negative Decoupling |
| 2013-2014 | -0.02 | 0.05 | -0.33 | Strong Decoupling | 0.04 | 0.06 | 0.55 | Weak Decoupling |
| 1995-2014 | -0.60 | 1.46 | -0.41 | Strong Decoupling | 0.83 | 2.07 | 0.40 | Weak Decoupling |
Table 5g: Tapio decoupling index in electricity and transports sectors: the top ten European issuers of GHG per GVA for the period 1995-2014 (continued).
The negative values in GHG growth verified during 2007-2008 and 2008-2009 is once more evidence of the economic and financial crisis where we have simultaneously a cut in GHG emissions but probably due to the economic recession verified also in Estonia, as well as in the rest of the countries. In general it is observed a non-stable decoupling state in any of the economic activity sectors but in 2000-2001 the growth rate of GHG was higher than that of GVA in transports indicating that its energy utilization efficiency was worse in that period. For the electricity sector this happened in 2002-2003, 2006-2007, 2009-2010 and 2012-2013, being more often in this sector the surpassing effect of emissions over economic growth.
When we compare all countries and sectors it is observed more states od strong decoupling in Estonia, Czech Republic, Iceland, Croatia, Finland and Romania. There are also some periods which we are able to distinguish when compared to others in terms of strong decoupling. For example during 1999-2000 in Estonia, Bulgaria, Croatia and Finland in the energy/electricity sector and in Estonia, Bulgaria and Finland in the transport sector.
This is the case of Estonia, Bulgaria, Czech Republic, Croatia and Slovenia in 2011-2012 in electricity, of Estonia, Bulgaria and Slovenia in transports during 2012-2013 and of Estonia, Bulgaria, Czech Republic, Croatia, Finland, Slovenia and Romania in electricity during 2013-2014.
Considering the entire analysis period, meaning changes observed during 1995 and 2014 we clearly see through the results that only in the electricity sector, except for Finland in transports, some countries in fact had strong decoupling. This is the case of Czech Republic, Iceland, Croatia, Finland, Slovenia and Romania. In most of the cases for the entire period we observe a state of weak decoupling meaning that gross value added grows but this is done at the expense of more emissions. The growth rate of emissions during the entire period has thus been higher than that of economic growth and both the energy/electricity and transport sectors are facing tremendous pressure to save energy and fulfill the goals of the Europe 2020 and the Paris agreement. In order to develop the low-carbon economy as desired, the European individual governments should implement active measures and corresponding policies to prevent the impact of economic growth in both energy consumption and emissions.
This is even more problematic in the transport sector provided that predictions pointed that traffic volume will grow following GDP growth Tapio [6]. There is a clear need for change and among this top ten issuers in Europe it was observed that in these 20 years the only country where we were able to observe indeed signs of governmental will for change was Finland. Moreover, our results using the Tapio [6] decomposition confirmed the findings of Tapio [6]. Thus, at least Finland, has changed its course from a socially and economically sustainable but ecological unsustainable development towards economically and ecologically sustainable development.
Conclusions
Using a sample of the top ten issuers of GHG per GVA during 1995 and 2014 in Europe, we applied decoupling methods and the Tapio [6] Index to observe the current situation for each of these countries and by considering two economic activity sectors separately, namely the energy/electricity sector and the transports sector.
Our results significantly reject the assumption that energy and emissions are neutral for growth. Notwithstanding, since the decoupling results, for energy consumption and for GHG emissions, are different for the ten countries, unified energy policies would not be the good recipe for the whole area. The economies under study are still called “energy dependent,” provided they still all rely of fossil fuel sources and are import dependent from this type of fuel. This still tremendous dependency from fossil fuels, despite the fact that in recent years a lot has been done in terms of renewable energy, and the financial crisis in the middle that has only delayed and impelled the effectiveness of policies pursued, it was possible to infer from our results that energy conservation policies and policies with respect to emissions reductions may be implemented with adverse effects on real GDP.
Therefore, energy conservation and emission reduction policies aiming at protecting the environment are expected to deteriorate the current stage of economic growth, especially in the transport sector. Notwithstanding, since the results are different for the ten countries, unified energy policies would not be the good recipe for the whole area. Even though there may be political will to construct the common goals and objectives, different policy design for subgroups of member states ought to probably be considered.
By examining the historical evolution of the decoupling analysis here performed this study shows that the energy/electricity economy grew faster than emissions in Czech Republic, Iceland, Croatia, Finland, Slovenia and Romania. It was observe in most and especially in the transport sector a persistency of the weak decoupling state meaning that only in Finland economic growth in transports surpassed the emissions growth because in all other economic growth is still done at the expense of more GHG emissions. Thus policy makers should be aware that policies being pursued are still far from the desired if the goal is to ensure sustainability for the economy. Many aspects are still needed to be considered as for example electricity cars spread out and more renewable energy sources. This would help reducing GHG emissions, would contribute to more technology and innovation investment, will reinforce the use of renewable sources in electricity production and could ensure the sustainability levels and people’s health in the future.
References
- Li F, Dong S, Li X, Liang Q, Yang W (2011) Energy consumption-Economic growth relationship and carbon dioxide emissions in China. Energy Policy 39: 568-574.
- Liobikienė G, Butkus M (2017) The European Union possibilities to achieve targets of Europe 2020 and Paris agreement climate policy. Renewable Energy 106: 298-309.
- Dai S, Zhang M, Huang W (2016) Decomposing the decoupling of CO2 emission from economic growth in BRICS countries. Natural Hazards 2: 1055-1073.
- Szigeti C, Toth G, Szaboca DR (2017) Decoupling - shifts in ecological footprint intensity of nations in the last decade. Ecological Indicators 72: 111-117.
- Naqvi A, Zwickl K (2017) Fifty shades of green: Revisiting decoupling by economic sectors and air pollutants. Ecological Economics 133: 111-126.
- Tapio P (2005) Towards a theory of decoupling: Degrees of decoupling in the EU and the case of road traffic in Finland between 1970 and 2001. Transport Policy 12: 137-151.
- Wan L, Wang ZL, Ng JCY (2016) Measurement Research on the Decoupling Effect of Industries’Carbon Emissions - Based on the Equipment Manufacturing Industry in China. Energies 921: 1-17.
- Magazzino C, Elliot C (2016) The relationship between real GDP, CO2 emissions, and energy use in the GCC countries: A time series approach. Cogent Economics & Finance 41: 1-20.

Open Access Journals
- Aquaculture & Veterinary Science
- Chemistry & Chemical Sciences
- Clinical Sciences
- Engineering
- General Science
- Genetics & Molecular Biology
- Health Care & Nursing
- Immunology & Microbiology
- Materials Science
- Mathematics & Physics
- Medical Sciences
- Neurology & Psychiatry
- Oncology & Cancer Science
- Pharmaceutical Sciences