Clinical Efficacy of Low Carbohydrate Diet (LCD) with Investigation of Lipid Metabolism
Hiroshi Bando1*, Koji EBe2, Tetsuo Muneta3, Masahiro Bando4 and Yoshikazu Yonei5
1Tokushima University/Medical Research, Tokushima, Japan
2Takao Hospital, Ukyo Ward, Umegahata Hatamachi, Kyoto, Japan
3Muneta Maternity Clinic, Chiba, Japan
4Department of Nutrition and Metabolism, Institute of Biomedical Sciences, Tokushima University Graduate School, Tokushima, Japan
5Anti Aging Medical Research Center, Graduate School of LiIe ard Medical Sciences, Doshisha University, Kyoto, Japan
Abstract
Carbohydrate and lipid metabolism were studied. Subjects were 121 patients with type 2 diabetes mellitus (T2DM), and provided Calorie restriction (CR) on day 1,2 and Low Carbohydrate Diet (LCD) from 3 to 14 days. Basal biomarkers, daily glucose profile on day 2, 4, and lipids including remnant-like particle cholesterol (RLP-C) were measured, subjects were classified into 4 groups due to average glucose with mean HbA1c 6.3%, 6.9%, 7.9%, 9.2%, respectively. Average glucose from day 2 to 4 in each group was significantly decreased. M value considerably decreased in group 2, 3, 4, indicating useful M value. Correlations were investigated among glucose, HbA1c, urinary C-Peptide and M value. As for lipids, Triglyceride from day 2 to 14 decreased considerably. RLP-C levels showed significant correlation with Triglyceride, LDL-C, atherogenic index (T-C – HDL / HDL) and TG/HDL value. These results would suggest that RLP-C may be involved in the development of arteriosclerosis of T2DM, and may have the role of further research direction in the future. In current study, our results would become the fundamental data for the further development of LCD therapy in various counties and districts, and suggest the research direction for patients with T2DM from the combined point of glucose and lipid metabolism in the future.
Keywords
Remnant-like particle cholesterol; Low carbohydrate diet; Morbus value; Type 2 diabetes mellitus; Lipid metabolism
Abbreviations
LCD: Low-Carbohydrate Diet; CR: Calorie Restriction; T2DM: Type 2 Diabetes Mellitus; RLP-C: Remnant-Like Particle Cholesterol; M value: Morbus value; IRI: Immuno-Reative Insulin; CPR: C-peptide Immunoreactivity; HOMA-R: Homeostasis Model Assessment- Insulin Resistance; HOMA-β: Homeostasis Model Assessment of β-Cell Function; HDL-C: High Density Lipoprotein Cholesterol; LDL-C: Low Density Lipoprotein Cholesterol
Introduction
The discussion concerning Calorie Restriction (CR) and low carbohydrate diet (LCD) has been continued for years. Several significant reports indicating predominance of LCD were published [1-6]. Consequently, LCD has been estimated to have clinical efficacy in nutritional therapy for the patients with type 2 diabetes mellitus (T2DM) and metabolic syndrome. Authors and colleagues have lots of experience of LCD for T2DM, and reported clinical studies [7-10]. Our recent study includes blood glucose variability in diabetic patients, using Morbus (M) value, which is one of the index of blood sugar level and mean amplitude of glycemic excursions (MAGE) [11-14].
On the other hand, lipid metabolism in metabolic syndrome has been also in discussion, and recent studies include remnant-like particle cholesterol (RLP-C) [15-18]. Combined these aspects, we investigated blood glucose variability for the M-value in diabetic patients, and lipid metabolism including RLP-C in this study.
Materials and Methods
The subjects were 121 patients with Type 2 diabetes mellitus (T2DM), which were 52 males and 69 females, with age groups ranging between 28-84 years old, 60.8 ± 11.0 (mean ± SD) years old in average, 63 years old in the median value. They were admitted for 14-15 days, and received endocrine and metabolic evaluation with lipid analysis.
Methods included a controlled diet for the patients. On day 1 and 2, Calorie Restriction (CR) diet was provided which had 60% carbohydrates, 25% lipids and 15% protein with 1400 kcal/ day. From day 3 to 14 days, Low Carbohydrate Diet (LCD) was provided, which had 12% carbohydrates, 64% lipids and 24% protein with 1400 kcal/day. This has been called super-LCD formula in our nutritional investigation for LCD [7,9,10,19].
The examination protocol was as follows: 1) basal biomarkers and daily profile of blood glucose on day 2, 2) daily profile of blood glucose on day 4, 3) several biomarkers such as triglyceride and uric acid on day 14.
Analysis method and M value
A daily profile of blood glucose was measured 7 times a day, and data were calculated for average glucose level and Morbus (M) value. According to the average glucose level, subjects were classified into 4 groups, namely, group 1,2,3,4.
Morbus (M) value has been proposed for analyzing blood glucose variability. It is a logarithmic transformation of the deviation of blood glucose from an arbitrary assigned “ideal” glucose value, with an expression of both the mean glucose value and the effect of glucose swings [11-14,20].
The formula of M value is as follows: M=MBS + MW, where MW=(maximum blood glucose − minimum glucose)/20; MBS=the mean of MBSBS; MBSBS=individual M-value for each blood glucose value calculated as (absolute value of [10 × log (blood glucose value/120)]) [3].
For the interpretation of M value, the standard range is <180, borderline is 180-320 and abnormal is >320. There were discussions concerning how many times of sampling per day is necessary. It was reported that multiple sampling and a 7-point glycemic trial per day would have yielded similar results [14,21].
Statistical analyses
In current study, data was represented as the mean ± standard deviation. For statistical analyses, correlation coefficients (Pearson) were calculated using the JMP (Version 8) statistical analysis software (JMP Japan Division of SAS Institute Japan Ltd., Minato-ku, Tokyo, Japan) and Microsoft Excel analytical tool.
Intergroup comparisons were made using the Wilcoxon rank sum test or the Bonferroni multiple comparison (Lambert method). A significance level of less than 5% obtained using a two-tailed test was considered to be statistically significant.
Ethical considerations
Current study was conducted in compliance with the ethical principles of the Declaration of Helsinki and Japan’s Act on the Protection of Personal Information along with the Ministerial Ordinance on Good Clinical Practice (GCP) for Drug (Ordinance of Ministry of Health and Welfare No. 28 of March 27, 1997).
No ethical committee meeting was held. Informed consent was obtained from the subjects concerning this questionnaire. The study was registered with UMIN #R000031211.
Results
Fundamental data
Summarized data of 121 subjects were shown in Table 1. They were categorized for 4 groups due to the average glucose level. The mean HbA1c in each group was 6.3%, 6.9%, 7.9%, 9.2%, respectively. Blood glucose level on day 4 was significantly decreased compared with those on day 2 in each group. Triglyceride level on day 14 was significantly decreased compared with those on day 2 in each group.
Table 1: Subjects classified for 4 groups due to average glucose level.
| Categorization | ||||
| group | Group 1 | Group 2 | Group 3 | Group 4 |
| Subjects | ||||
| number | 30 | 30 | 30 | 31 |
| sex (male/female) | 13/17 | 13/17 | 10/20 | 16/15 |
| age (y.o.) | 60(54-65) | 64(51-70) | 65(55-72) | 64(56-68) |
| average glucose (mg/dL) | 123 (115-128) | 161 (141-168) | 198 (184-212) | 259 (248-294) |
| Glucose (basal) | ||||
| HbA1c (%) | 6.3(5.9-7.1) | 6.9(6.3-7.4) | 72(7.4-9.1) | 22(8.5-10.2) |
| Fasting Glucose (mg/dL) | 111(102-135) | 132(118-141) | 170(151-205) | 210(186-235) |
| IRI (µU/mL) | 7.4(6.0-12) | 7.5(3.9-10.4) | 53(3.6-10.1) | 5.4(3.1-7.8) |
| HOMA-R | 2.4(1.3-4.0) | 2.4(1.2-3.8) | 2.1(1.3-4.3) | 23(1.5-4.2) |
| HOMA-$ | 60(30-85) | 41(24-58) | 21(11-40) | 11(7.7-17) |
| Glucose (M value related) | ||||
| average glucose on day 2 (mg/dL) | 123(115-128) | 161(150-179) | 198(184-212) | 259(248-294) |
| average glucose on day 4 (mg/dL) | 101(97-113) | 125(112-137) | 152(143-164) | 185(166-205) |
| M value on day 2 | 8.9(5.7 - 21.7) | 42.9(33.1 -52.0) | 120(96.8 - 151) | 325(269 - 509) |
| M value on day 4 | 8.5(4.2 - 14.8) | 5.4(3.2 - 9.5) | 14.8(7.6 - 28.1) | 60.1(32.8 -105) |
| Glucose (CPR excretion in urine) | ||||
| urinary CPR on day 2 (rng/day) | 67.3(27.3-105) | 56.5(36.5-86.8) | 59.4(38.5-66.2) | 74.0(50.5-89.7) |
| urinary CPR on day 4 (rng/day) | 56.0(34.1-73.0) | 40.8(25.5-52.1) | 43.3(33.8-83.4) | 64.0(51.0-73.0) |
| Lipid Metabolism | ||||
| Triglyceride on day 2 (mg/dL) | 113(71-143) | 94(67.5-157) | 96(73.5-125) | 114(70-175) |
| Triglyceride on day 14 (mg/dL) | 93(59-111) | 88(61.5-99) | 69(56-89) | 88(71-113) |
| HDL-C at day 2 (mg/dL) | 57(49-72) | 57(48-68) | 65(58.3-76) | 63(53-89) |
| HDL-C co day 14 (mg/dL) | 47.5(42-68) | 50(44-62) | 58(52-74) | 59(46-70) |
| LDL-C on day 2 (mg/dL) | 109(97-137) | 132(102-1551) | 126(104-158) | 145(103-171) |
| LDL-C on day 14 (mg/dL) | 120(110-141) | 138(115-175) | 137(113-160) | 155(114-180) |
| RLP-C on day 2 (mg/dL) | 4.4(3.3-6.7) | 4.1(3.0-7.5) | 4.8(4.0-6.0) | 4.7(4.0-6.4) |
The results were expressed by the data of median (25%- 75%).
Correlation for HbA1c, glucose and M value
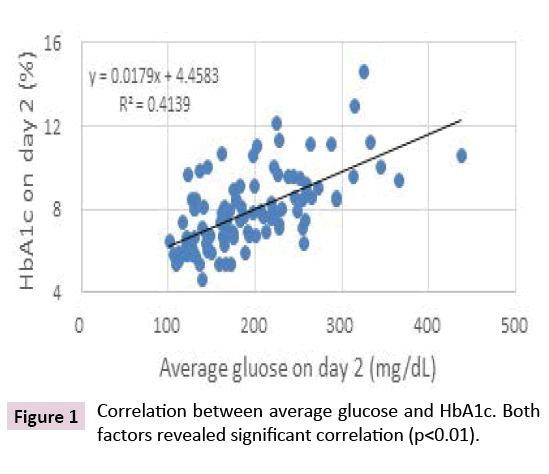
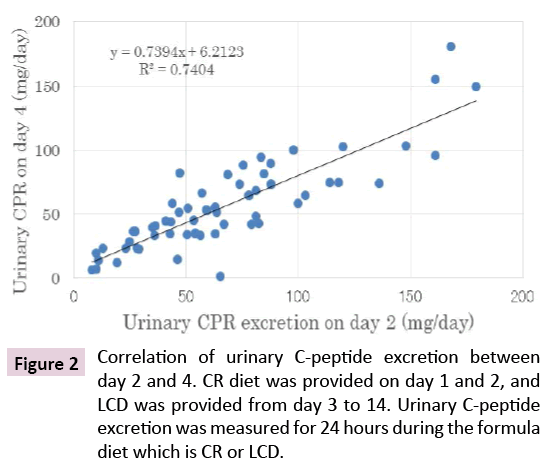
There were significant correlation between average glucose and HbA1c Figure 1, and for the urinary C-peptide excretion between day 2 and 4 (Figure 2).
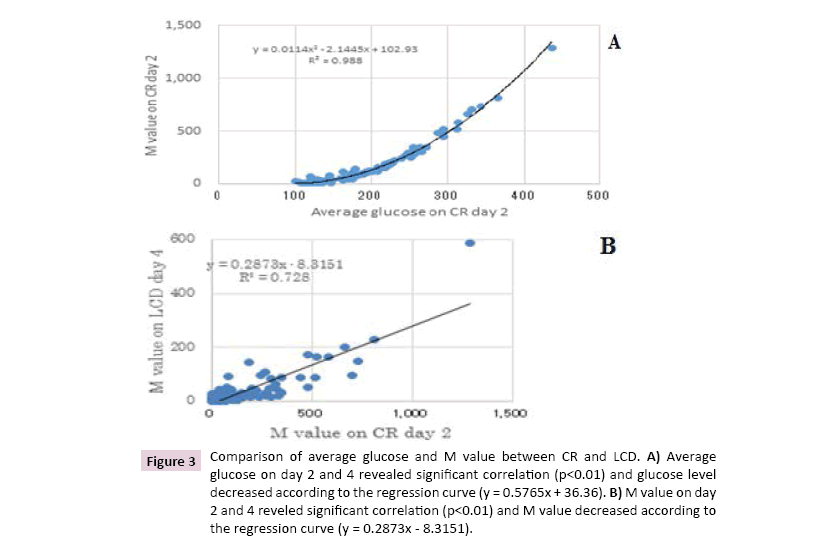
Average glucose on day 2 and 4 revealed significant correlation (p<0.01), and M value on day 2 and 4 revealed significant correlation (p<0.01) (Figure 3).
Figure 3: Comparison of average glucose and M value between CR and LCD. A) Average glucose on day 2 and 4 revealed significant correlation (p<0.01) and glucose level decreased according to the regression curve (y = 0.5765x + 36.36). B) M value on day 2 and 4 reveled significant correlation (p<0.01) and M value decreased according to the regression curve (y = 0.2873x - 8.3151).
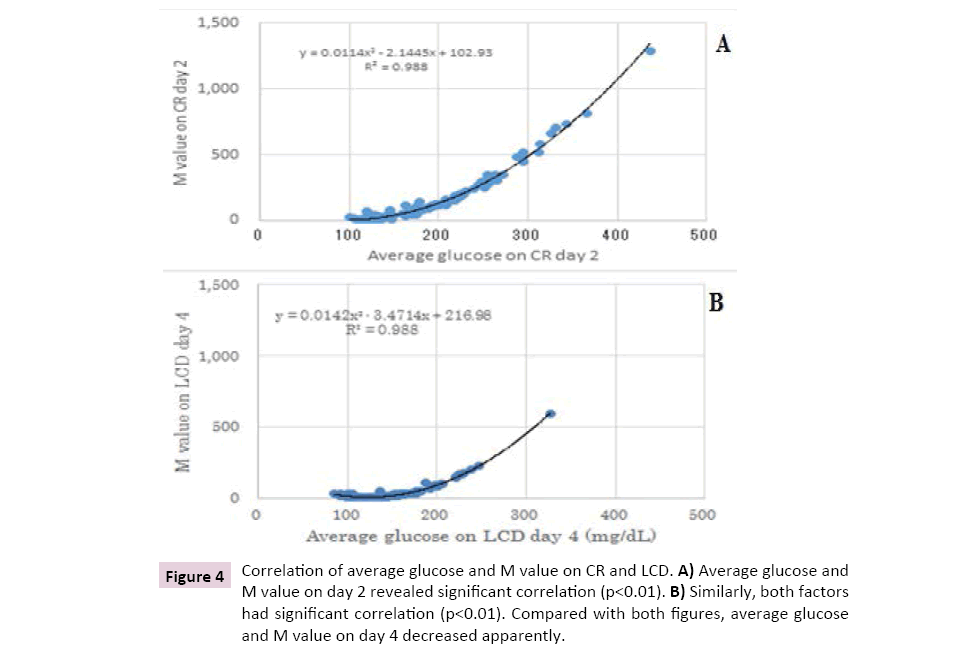
Average glucose and M value on day 2 and 4 showed significant correlation (p<0.01) (Figure 4).
Figure 4: Correlation of average glucose and M value on CR and LCD. A) Average glucose and M value on day 2 revealed significant correlation (p<0.01). B) Similarly, both factors had significant correlation (p<0.01). Compared with both figures, average glucose and M value on day 4 decreased apparently.
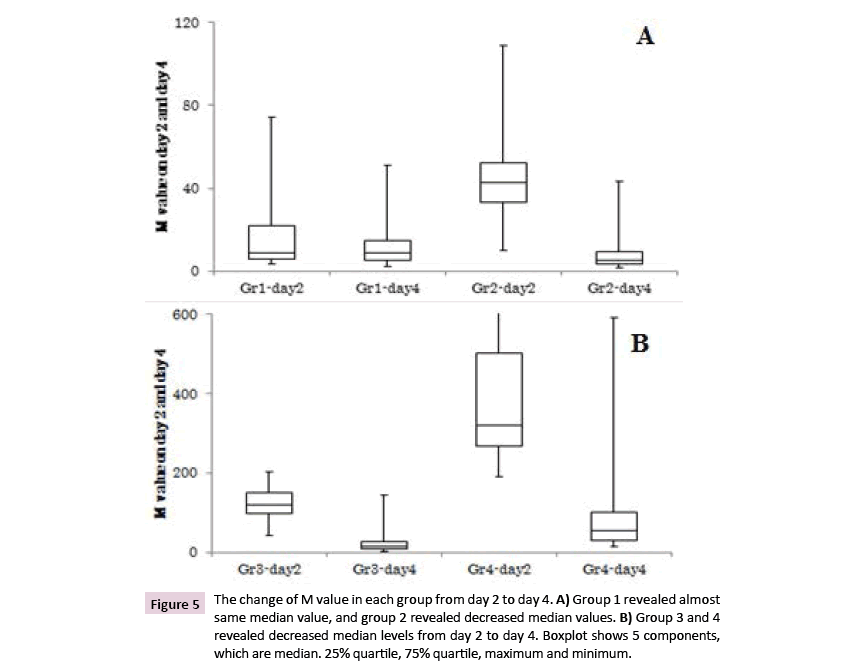
Compared with both figures, average glucose and M value on day 4 decreased apparently. The change of M value in each group from day 2 to day 4 were shown in (Figure 5).
Figure 5: The change of M value in each group from day 2 to day 4. A) Group 1 revealed almost same median value, and group 2 revealed decreased median values. B) Group 3 and 4 revealed decreased median levels from day 2 to day 4. Boxplot shows 5 components, which are median. 25% quartile, 75% quartile, maximum and minimum.
Analyses among lipid biomarkers
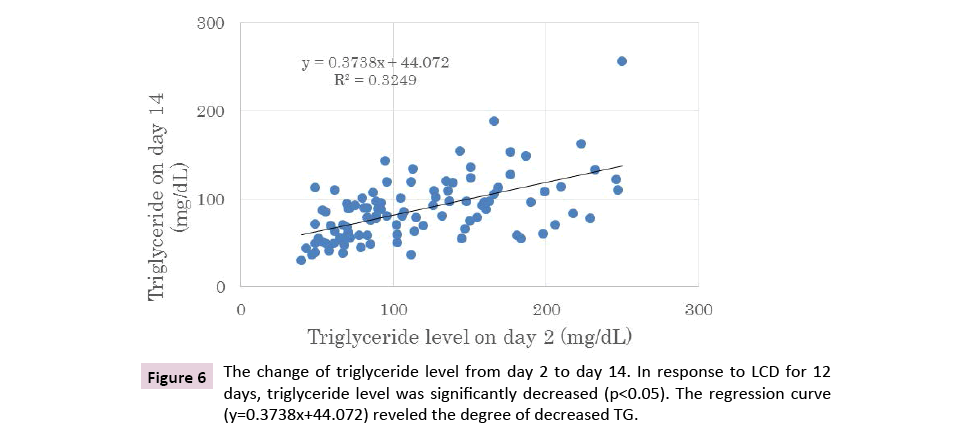
The change of TG levels from day 2 to day 14 were shown in Figure 6. In response to LCD for 12 days, Triglyceride level was significantly decreased (p<0.05). The regression curve (y=0.3738x + 44.072) reveled the degree of decreased TG.
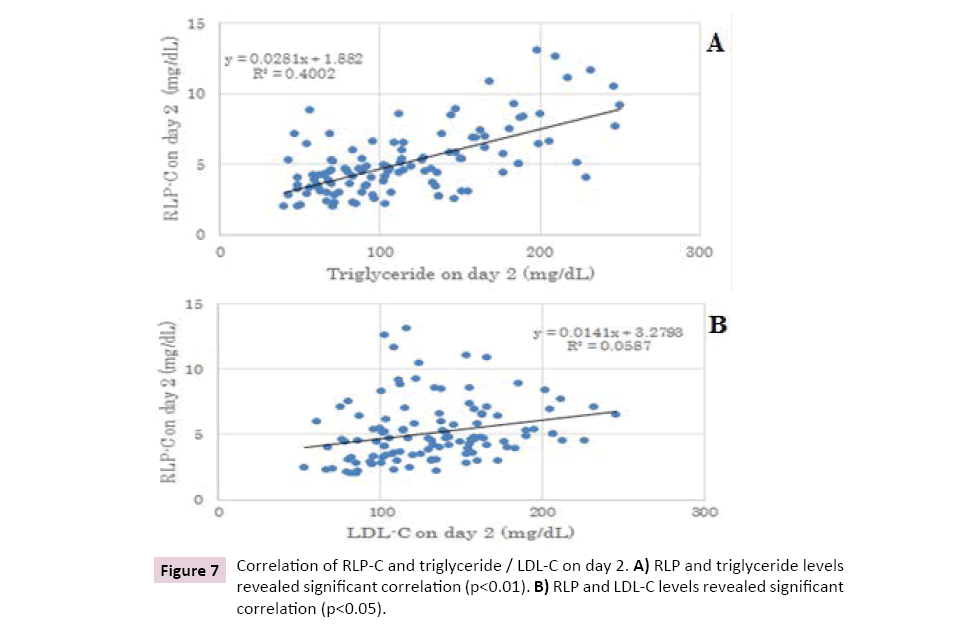
RLP-C levels showed significant correlation with Triglyceride on day 2 (p<0.01) and LDL-C on day 2(p<0.05) (Figure 7).
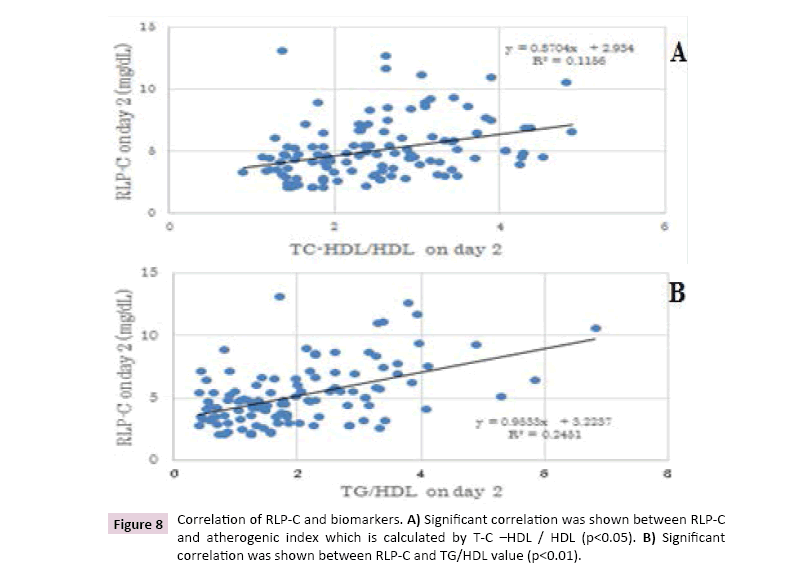
RLP-C showed significant correlation with atherogenic index (T-C–HDL/HDL) (p<0.05), and TG/HDL value (p<0.01) (Figure 8).
Discussion
In north American and European countries, LCD has been more prevalent as Bernstein, Atkins and others have continued clinical research for years [1-6,22-25]. In Japan, author and colleagues have developed LCD, and investigated studies for metabolic syndrome with 2699 cases, T2DM, elevated ketone bodies and glucose variability as M value [7-10,26].
In this study, we adopted super-LCD including 12% carbohydrate, which is equivalent to VLCKD. Our formula diet contains 1400 kcal/day, which has 168 kcal of carbohydrate (1400 kcal × 0.12), and 42 g of carbohydrate per day [7,9,19] which is one of the Very low-carbohydrate ketogenic diet (VLCKD) by the definitions of LCD [5].
Daily glucose profile can be estimated by MAGE and M (Morbus) values [11,12], and the latter would be more practical. There were similar results on 7 times or 20 times of sampling per day [11,13,21], showing similar result in comparison with continuous glucose monitoring (CGM) [27-30].
Average blood glucose in 4 groups decreased, indicating the short effect of LCD only for 2 days from CR to LCD. M value also significantly decreased in group 2,3 and 4. M value is characterized for its larger numerical change than that of glucose, and for better evaluation of relieving status. On contrast, M value in group 1 was not so changed from day 2 to 4, which seemed to be the characteristic point of M value. If the average blood glucose decrease from 100 mg/dl to 80 mg/dL, M value would increase because M value becomes minimum level when blood glucose is 100 mg/dL.
For only 2 days of formular LCD, there were considerable decrease of average glucose, urinary C-peptide excretion and M value. Obtained linear regression curve would become the reference data for this area of research. The decrease ratio of M value is larger than that of glucose, because M value represents both average glucose and MAGE.
Recently, the research of LCD have focused to less influence to cardiovascular risk factors, and research the relationship between glucose and lipids metabolism [31-33].
Isolation of remnant-like particles (RLPs) was isolated and investigated, which are thought to be atherogenic agent [15]. RLP-C was supposed to be an independent risk factor for CVD in women, and provides significantly more information than do triglycerides [16,34]. After that, Epidemiologic studies have shown associations between RLP concentrations and atherosclerosis, cardiovascular disease (CVD), and chronic heart disease (CHD) [17,35].
Elevated RLP-C were observed in T2DM [16,34,36]. Diabetes Atherosclerosis Intervention Study (DAIS) had measured RLP-C and TG levels, which were significantly higher in diabetic CAD group than non-diabetic CAD group [37]. Furthermore, The AUCs of TG or RLP-C showed a correlation with the AUCs of plasma insulin, with the correlation with the insulin resistance index [37,38].
In metabolic syndrome, obesity and insulin resistance, ratio of triglycerides to high-density lipoprotein cholesterol (TG/HDL-C) would be high [39]. By the data from 1.35 million US individuals, median TG/HDL-C ratio was 2.2, and increasing TG/HDL-C ratios would accompany increasing levels of RLP-C, non-HDL-C and LDL density, with the highest relative increase of RLP-C and LDL-C [39].
In our study, TG/HDL-C ratio was 1.73(1.08-2.85). As to current research protocol with lipid investigation, we enrolled the patients whose triglyceride was less than 250 mg/dL, because extremely high value of triglyceride would not be adequate for statistical analyses. For future study, we will analyze those patients in the combined research of glucose and lipid metabolism.
As to correlation of RLP-C with 4 biomarkers which are TG, LDL-C, TC-HDL/HDL and TG/HDL, the linear regression line and coefficient value could become the reference for the research of lipid metabolism.
Different dietary approaches on glycemic control has been in research, including 9 kinds of diet, namely, control, lowcarbohydrate, low-fat, Mediterranean, high-protein, vegetarian, DASH, Paleo, low-glycemic index/load [40-42]. Our current study would be useful for selecting applicable method. Furthermore, interrelationship research between glucose and lipid metabolism would develop for decreasing diabetic complication in the future.
Conclusion
• By LCD nutritional therapy, average glucose and M value had considerably decreased, suggesting the efficacy of LCD and the clinical useful marker of LCD for the patients with T2DM.
• Investigation of lipid metabolism showed considerable TG decrease for LCD and the significant relationship between RLP-C and triglyceride, LDL-C, TC-HDL/HDL, TG/HDL.
• Current study would become fundamental data for the field of T2DM, LCD and research direction for glucose/ lipid metabolism in the future.
Acknowledgement
The part of the content of this article was presented at the 90th Scientific Meeting of Japan Endocrine Society (JES) Annual Congress, Kyoto, April, 2017.
The authors would like to thank the patients and staffs for their cooperation and support.
Conflicts of Interest
The authors declare that they have no conflicts of interest.
References
- Accurso A, Bernstein RK, Dahlqvist A, Draznin B, Feinman RD, et al. (2008) Dietary carbohydrate restriction in type 2 diabetes mellitus and metabolic syndrome: time for a critical appraisal. Nutr Metab (Lond) 5: 9.
- Shai I, Schwarzfuchs D, Henkin Y, Shahar DR, Witkow S, et al. (2008) Weight loss with a low-carbohydrate, mediterranean, or low-fat diet. N Engl J Med 359: 229–241.
- Schwarzfuchs D, Golan R, Shai I (2012) Four-year follow-up after two-year dietary interventions. N Engl J Med 367: 1373-1374.
- Atallah R, Filion KB, Wakil SM Genest J, Joseph L, et al. (2014) Long-term effects of 4 popular diets on weight loss and cardiovascular risk factors: A systematic review of randomized controlled trials. Circ Cardiovasc Qual Outcomes 7: 815-827.
- Feinman RD, Pogozelski WK, Astrup A, Bernstein RK, Fine EJ, et al. (2015) Dietary carbohydrate restriction as the first approach in diabetes management: Critical review and evidence base. Nutrition 31: 1-13.
- Gow ML, Garnett SP, Baur LA, Lister NB (2016) The effectiveness of different diet strategies to reduce type 2 diabetes risk in youth. Nutrients 8: E486.
- Ebe K, Ebe Y, Yokota S, Matsumoto T, Hashimoto M, et al. (2004) Low carbohydrate diet (LCD) treated for three cases as diabetic diet therapy. Kyoto Medical Association Journal 51: 125-129.
- Bando H, Nakamura T (2008) Carbo-count therapy and low carbohydrate diet (LCD). J Therapy 90: 3105-3111.
- Bando H, Ebe K, Nakamura T, Bando M, Yonei Y (2016) Low carbohydrate diet (LCD): Long and short-term effects and hyperketonemia. Glycative Stress Research 3: 193-204.
- Bando H, Ebe K, Muneta T, Bando M, Yonei Y (2017) Effect of low carbohydrate diet on type 2 diabetic patients and usefulness of M-value. Diabetes Res Open J 3: 9-16.
- Schlichtkrull J, Munck O, Jersild M (1965) The M-value, an index of blood sugar control in diabetics. Acta Med Scand 177: 95–102.
- Service FJ, Molnar GD, Rosevear JW, Ackerman E, Gatewood LC, et al. (1970) Mean amplitude of glycemic excursions, a measure of diabetic instability. Diabetes 19: 644–655.
- Moberg E, Kollind M, Lins PE, Adamson U (1993) Estimation of blood-glucose variability in patients with insulin-dependent diabetes mellitus. Scand J Clin Lab Invest 53: 507–514.
- Siegelaar SE, Holleman F, Hoekstra JBL, Devries JH (2010) Glucose variability: Does It matter? Endocrine Rev 31: 171–182.
- Cohn JS, Marcoux C, Davignon J (1999) Detection, quantification, and characterization of potentially atherogenic triglyceride-rich remnant lipoproteins. Arterioscler Thromb Vasc Biol 19: 2474-2486.
- McNamara JR, Shah PK, Nakajima K, Cupples LA, Wilson PW, et al. (2001) Remnant-like particle (RLP) cholesterol is an independent cardiovascular disease risk factor in women: results from the Framingham Heart Study. Atherosclerosis 154: 229-236.
- Imke C, Rodriguez BL, Grove JS, McNamara JR, Waslien C, et al. (2005) Are remnant-like particles independent predictors of coronary heart disease incidence? The Honolulu Heart Study Arterioscler Thromb Vasc Biol 25: 1718-1722.
- Tsunoda F, Asztalos IB, Horvath KV, Steiner G, Schaefer EJ, et al. (2016) Fenofibrate, HDL, and cardiovascular disease in Type-2 diabetes: The DAIS trial. Atherosclerosis 247: 35-39.
- Bando H, Ebe K, Muneta T, Bando M, Yonei Y (2017) Clinical effect of low carbohydrate diet (LCD): Case report. Diabetes Case Rep 2: 124.
- Service FH (2013) Glucose variability. Diabetes 62: 1398-1404.
- Monnier L, Colette C (2011) Glycemic variability: Can we bridge the divide between controversies? Diabetes Care 34: 1058-1059.
- Bernstein RK (2011) Dr. Bernstein’s Diabetes solution: The complete guide to achieving normal blood sugars. Little, Brown US, New York.
- Atkins RC (2001) Dr Atkins’ new diet revolution. Harper-Collins, New York..
- Westman EC, Vernon MC (2008) Has carbohydrate-restriction been forgotten as a treatment for diabetes mellitus? A perspective on the ACCORD study design. Nutr Metab (Lond) 5: 10.
- Foster GD, Wyatt HR, Hill JO, Makris AP, Rosenbaum DL, et al. (2010) Weight and metabolic outcomes after 2 years on a low-carbohydrate versus low-fat diet: A randomized trial. Ann Intern Med 153: 147–157.
- Muneta T, Kawaguchi E, Nagai Y, Matsumoto M, Ebe K, et al. (2016) Ketone body elevation in placenta, umbilical cord, newborn and mother in normal delivery. Glycative Stress Research 3: 133-140.
- Rodbard D (2009) New and improved methods to characterize glycemic variability using continuous glucose monitoring. Diabetes Technol Ther 11: 551-565.
- Baghurst P (2011) Calculating the mean amplitude of glycemic excursion from continuous glucose monitoring data: An automated algorithm. Diabetes Technol Ther 13: 296-302.
- McDonnell CM, Donath SM, Vidmar SI, Werther GA, Cameron FJ (2005) A novel approach to continuous glucose analysis utilizing glycemic variation. Diabetes Technol Ther 7: 253–263.
- Molnar GD, Taylor WF, Ho MM (1972) Day-to-day variation of continuously monitored glycaemia: a further measure of diabetic instability. Diabetologia 8: 342–348.
- Hu T, Yao L, Reynolds K, Whelton PK, Niu T, et al. (2015) The effects of a low-carbohydrate diet vs. a low-fat diet on novel cardiovascular risk factors: A randomized controlled trial. Nutrients 7: 7978-7994.
- Chen JH, Ouyang C, Ding Q, Song J, Cao W, et al. (2015) A moderate low-carbohydrate low-calorie diet improves lipid profile, insulin sensitivity and adiponectin expression in rats. Nutrients 7: 4724–4738.
- Mansoor N, Vinknes KJ, Veierod MB, Retterstol K (2016) Effects of low-carbohydrate diets vs. low-fat diets on body weight and cardiovascular risk factors: A meta-analysis of randomised controlled trials. Br J Nutr 115: 466-479.
- Schaefer EJ, McNamara JR, Shah PK, Nakajima K, Cupples LA, et al. (2002) Elevated remnant-like particle cholesterol and triglyceride levels in diabetic men and women in the Framingham offspring study. Diabetes Care 25: 989-994.
- Hamano M, Saito M, Eto M, Nishimatsu S, Suda H, et al. (2004) Serum amyloid A, C-reactive protein and remnant-like lipoprotein particle cholesterol in type 2 diabetic patients with coronary heart disease. Ann Clin Biochem 41: 125–129.
- Yoshida H, Hirowatari Y, Kurosawa H, Manita D, Yanai H, et al. (2012) Estimation of lipoprotein profile in patients with type II diabetes and its relevance to remnant lipoprotein cholesterol levels. Atherosclerosis 222: 541-544.
- Nakamura A, Monma Y, Kajitani S, Noda K, Nakajima S, et al. (2016) Effect of glycemic state on postprandial hyperlipidemia and hyperinsulinemia in patients with coronary artery disease. Heart Vessels 31: 1446–1455.
- Nguyen SV, Nakamura T, Uematsu M, Fujioka D, Watanabe K, et al. (2017) Remnant lipoproteinemia predicts cardiovascular events in patients with type 2 diabetes and chronic kidney disease. J Cardiol 69: 529-535.
- Quispe R, Manalac RJ, Faridi KF, Blaha MJ, Toth PP, et al. (2015) Relationship of the triglyceride to high-density lipoprotein cholesterol (TG/HDL-C) ratio to the remainder of the lipid profile: The Very Large Database of Lipids-4 (VLDL-4) study. Atherosclerosis 242: 243-250.
- Evert AB, Boucher JL, Cypress M, Dunbar SA, Franz MJ, et al. (2013) Nutrition therapy recommendations for the management of adults with diabetes. Diabetes Care 36: 3821-3842.
- Garvey WT, Mechanick JI, Brett EM, Garber AJ, Hurley DL, et al. (2016) Reviewers of the AACE/ACE Obesity Clinical Practice Guidelines: American association of clinical endocrinologists and American college of endocrinology comprehensive clinical practice guidelines for medical care of patient with obesity. Endocr Pract 22: 1-203.
- Schwingshackl L, Chaimani A, Hoffmann G, Schwedhelm C, Boeing H (2017) Impact of different dietary approaches on glycemic control and cardiovascular risk factors in patients with type 2 diabetes: A protocol for a systematic review and network meta-analysis. Syst Rev 6: 57.
Open Access Journals
- Aquaculture & Veterinary Science
- Chemistry & Chemical Sciences
- Clinical Sciences
- Engineering
- General Science
- Genetics & Molecular Biology
- Health Care & Nursing
- Immunology & Microbiology
- Materials Science
- Mathematics & Physics
- Medical Sciences
- Neurology & Psychiatry
- Oncology & Cancer Science
- Pharmaceutical Sciences
