Biological Treatment of Wastewater by Addition of Activated Carbon Powder (CAP)
Fares R1*, Aissa A2,Bouadi A3 and Lounis M1
1LAAR, University of Science and Technology-Mohamed Boudiaf, Algeria
2Laboratory of Quantum Physics of Matter and Mathematical Modeling (LPQ3M), Mustapha Stambouli University of Mascara, Algeria
3University Center Ahmed Zabana Relizane, Algeria
- *Corresponding Author:
- Redouane F
LAAR, University of Science and Technology- Mohamed Boudiaf, Algeria
Tel: +88-071-74910-20
E-mail: fares-redouane@hotmail.com
Received Date: January 08, 2018; Accepted Date: January 16, 2018; Published Date: January 23, 2018
Citation: Fares R, Aissa A, Bouadi A, Lounis M (2018) Biological Treatment of Wastewater by Addition of Activated Carbon Powder (CAP). J Waste Recycl Vol.3 No.1:2
Abstract
The units in the Arzew industrial area discharge significant quantities of liquid (industrial) discharges containing solvents, heavy metals, suspended solids and other organic loads that are discharged into the sewerage system and/or the receiving environment without adequate treatment. The use of powdered activated carbon (CAP) makes it possible to considerably reduce the concentrations of organic pollutants contained in the effluents by its optimum adsorption capacity. The aim of this investigation is to study the kinetics of adsorption of CAP, the adsorption capacity, the fixation of organic solvents on a micro porous medium, to look for the optimal concentrations of CAP to be introduced into the biological reactors in order to adsorb and minimize the levels of organic solvents miscible in liquid discharges and to reduce pollution parameters, including total SM (Suspended Matte), COD, BOD5, hydrocarbon. Our results showed us that CAP activated carbon powder has a better efficiency to reduce the pollutant loads in liquid discharges. In conclusion, CODs of 2800 mg/l for concentrations of 300 mg/l in furfural and MEC-toluene may be reduced to 70-fold with added 20 to 50 mg of CAP, which reflects the importance of use of activated carbon in the treatment of industrial liquid discharges, including STEP treatment plants of petroleum refining units.
Keywords
Biological filtration; Activated carbon powder; Industrial wastewater
Introduction
The petrochemical complex was built in 1970 east of Oran Algeria. Due to its strategic geographical position, its existing port infrastructure is further accentuated by the important urbanindustrial development of the establishment of the petrochemical complex which was initially conceived as a factor of the spatial planning policy and unfortunately did not guaranteeing the socio-economic development in a harmonious way, the city of Arzew is characterized by a problem specific to the presence of the petrochemical complex which gives it an industrial function [1]. The Arzew Petrochemical Complex is one of the three largest industrial centers in the country.
This industrial zone covers a total area of 961.69 ha (Figure 1) and allows the establishment of 15 production units and 17 service units:

Figure 1: Industrial area of Arzew.
• Petroleum such as: Naftec, Refinery, RTO, NAFTAL/AVM
• Gas as: GNL1, GNL2, GNL4, ENGI, Hélios, GP1Z, GP2Z, NAFTAL
• Chemical: Fertial-Groupe, Asmidal, Methanol, Fertalge
• Service units such as: Sonelgaz, Kahrama, GTP, EMB, SOMIZ, SOTRAZ.
The characteristics of the wastewater discharged from the production units are directly related to the industrial types, the pollution of these waters is of organic, mineral and toxic origins. Their release into the natural environment is often associated with disorders at the cellular level and/or physiological level in organisms, and the disruption of habitats caused irreversible changes in community structure. Like all living beings, fauna and flora are exposed to the toxic effects of pollutants released into the wild [2].
The table below summarizes the different physicochemical parameters and their average concentrations of wastewater from the production units before their treatments (Figure 2).

Figure 2: Schematization of the activated carbon structure (SLASLI, 2002).
The main objective of this study is to find a solution for the purification of effluents generated by:
▪ Removal of contaminating nuisances from the receiving environment,
▪ Elimination of organic solvents by biological treatment by adding CAP.
▪ Reuse and recovery of treated water.
Materials and Methods
Activated carbon is part of a range of substances with a very high porosity and a significant surface area of the order of 500 to 1500 m2 per gram of coal. These qualities give the activated carbon a high adsorption capacity. This physico-chemical process is used in drinking water systems to fix substances that cannot be eliminated by conventional treatment. The selected compounds are the adsorbates and the carbon adsorbent (Table 1).
Table 1 Main physico-chemical characteristics of industrial wastewater discharged at the Arzew golf course (Fares 2017).
| Parameter | Norms | Range of results | |
|---|---|---|---|
| MIN | MAX | ||
| Temperature (°C) | 30 | 12 | 21 |
| pH | 6.5-8.5 | 6.8 | 8.29 |
| Dissolved Oxygen (mg/L) | - | 4.3 | 10.5 |
| Conductivity (μS/cm) | 3000 | 34933.33 | 38433.33 |
| Suspended Matter SM (mg/L) | 35 | 294 | 3062 |
| Chemical Oxygen Demand COD (mg/L) | 120 | 460.8 | 4944 |
| Biochemical Oxygen Demand BOD5 (mg/L) | 40 | 207.57 | 2001.62 |
| Total Hydrocarbons (HCT)(mg/L) | 10 | 9.2 | 11.3 |
| Organic Matter (mg/L) | - | 15.83 | 71 |
| Total Phosphorus (mg/L) | 2 | 0.15 | 3.46 |
| Nitrogen Kjeldahl Total (NTK)(mg/L) | 30 | 16 | 21.4 |
| Nitrate (mg/L) | 50 | 1.66 | 2.66 |
| Nitrite (mg/L) | - | 0.02 | 0.05 |
| Ammonium (mg/L) | - | 0.21 | 4.54 |
| Lead | 1(mg/l) | 0.003µg/L | 0.24µg/L |
| Zinc | 5(mg/l) | 0.66µg/L | |
| Cadmium | 0.2(mg/l) | 0.14µg/L | 8.58µg/L |
| Iron (mg/L) | 1 | 0.056 | 0.28 |
| Chrome (mg/L) | 0.1 | 0.005 | 0.024 |
| Nickel (mg/L) | 5 | 0.019 | 0.033 |
The measurements were made using a multi-parameter instrument. It contains pH and temperature sensors. So that it is between 6 and 8.
Active carbon structure
The texture of activated carbon is close to that of graphite. It is in the form of a stack of plane layers of carbon atoms arranged in regular hexagons. This structure defines pores inside the coal particle. DUBININ classified, in Table 2 below, the pores in three different categories. The specific surface is the essential characteristic to allow the adsorption of solutes. As a result, the macro porous has no role in the process. The micro pores representing up to 95% of the total surface of the coal, are the places of adsorption. The size of the bacteria does not allow them to penetrate inside the coal. It develops on the surface and forms a bio-film [3]. The manufacturing processes create functional groups on the surface of the activated carbon. There are acidic functions such as RCOOH and ROH where R is an aromatic ring of benzene type. The nature of basic groupings is little known.
Table 2 Classification and pore characteristics (Borislav [3]).
| Ray | Macropore | Mesopore | Microspore |
|---|---|---|---|
| Ray (nm) | 50-100 | 1,8-50 | <1,8 |
| Volume (ml/g) | 0,2-0,8 | 0,02-0,1 | 0,15-0,5 |
| Area Mass (m2/g) | 0,5-2 | 25-75 | 95% total Area |
These functional surface groups define the hydrophilic character and the electro-kinetic potential of the activated carbon. They allow the fixation of polar molecules.
It is a transfer of a liquid phase containing the adsorbate to a solid phase with retention of solutes on the surface of the activated carbon called adsorbent. This process involves several steps.
The adsorption phenomenon of these four steps is represented in the following Figure 3.

Figure 3: Steps of transfer of a solute during its adsorption (Howard [18]).
Mathematical Modeling
It is a balance between the adsorbate molecules fixed and those remained free in the liquid phase. The isotherm describes the relationship existing at equilibrium for a given temperature, between the concentration of the adsorbate in the liquid phase (Ce) and that adsorbed on the surface of the adsorbent (Qe). Several authors have developed mathematical formulations.
The model described in 1926 gives the following equation:
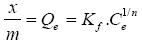 (1)
(1)
The model described gives the following equation:
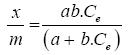 (2)
(2)
With x: amount of adsorbate,
m: Adsorbent mass,
Qe: Amount of solute adsorbed per unit mass of coal at equilibrium,
Ce: Adsorbate concentration in the liquid phase at equilibrium,
a, b: Empirical constants.
Powdered activated carbon CAP is a powdery reagent with a very fine particle size of 10 to 50 μm. Its density varies according to the fluidization and settlement of the material. The range of values is in the order of 200-600 kg/m3 [4]. When suspended, acidification by CO2 injection compensates for alkalinity. All equipment must have an anti-abrasion coating.
His place is at the top of the die, at the level of the decanter. It is recommended to fight against temporary or accidental pollution spikes, pesticides, solvents or various toxic (Figure 4).

Figure 4: Change in COD as a function of contact time (Dose CAP=120 mg/l, T=25°C; agitation speed=100 rpm).
The powdered activated carbon is trapped in the floc and eliminated with the hydroxide sludge, where its concentration reaches 1000 to 1500 g/m3 [4].
Powdered activated carbon is 2 to 3 times cheaper than GAC (Granular Activated Carbon) [5]. Its overdose is possible and its kinetics of adsorption is very fast. On the other hand, it is lost with sludge, the detection of pollution peaks and problematic of its applicable concentration is limited to 80 mg/l [6].
The addition of CAP in biological treatment has resulted in several process advantages such as:
System stability during shock load, Reduction of refractory pollutants, Abatement of ammonia and color and improved settling.
The dosage of powdered activated carbon and mixed liquors, CAP, MES in concentrations are associated with the sludge age according to the formula [7].
 (3)
(3)
With:
Xp: Equilibrium of the CAP-MES content
Xi: CAP dosage
θc: Full time of stay
θ: Hydraulic residence time.
The typical range of dosage of activated carbon powder is 20 to 200 mg/l. With a high sludge age, the reduction of organic matter per unit of coal is enhanced, thereby improving process efficiency (Figure 5).

Figure 5: Plot of Freundlich isotherm.
The reasons cited for this phenomenon include Tsai, et al. [8] explained that the abatement of contaminants in the BAC process (Biological Activated Carbon) was a combination of two phenomena biodegradation and adsorption.
The activated charcoal used in this study is activated charcoal powder; it was boiled and washed several times with distilled water and then dried at 105°C, and stored in desiccators before use.
The organic seed is taken from the water of the STEP and the effluents from the kitchen.
The experiments were applied to liquid discharges loaded with organic and polluting materials and were collected upstream of the two refinery treatment plants (before treatment). This experiment should determine the adsorption of CAP on organic pollutants such as oil fractions, hydrocarbons, feedstock solvents. The experiment was conducted at a temperature of 25°C, using a series of 500 ml flasks [9]. The flasks are stirred by a rotational mixing device of 100 rpm.
Absorbance is measured on the basis of COD after determining the equilibrium time, the time required for the adsorption process to reach equilibrium (Table 3).
Table 3 The four adsorption steps (Dominic et al.).
| Step1 | Transfer of the particle from the outer moisture layer internally | Veryfast |
|---|---|---|
| Step2 | Displacement of bound water up to the coal contact | fast |
| Step3 | Diffusion inside the coal under the influence of the concentration gradient | slow |
| Step4 | Adsorption in a micro-pore | Very slow |
The determination of the equilibrium time will allow setting the minimum time necessary for the contact of the activated carbon with the waste water in order to have the maximum abatement by adsorption of the existing pollutants in this water.
The experiment was carried out with the collection of 300 ml of waste water (U1800) in a beaker by adding 120 mg of activated charcoal with the application of a continuous agitation, and then CODs are determined in time (Figure 6).

Figure 6: Variation of COD in the presence and absence of nutrients.
In this experiment (Adsorption isotherm test) we took a volume of waste water sample taken at the outlet of the de-oiler of the STEP equal to 250 ml with application of the variable dosages of activated carbon powder under the following conditions:
➢ Constant temperature equal to 25°C
➢ Constant agitation
➢ Residence time equal to 2 hours.
At the end of each manipulation, the COD is determined, whose initial COD is equal to 628.8 mg/l.
The results of each manipulation are reported in Table 4 which follows:
Table 4 Results and calculations of the adsorption isotherm test.
| CAP(m) | Initial DCO (Co) | DCO of equilibrate (Ce) | ΔDCO(x) | q=x/m | Ce/q |
|---|---|---|---|---|---|
| mg/L | mg/L | mg/L | mg/L | mg/g | g/L |
| 50 | 628,5 | 404,60 | 223,90 | 4478,00 | 0,09 |
| 80 | 628,5 | 385,56 | 242,94 | 3036,75 | 0,13 |
| 120 | 628,5 | 357,00 | 271,50 | 2262,50 | 0,16 |
| 160 | 628,5 | 338,00 | 290,50 | 1815,63 | 0,19 |
| 200 | 628,5 | 342,72 | 285,78 | 1428,90 | 0,24 |
| 240 | 628,5 | 332,24 | 276,26 | 1234,41 | 0,27 |
| 300 | 628,5 | 304,64 | 323,86 | 1079,53 | 0,28 |
| 600 | 628,5 | 288,99 | 339,51 | 565,85 | 0,51 |
In this part simulations of the planned biological reactor of the future effluent treatment station of the P1 production department were made.
The pilot reactor comprises a beaker with a useful volume equal to 01 liter equipped with an air diffuser. All placed on a magnetic hot plate.
Aeration is provided by an air diffuser supplied either by instrumentation air or by a reserve air pump.
The stirring of the reactor is provided by the magnetic hot plate using a magnetic bar. The pH is continuously monitored by a pH meter.
Corrections are made by injection of solutions of soda and sulfuric acid, the operating mode of the pilot reactor is described in the following table (Table 5).
Table 5 Mode of operation of the reactor.
| Steps | Duration | %oftheCycle | Note |
|---|---|---|---|
| Aliment during anoxia | 1,00h | 12,50 | Addition 100 ml of Waste water |
| Aliment during the aerated period | 1,00h | 12,50 | Addition 100 ml of Waste water |
| Reaction | 3,50h | 43,75 | Volume equal to 1 liter in the reactor |
| decanting | 1,00h | 12,50 | Volume equal to 1 liter in the reactor |
| Extraction of treated water | 0,75h | 09,37 | Extraction of 200 ml treated water |
| Extraction of mud in excess | 0,75h | 09,37 | Volume equal to 0.8 liters in the reactor |
| Total | 8,00h | 99,99 | - |
• The raw feed water (EBA) of the reactor is taken from the STEP.
• The activated sludge injected at a concentration of 4 g/l into the pilot reactor comes from an independent sludgeculture reactor from seeds taken in advance from the STEP and the kitchen wastewater pit.
• Injection of variable doses of solvents.
To test the effectiveness of CAP, and to reduce COD below the standard of industrial releases, we injected varying doses of organic solvents. The following Table 6 summarize the operating results of the biological reactor.
Table 6 Results of reactor behavior tests with variable loads.
| Solution de lait à 0,5‰ + 20 mg CAP + furfural + MEC/Toluène | DCO initial (mg/l) | DCO final (mg/l) | Yield (%) | |
|---|---|---|---|---|
| Furfural (ppm) | MEC/Toluene (ppm) | |||
| 0 | 0 | 692,16 | 62,40 | 90,98 |
| 10 | 10 | 716,80 | 67,20 | 90,62 |
| 50 | 50 | 842,24 | 40,32 | 95,21 |
| 100 | 100 | 1030,40 | 62,72 | 93,91 |
| 300 | 300 | 2083,20 | 40,32 | 98,06 |
| 400 | 400 | 2438,06 | 93,36 | 94,11 |
| 500 | 500 | 2553,80 | 143,36 | 94,11 |
| 600 | 600 | 2672,30 | 197,12 | 92,62 |
| 750 | 750 | 2948,00 | 246,40 | 91,64 |
| 1000 | 1000 | 3960,00 | 448,80 | 88,66 |
• EBA: milk solution with a concentration of 0.5 ‰.
• A concentration of CAP equal to 20 mg/l.
• Variable concentrations in furfural and MEC-Toluene. Treatment without added nutrients.
In order to have the natural biodegradation of the effluent [10] wastewater from the production units, the following tests were carried out, where 01 liter of effluent was taken with application of prolonged aeration.
DCO analyzes will be determined according to the residence time.
The results of the tests are reported in Table 7.
Table 7 Results of COD analyzes as a function of time of natural biodegradation.
| Temps de contact (h) | 0 | 18 | 36 | 118 | 142 | 166 |
|---|---|---|---|---|---|---|
| DCO(mg/l) | 939,40 | 693,10 | 583,00 | 259,90 | 218,90 | 173,28 |
| Yield(%) | 0 | 26,21 | 37,93 | 72,33 | 76,69 | 81,55 |
Treatment with nutrient addition
Nutrient: (5% (COD) nitrogen in the form of urea ((NH2)2CO) and 1% (COD) phosphate in the form of sodium hydrogen phosphate (NaHPO4)
The results of the tests are reported in Table 8.
Table 8 Results of COD Tests as a Function of Time (T=25°C, Aeration).
| Temps de contact (h) | 0 | 6 | 20 | 44 | 52 | 68 |
|---|---|---|---|---|---|---|
| DCO(mg/l) | 971,28 | 688,56 | 319,2 | 196,08 | 186,96 | 177,84 |
| Rendement(%) | 0 | 29,10 | 67,13 | 79,81 | 80,75 | 81,69 |
Results and Discussions
The graphical representation shows the evolution of the COD as a function of the contact time.
There is a decrease in the concentration of the rapid COD during the first hours due to the adsorption phenomenon and a stabilization of the COD after two hours following the saturation of the active carbon [11] pollutants. The equilibrium time is equal to two (02) hours.
Using the model described given by eqn. (1)
Or Kf =4,72 et 1/n = 6,109; so n=0,163
It is a type I adsorption isotherm
We note in Table 7 that the kinetics of disappearance of the substrate (COD) is too low compared to Table 8 where the rate of degradation of the pollutants is fast following the presence of the nutrient with proportions C/N/P (carbon/nitrogen/phosphorus) respective 100/5/1 which ensures the normal growth of biomass in the biological reactor and allows for a better biodegradability of organic pollution.
The following Figure 7 shows the comparison of the degradation of organic pollutants with and without presence of the nutrient in the biological treatment.

Figure 7: Plot of the COD in the presence of nutrients and as a function of the concentration of CAP coal in the RBS.
The operating results of the biological reactor in the absence and in the presence of nutrient and activated carbon powder (CAP) at different concentrations.
The following table groups the results of analyzes of the COD of the feed water and the water after treatment as well as their purification yields.
The wastewater treatment [12-16] efficiency increases with a percentage of 79.54% in the presence of a nutrient that promotes the abatement of carbon pollution by assimilation and proliferation of the bacterial population.
The presence of powdered activated carbon improves the purification efficiency thanks to the adsorption phenomenon, which increases with increasing concentration of activated carbon (CAP).
A concentration of 50 mg/l of activated carbon powder makes it possible to achieve pollution abatement (COD) below the standard of rejection equal to 100 mg/l (Figure 8).

Figure 8: Plot of the final COD, initial and yield depending on the varying concentration of furfural and MEC-toluene.
The presence of activated carbon powder improves the purification efficiency by the adsorption effect, a concentration which varies between 50 and 100 mg/l of CAP is sufficient to reach the rejection standard (Table 9).
Table 9 Initial and final COD of the effluents in the RBS reactor and purification efficiencies.
| Dosage | DCO initial (mg/l) | DCO final (mg/l) | Rendement (%) |
|---|---|---|---|
| EBA | 829,40 | 238,30 | 71,26 |
| EBA+NUTRIMENTS | 807 | 165,10 | 79,54 |
| EBA+NUTRIMENTS+20mgCAP | 807 | 131,40 | 83,71 |
| EBA+NUTRIMENTS+50mgCAP | 807 | 99,36 | 87,68 |
| EBA+NUTRIMENTS+100mgCAP | 807 | 77,76 | 90,36 |
| EBA+NUTRIMENTS+200mgCAP | 682,56 | 25,92 | 96,20 |
It is noted that the COD of the effluent at the outlet of the RBS reactor remains below the discharge standard of 100 mg/l up to a concentration of the affluent rich in furfural content and the upper MEC-toluene at 400 mg/l, from this concentration the rejection norm is exceeded as the high concentration of the tributary [17-19] and the effect of the inhibition of biomass.
Conclusion
The activated carbon powder CAP used in this study showed its adsorption capacity of oils, solvents and hydrocarbons which subsequently decreases the levels of the COD effluents.
The equilibrium time of the reaction required for the adsorption process reaches two (02) hours. While the addition of nutrients based on nitrogen and phosphorus with percentages of COD/N/P respective to 100/5/1 obviously improves the rate of growth of biomass and pollution abatement organic.
The addition of CAP activated carbon powder with doses of approximately 50 mg/l in the sequential RBS biological reactor makes it possible to reduce the levels of COD below the standard of discharges in force. The behavior of PAC activated carbon powder can adsorb traces of miscible organic solvents in the waste at high levels of about 400 mg/l.
Finally, this study will be able to be responsible for the WWTPs of the industrial sites, in particular the oil refining units in order to identify the problem of the pollution of the receiving environments such as Wadis, the sea against the contamination and to preserve the water tables against any probable pollution.
References
- Fares R, Louns M (2017) Determination of the Sea Waters Quality of Arzew-Algeria Gulf. J PollutEffCont 5: 188.
- Fares R, Louns M (2016) Pollution characterization of liquid wastes of the factory complex fertial (Arzew, Algeria). J Air Wast Manage Assoc 66: 260-266.
- Borislav DZ (2007) Pore classification in the characterization of porous materials: A perspective, Central European. J Chemistry 5: 385-395.
- Villegas LGC, Mashhadi N, Chen M (2016) Curr Pollution Rep 2: 157.
- Hamamou F (2013) Study of the retention of Eu3+and Rose Bengal by activated carbon", Master thesis, DrMoulayTahar University of Saida.
- Choubert JM (2002) Analysis and optimization of the treatment ofTechnology & Engineering.
- Pirbazari M, Ravindran V, Badriyha BN, Kim SH (1996) Hybrid membrane filtration process for leachate treatment, Water Research 30: 2691-2706.
- Tsai HH, Ravindran V, Pirbazari M (2005) Model for predicting the performance of membrane bioadsorber reactors in water treatment applications, Chemical Engineering Science, Elsevier.
- Frigon D, BasantaKW, Mazza A, Masson L, Gehr R (2013) Biological and physico chemical wastewater treatment processes reduce the prevalence of virulent Escherichia coli.
- OualiMS (2001) Water treatment OPU.
- Degremont1989 Memento technique of water(9thedn), Paris.
- Messabih H. Improvement of biological purification efficiency by addition of CAP activated carbon powder. unpublished.
- Messabih H (2007) Development and optimization of liquid effluents from the Arzew refinery, magisterium memory, ENSET Oran, unpublished.
- Berne F, Cordonier J (1991) Water treatment,Technip edition, Paris.
- Mohammed SA (2002) Modeling adsorption by micro porous coals: theoretical and experimental approaches, University ofNeuchatel Book.
- Nitrogen by activated sludge at low temperature, doctoral thesis, University Louis Pasteur -Strasbourg I Discipline: Sciences for the Engineer (specialty process engineering).
- Ferhan C,Özgür A (2013) Activated carbon for water and wastewater treatment integration of adsorption and biological treatment.
- Howard B (2013)Adsorption calculations and modelling.
- Redouane F,Aissa A (2017) Characterization of gaseous pollutants from the fertilizer complex fertial (Arzew-Algeria). Environ SciInd J13:151.

Open Access Journals
- Aquaculture & Veterinary Science
- Chemistry & Chemical Sciences
- Clinical Sciences
- Engineering
- General Science
- Genetics & Molecular Biology
- Health Care & Nursing
- Immunology & Microbiology
- Materials Science
- Mathematics & Physics
- Medical Sciences
- Neurology & Psychiatry
- Oncology & Cancer Science
- Pharmaceutical Sciences