Assessment of Students Behavioral Risk to Environmental Hazards in Academic Institutions in Ghana
Edward Kweku Nunoo1*, Eric Twum2 and Anthony Panin3
1Institute for Oil and Gas Studies, University of Cape Coast, Cape Coast, Ghana
2Institute of Green Growth Solutions Accra, Accra, Ghana
3Graduate School, Central University, Mataheko Campus, Accra, Ghana
- *Corresponding Author:
- Edward Kweku Nunoo
Institute for Oil and Gas Studies, University of Cape Coast, Ghana
Tel: +233 26 856 9965
E-mail: edward.nunoo@ucc.edu.gh
Received date: November 01, 2018; Accepted date: November 16, 2018; Published date: November 21, 2018
Citation: Nunoo EK, Twum E, Panin A (2018) Assessment of Students Behavioral Risk to Environmental Hazards in Academic Institutions in Ghana. J Environ Res Vol.2: No.2:9.
Abstract
This paper used a multi-staged analytical approach and the hierarchization matrix method to identify and evaluate scientific information on the most affecting and most sensitive elements in an academic environmental management system (AEMS) and assessed students’ behavioral tendencies likely to invoke risk. The hierarchization matrix analysis used, identified university administrators and students asthe most affecting and sensitive human elements(MSHE) respectively. Correlation was established between behavioural instincts, adherence to safety nets and risk minimization as the likelihood of fire outbreak in a lecture hall or fighting in a parked canteen (Food plaza) both registered high-risk levels (4.5 and 4.2 respectively) on the scale. Some members of the MSHE (68%), sampled from three universities (n=325), were found to be ignorant of activities strongly perceived to predispose them to environmental hazards and risks (EHRs), and ‘Always’ or ‘Sometimes’ indulged in them. The paper also confirmed some members of the MSHE to be highly at risk due to motivations behind some choices made and concluded on the need for institutionalizing EHRs and safety culture, rolling out a comprehensive environmental management systems’ manual in the AEMS and embarking on an effective EHRs knowledge dissemination campaigns.
Keywords
Environment and health hazards; Behavioral risk; Hierarchization matrix; Affecting and sensitive human elements; Safety culture mitigation; Academic environmental management system
Introduction
We are all confronted with diverse and varying degrees of environmental hazards, including pollution (noise and vehicular traffic) everyday. The EHR tool is deemed important for environmental protection, vulnerability and adaptation assessments in built establishments, including academic institutions [1]. It is also useful in evaluating scientific information on hazardous properties of environmental agents, their interaction with environmental elements, and the extent to which humans are exposed to these agents [2]. Limited scientific data exist on this discipline in Ghana because it is a relatively young academic area of research. As a result, a number of accidents and incidents with fatal consequences have occurred in AEMS undocumented [3]. A lot more accidents are to be expected because literature suggests that either contingency measures in this built environment is relatively poor or practically non-existent [4-7].
Environmental hazards and safety culture in academic institutions
Environmental hazard is defined in this paper to mean any source of potential damage, harm or adverse health effects on something or someone under certain conditions within the built environment [8,9]. Risk, on the other hand, is the chance or probability that a person will be harmed or experience an adverse health effect if exposed to a hazard. This definition is broad enough to include property or equipment loss as well in a given environment. Risk is influenced by the frequency at which a receptor is exposed to a hazardous agent or condition (probability) and how severe (impact) the effect is under the given conditions of exposure [10]. Kemsley and Baum explain that devastating incidents occur in built environments, including universities, because they do not have strong EHRs and safety cultures and hence, must be integrated into the AEMS [11]. Safety is a positive value for the AEMS of which management should formally institutionalize and practice effectively to mitigate high incidence of hazards and possibly, deaths [10]. This could save lives, enhance productivity and efficient services delivery. Prior to this assertion, Van Noorden shared similar thoughts and opined that safety could bestow a sense of confidence and caring on the human elements in such environments [6]. Thus, a well nurtured safety culture in the AEMS will be reflected in the attitudes and behavioral instincts of stakeholders. This implies that accidents and exposures, including chemical or laboratory incidents, leading to health risks, injuries or death, must be seen as hazard and safety mitigation measure deficiencies. It therefore supports ACS’s assertion that, much as strong safety culture is required to protect higher academic institutions’ reputation and students’ health, it will also help to rekindle safety culture awareness in built environments [10]. Beyond this, safety cultures must be seen to emanate from moral, ethical, and practical considerations in the AEMS, with effective implementation, vigorously pursued by management.
Stating the problem
EHRs and safety cultures have not been adequately institutionalized in Ghana’s AEMS. As a result, receptors are exposed to varying degrees of EHRs. While most risks are perceived to be involuntary, some are consciously pursued, with motives behind such actions explained by Chatzisarantis and Hagger, Bauer et al., Whitehead, Glasgow et al. [12-15]. The focus of this paper is to contribute to ongoing debate on the need to broaden the scope of awareness on EHRs and safety culture mitigation in AEMS. Specifically, this paper identified the ‘most sensitive’ and ‘most affecting’ human elements in the AEMS, assessed students’ role in mitigating or exacerbating EHRs activities and recommended rolling out of an Environmental Management Systems (EMS) manual to institutionalise EHRs and safety cultures. Addressing the goal and objectives of the research raised five researchable questions:
(i) Which elements of the AEMS should be of critical concern to managements of the AEMS?
(ii) Why does the most sensitive human element engage in activities that are likely to predispose them to EHR?
(iii) Is the most sensitive human element in the AEMS adequately informed on EHR and safety culture measures?
(iv) Is the most sensitive human element willing to mitigate activities strongly perceived to likely exacerbate them to EHRs? and
(v) How can management of AEMS institutionalize EHR and safety culture in the teaching and learning environment?
These formed the basis for formulating and testing the underlying hypothesis.
Materials and Methods
This study used the multi-staged descriptive research design, accident investigation and hierarchization matrix methods to identify and evaluate scientific information on the most affecting and most sensitive elements in three AEMS, from October 2017 to December 2017 in three Universities in Ghana (Central University-Accra, Kwame Nkrumah University of Science and Technology-Kumasi, University of Cape-Coast, Cape Coast). Using the quota sampling method, a total of three hundred and twentyfive (n=325) students from the AEMS were sampled across six (6) academic disciplines; from the Graduate School (n=40), Humanities (n=60), Theology (n=25), Business School (n=70), Applied Sciences (n=80) and the Law school (n=50), to identify and assess twenty six (26) environmental hazards and health risk elements (Table 1) of concerns to university administrators through the stakeholder participatory approach. The choice of universities involved in the study was premised on homogeneity of the elements under consideration across the campuses, location and tertiary educational needs of the country. Although Central University is the only privately owned, apart from satisfying the criteria outlined above, it is also the largest private University in Ghana.
A set of sixty-six (66) environmental elements to be considered in the AEMS were initially identified by a team of experts (n=5). The experts, together with stakeholders (n=27), selected fortyone (41) measureable elements from the AEMS, which were further verified by another team of experts (n=3). Availability of mechanisms for the experts and stakeholders to measure and verify elements to be included in the AEMS were considered. Based on Nunoo et al., elements that were perceived to be relevant and sensitive in the system (AEMS) were rated as applicable by the experts. The applicability method included stakeholder’s participation and evaluation using the element applicability litmus scale (EALS) graduated from 0 to 100 [16]. Ratings are shown in Figure 1.

Figure 1: EHR applicability litmus scale (EALS).
Elements rated by experts to score between 50 and 100 points on the EALS were identified as applicable (A) and very applicable (VA). Overall, 26 of the ‘A’ and ‘VA’ environmental elements were adopted (Table 1). Elements that scored between 0 and 49 points were rated by experts as having little applicability (LA) and not applicable (NA) and therefore, not accepted for the matrix analysis [16].
Using a 26 × 26 hierarchization matrix, elements identified in the AEMS were mounted on each other in a ‘row’1 and ‘column’2 postures to assess how each element affects or is being affected by other elements in a closed system (Tables 2-5) with all other factors held constant. From Table 5, elements in the matrix affecting3 other elements assumed the value ‘1’. If the element does not affect other elements in the system, it registers the value ‘0’. All elements in the model not affecting other elements are known as sensitive elements (Table 5). From the matrix (Table 5), the element which registered the highest number of ‘1s’ in ‘Rows’ is the ‘most affecting’ element in the model [16,17]. The element which registered the highest number of ‘0’ is the most sensitive. The most sensitive human element from the model (Tables 5 and 6) was identified to be ‘students’ (Table 7). This element was then subjected to risk vulnerability assessment using the “what if something happens” scenarios in the study. Two cases were generated to test the likelihood of an occurrence and its impact; first, on the most sensitive human elements and second, on the environment. To do this, two pertinent questions were asked;
| S. No. | Element |
|---|---|
| 1 | Lecturers |
| 2 | Students |
| 3 | Administration |
| 4 | Security workers |
| 5 | Vendors |
| 6 | Waste management |
| 7 | Printing/copy shops |
| 8 | Restaurant/canteen |
| 9 | Lecture halls |
| 10 | Computers |
| 11 | Plates and cutleries |
| 12 | Sanitation |
| 13 | Car parks |
| 14 | Vehicles |
| 15 | Generators |
| 16 | Noise |
| 17 | Tables and chairs |
| 18 | Lighting system |
| 19 | Church |
| 20 | Stationary |
| 21 | Mobile phones |
| 22 | Ceiling fans and air conditions |
| 23 | projectors |
| 24 | Vegetation |
| 25 | Water/sanitation |
| 26 | Electricity/energy |
Table 1: Environmental elements in the AEMS.
| S. No. | Students’ actions or inactions |
|---|---|
| 1 | Ignorant of own actions likely to predispose one to EHHRs. |
| 2 | Not mindful of environmental pollution (noise). |
| 3 | Not mindful of environmental pollution (litter the environment). |
| 4 | Not involved in physical exercises or jims in order to keep fit and healthy. |
| 5 | Watch and read violent and pornographic films and materials. |
| 6 | Engage in casual and unprompted sex. |
| 7 | Consume alcoholic beverages, smokes and use hard drugs. |
| 8 | Give attention to correct attire for lectures, laboratory, social places (e.g., overalls and goggles in the work shop and skimpy exposing attire etc.). |
| 9 | Cautious of where to buy and eat food (e.g., food courts/restaurants, local canteens, on the street). |
| 10 | Undergo routine medical check-ups on health status. |
Source: Based on field data, 2017.
Table 2: Adopted environmental elements likely to predispose students to EHRs.
| S. No. | Environmental aspects |
|---|---|
| 1 | Spend pocket money and school fees on unrelated school items (sex, cigarettes, grooming kits, drugs). |
| 2 | Do not engage in physical exercises (visit gyms, jog, skip etc.). |
| 3 | Go for lectures during heavy downpour of rain. |
| 4 | Give attention to proper attire or costumes for lectures, laboratory, field work, social events. |
| 5 | Engage in casual and unprotected sex. |
| 6 | Not mindful of environmental pollution (litter the environment). |
| 7 | Watch and read pornographic materials (videos, books, online). |
| 8 | Not mindful of environmental pollution (noise). |
| 9 | Pay attention to where one buys and eats food (local canteens, restaurants, food vendors). |
| 10 | Undergo periodic health status checkups on STDs, hepatitis B and HIV/AIDS. |
| 11 | Ignorant of actions likely to predispose one to environmental hazards and health risk. |
| 12 | Care to periodically donate blood to hospitals. |
| 13 | Trade sex for money. |
| 14 | Do not attend environmental awareness campaigns when they are organized on campus. |
| 15 | Consumes alcoholic beverages, smokes, uses hard drugs. |
| 16 | Administer self-medication. |
| 17 | Using grooming kits/substances. |
Source: Based on field data, 2017.
Table 3: Environmental elements strongly perceived to predispose one to EHRs.
| S. No. | Sex Partners | Mitigation of non-sex but risky actions | Semester budgetary allocations on perceived risky activities |
|---|---|---|---|
| 1 | With legal partner (Married) | Engaged in smoking/drugs | Grooming kits/Mary K/substances |
| 2 | With non-legal partner (inte*) | Consumed alcoholic bervages | Cigarettes and hard drugs |
| 3 | With non-legal partner (exte*) | Used cosmetics grooming substances | Sex/pornographic materials |
| 4 | Course mates | Administered self-medications | Self-administered-medications |
| 5 | Anyone attracted to | Attends discos and night clubs | Food and drinks |
| 6 | Commercial sex workers | Eats from unhygienic environment | Discos/night clubs/alcohol |
| 7 | Abstinence | -- | -- |
Inte*: Sex partner resident on university campus;
Exte*: Sex partner resident outside university campus
Table 4: Other perceived activities contributing to EHR in the AEMS.
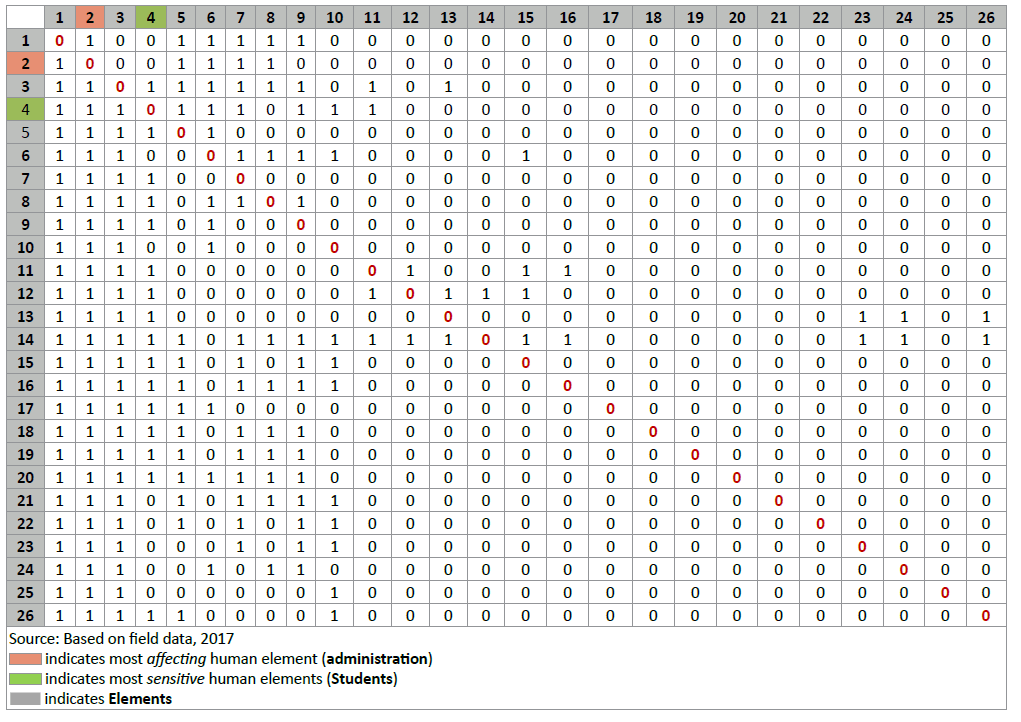
Table 5: Hierachization matrix for the AEMS.
(i) What happened if there was fire breakout in a lecture hall? and,
(ii) What happened if fighting erupted in a parked canteen in the AEMS?
Primary data on students’ vulnerability to EHR were obtained and assessed through stratified random sampling by administering semi structured questionnaires (Mind content model-MCM) and through focus group discussions.
Exposure to environmental risks by the most sensitive human element (students) was assessed with the assumption that, the extent to which the most sensitive human element is exposed to risk (Erk) in the AEMS is influenced by the probability of an occurrence (Po), and the severity of its impact (Sd). It is expressed by the formula; Erk=Po × Sd, where Erk is environmental risk, Po is probability of an occurrence and Sd is severity or impact of damage. To investigate impact of actions or inactions of the most sensitive human element to environmental elements strongly perceived to predispose them to EHRs in the AEMS, 10 behavioural instincts were selected (Table 2) by expects from a total of seventeen (Table 3).
Using focus group discussions and questionnaires (MCM), the study probed further to elicit information on the most sensitive human elements’ sexual activities, mitigation of sexual activities, non-sexual, but risky actions and their sources of finance for engaging in risky activities likely to pre-dispose the most sensitive human element to EHRs (Table 4). Data obtained from the field were analyzed, both qualitatively and quantitatively, using Microsoft office (version 10) and the statistical package for social science (SPSS).
Results and Discussions
The hierarchization matrix
Per characterization and ranking (Table 5), the element that registered the highest number of ‘1s’ in ‘Rows’ of the matrix was identified to be vehicles/transportation, hence, the most affecting element in the AEMS. It registered 17 ‘1s’. This was followed by administration (10 ‘1s’), security workers (9 ‘1s’), noise (9 ‘1s’), stationary (9 ‘1s’), generators (8 ‘1s’), sanitation (8 ‘1s’), lighting system (8 ‘1s’), church (8 ‘1s’), mobile phones (8 ‘1s’), waste management (7 ‘1s’), restaurant/canteen (7 ‘1s’) and in that progression respectively, until the least affecting element, computers (4‘1s’), and summarily, depicted by Table 6. The study, however, overlooked vehicles/transportation as the most affecting element and considered the most affecting human element (Administration) for the analysis. Probing further, the element with the highest number of ‘0s’ in rows, of the matrix, was considered to be the most sensitive element. Ranking the elements, from the most to the least sensitive, as summarily outlined in Table 6, identified printing/copy shops (22 ‘0’) as the most sensitive element. This was followed by computers (22 ‘0s’), water/sanitation (22 ‘0s’), students (21 ‘0s’), vendors (21 ‘0s’), lecture halls (21 ‘0s’), lecturers (20 ‘0s’), tables and chairs (20 ‘0s’), computers (20 ‘0s’), projectors (20 ‘0s’), vegetation (20 ‘0s’), electricity/energy (20 ‘0s’), and runs through until the least sensitive element, plates and cutleries, with 9 ‘0s’. Again, printing/copy-shop was over looked by the paper and adopted the most sensitive human element (students) for the analysis as depicted by Table 7).
| Element No. in matrix | Description of element in matrix | No. of ‘1s’ obtained | Ranking | Most affecting element >>>> |
|---|---|---|---|---|
| 1 | Lecturers | 6 | 16th | Vehicles/transportation |
| 2 | Students | 5 | 21th | Administration |
| 3 | Administration | 10 | 2nd | Security workers |
| 4 | Security workers | 9 | 3rd | Noise |
| 5 | Vendors | 5 | 22st | Stationary |
| 6 | Waste management | 7 | 11th | Generators |
| 7 | Printing/copy shops | 4 | 24rd | Sanitation |
| 8 | Restaurant/canteen | 7 | 12th | Lighting system |
| 9 | Lecture halls | 5 | 23nd | Church |
| 10 | Computers | 4 | 25th | Mobile phones |
| 11 | Plates and cutleries | 7 | 13th | Waste management |
| 12 | Sanitation | 8 | 7th | Restaurant/canteen |
| 13 | Car parks | 7 | 14th | Plates and cutleries |
| 14 | Vehicles/transportation | 17 | 1st | Car parks |
| 15 | Generators | 8 | 6th | Ceiling fans and air conditions |
| 16 | Noise | 9 | 4th | Lecturers |
| 17 | Tables and chairs | 6 | 20th | Computers, laptops, projectors |
| 18 | Lighting system | 8 | 8th | Vegetation |
| 19 | Church | 8 | 9th | Electricity/energy |
| 20 | Stationary | 9 | 5th | Tables and chairs |
| 21 | Mobile phones | 8 | 10th | Students |
| 22 | Ceiling fans and air conditions | 7 | 15th | Vendors |
| 23 | Projectors | 6 | 17th | Lecture halls |
| 24 | Vegetation | 6 | 18th | Printing/copy shops |
| 25 | Water/sanitation | 4 | 26th | Computers |
| 26 | Electricity/energy | 6 | 19th | Water/sanitation |
Source: Based on hierarchization matrix, 2017
Table 6: Most affecting elements in the AEMS.
| Element No. in matrix | Description of element in matrix | No. of ‘0s’ obtained | Ranking | Most sensitive element >>>> |
|---|---|---|---|---|
| 1 | Lecturers | 20 | 7th | Printing/copy shops |
| 2 | Students | 21 | 4th | Computers |
| 3 | Administration | 16 | 25th | Water/sanitation |
| 4 | Security workers | 17 | 22nd | Students |
| 5 | Vendors | 21 | 5th | Vendors |
| 6 | Waste management | 19 | 12th | Lecture halls |
| 7 | Printing/copy shops | 22 | 1st | Lecturers |
| 8 | Restaurant/canteen | 19 | 13th | Tables and chairs |
| 9 | Lecture halls | 21 | 6th | Computers, laptops, projectors |
| 10 | Computers | 22 | 2nd | Vegetation |
| 11 | Plates and cutleries | 19 | 14th | Electricity/energy |
| 12 | Sanitation | 18 | 17th | Waste management |
| 13 | Car parks | 19 | 15th | Restaurant/canteen |
| 14 | Vehicles/transportation | 9 | 26th | Plates and cutleries |
| 15 | Generators | 18 | 18th | Car parks |
| 16 | Noise | 17 | 23rd | Ceiling fans and air conditions |
| 17 | Tables and chairs | 20 | 8th | Water/sanitation |
| 18 | Lighting system | 18 | 19th | Generators |
| 19 | Church | 18 | 20th | Lighting system |
| 20 | Stationary | 17 | 24th | Church |
| 21 | Mobile phones | 18 | 21st | Mobile phones |
| 22 | Ceiling fans and air conditions | 19 | 16th | Security workers |
| 23 | Projectors | 20 | 9th | Noise pollution |
| 24 | Vegetation | 20 | 10th | Stationary |
| 25 | Water/sanitation | 22 | 3rd | Administration |
| 26 | Electricity/energy | 20 | 11th | Vehicles/transportation |
Source: Based on Hierachizationmatrix, 2017
Table 7: Most sensitive elements.
Ranking of elements: In ranking the elements, if at any point in time, two (2) or more elements in “Rows” registers the same number of either ‘1s’ or ‘0s’, the ‘Columns’ with the highest number of ‘1s’ or “0s” supersedes in the order of ranking (Table 5). The most affecting elements are the least responsive elements in the system. The most affecting human element (Administration) is the element that registers the highest number of ‘1s’, per ranking, in the model and identifies with human beings in the AEMS (Tables 5 and 6).
The sensitive elements are those elements highly responsive in the system. The most sensitive human element is the sensitive element that registers the highest number of ‘0s’ in the model (Table 5) and identifies with human elements in the system. Per ranking this was identified as ‘students’ (Tables 5 and 7).
Characterization and ranking of the element’s present formidable opportunities for managers of the AEMS to address specific environment related hazards and health risk issues. “Administration”, identified as the most affecting human element, is better placed in the AEMS to manage the sensitive elements by institutionalising EHR and safety cultures. One effective way to do this is to adopt an environmental management systems’ (EMS) manual and implementation plan that integrates hazards and risks as well as safety culture into policies and programmes [18-20].
Hazard modeling scenarios
Exposure to environmental hazards by the most sensitive human element (students) in the AEMS was analysed using a risk model, given as; Erk= Po × Sd, based on GAO [1]. The underlying concept was to create safety in the AEMS instead of advising for caution [21] in the sense that any departure from the safety nets has a tendency to increase the magnitude of exposures to risk [7,10,22,23]. Risk in the AEMS was quantified on the Likert scale with 6 as the highest value. Low risk was perceived with a maximum value of 2.0 and the upper limit of medium risk, pegged at 4.0 (Figure 2) [24].

Figure 2: Risk quantification.
Fire outbreak in lecture theatre: Based on this model (Figure 2), two scenarios were tested. In scenario 1, the study assumed that, “all other things being equal” and given a normal teaching and learning environment in a lecture hall, experts concurred that the risk of fire outbreak would be contained at medium level and rated at 3.0 on the scale (likelihood of an occurrence) [21]. To determine its impact (severity) on the most sensitive human element, experts rated it at 0.6 on the scale. Calculating risk on students when there is fire outbreak in a lecture hall registered 1.8 (3.0 × 0.6) on the scale. Risk associated with the likelihood of fire outbreak on the environment (occurrence) registered 3.0 (medium). The impact (severity) this will have on the environment was rated at 0.9. Calculating risk on the environment, with an outbreak of fire in a lecture hall, registered 2.7 (3.0 × 0.9) on the scale. Thus, total risk, with fire outbreak in the AEMS, was determined by summation of risk on the most sensitive human element (1.8) and its impact on the environment (2.7), which registered 4.5 (1.8+2.7), on the scale, indicating high risk.
Fighting amongst students in canteen: Under scenario 2, again, experts assummed that, given a normal lunch time in the AEMS food canteen (Food plaza), filled with students, any outbreak of fighting among students could be contained at the medium level and rated at 3.2 (probability of occurrence) on the scale. The impact (severity) this would have on students was rated 0.9. Thus, risk on students in the AEMS when there is fighting in a packed canteen registered 2.9 (3.2 × 0.9) on the scale. The probability of risk in the food plaza environment when there is fighting scored 3.2 on the scale. Its impact (severity) on the environment measured 0.4, registering a total figure of 1.3 (3.2 × 0.4). Total risk, with an outbreak of fighting in a canteen, was determined by the sum of risk on students plus risk on the environment (2.9+1.3) which is 4.2, also indicating high risk on the scale.
The Impacts from the scenarios, based on GAO’s, were transposed onto four levels (I, II, III, IV), depending on the severity of damage to property, environment and or loss of lives (Table 8) [1]. Transposition of outcome of the hazard modeling scenarios in this study was identified to fall within GAO’s category I of the risk matrix, as both risk levels (fire outbreak, fighting) recorded were high (4.5 and 4.2) on the scale (Figure 2) [1]. This level of risks could lead to human deaths, loss of critical property, disruption of teaching and learning, and severe environmental damage as depicted by Table 8.
| Level | Impact |
|---|---|
| Category I Frequent: Possibility of repeated incidents | Death, loss of critical propriety, system disruption, severe environmental damage. |
| Category II Probable: Possibility of isolated incidents | Severe injury, loss of propriety, information, severe health related illness, environmental damage. |
| Category III Occasional: Possibility of occurring sometime | Minor injury, minor health related illness, or minor system or environmental damage. |
| Category IV Remote: Not likely to occur | Less than minor injury, health related illness, or less than minor system or environmental damage. |
Based on GAO, 1999
Table 8: Categorization of risk severity and probability levels in the AEMS.
The severity and impact categories outlined in Table 8 translate into a risk assessment matrix (Table 9). The assessment matrix is relevant in informing management which risk decisions to consider as significant and unacceptable, and less significant and permissible [5]. It also provides information on which safety culture and EHR awareness campaign [23,25,26] are needed for corrective actions. With risk levels at 4.5 (outbreak of fire in lecture room) and 4.2 (outbreak of fighting in canteen), there is indication of high risk. Per the RAM, management of the AEMS, as a matter of urgency, need to re-assess safety measures in all lecture halls and canteens/restaurants and, where possible, intensify EHR awareness campaigns [17,27] in all the AEMS since these risk levels are undesirable and require immediate corrective actions.
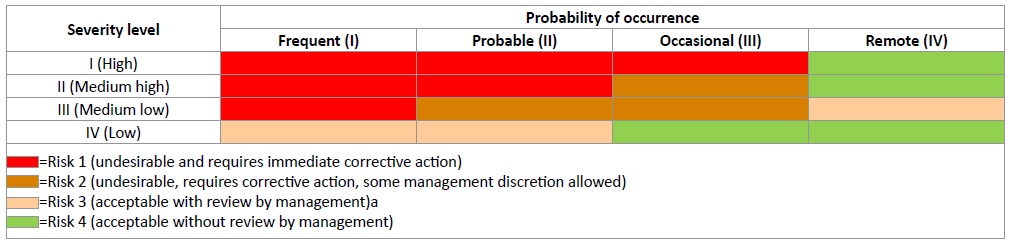
Table 9: Risk assessment matrix (RAM).
Bio-Information on the Most Sensitive Human Element
A total of three hundred and twenty-five (325) respondents from three University campuses in Ghana took part in the study. Thirty one percent (31%) of the respondents were aged between 16 and 25 years, representing the regular stream of students in the AEMS. Twenty-five percent (25%) were evening and weekend students and some regular students aged between 26 and 35 years. Sixteen percent (16%), who are above 45 years, came from, mostly, the Weekend and Evening programmes of the Graduate schools. Respondents were proportionately drawn from six (6) academic disciplines; the graduate school, humanities, theology, business school, applied sciences and the Law schools (Table 10).
| Items | Numbers | |||
|---|---|---|---|---|
| Sex | Male | Female | Total | % |
| Age (years) Category |
||||
| 16-25 | 48 | 52 | 100 | 31 |
| 26-35 | 39 | 43 | 82 | 25 |
| 36-45 | 44 | 47 | 91 | 28 |
| >45 | 25 | 27 | 52 | 16 |
| Total | 156 | 169 | 325 | 100 |
| Academic discipline | Male | Female | Total | % |
| Graduate school | 19 | 21 | 39 | 12 |
| Business school | 34 | 36 | 70 | 21.5 |
| Applied sciences | 38 | 42 | 80 | 24.6 |
| Humanities | 29 | 31 | 60 | 18.5 |
| Theology | 12 | 13 | 25 | 7.9 |
| Law | 24 | 26 | 51 | 15.7 |
| Total | 156 | 169 | 325 | 100 |
Source: Field data, 2017
Table 10: Bio-information, information on sensitive human elements.
Gender distribution of respondents was slightly skewed in favour of females (52%). Most of the respondents (88%) had enrolled in the Bachelors’ degree programmes with the graduate enrolment registering the lowest (16%). This confirms perceptions held by one school of thought that undergraduate students’ have a higher tendency to enjoy campus social life than graduate students. Sex and Age were both significant in determining outcome of the responses [28].
Strongly perceived activities likely to predispose students to EHRs in the AEMS
Ten activities (Table 11), likely to predispose the MSHE (Table 7) to EHHRs were identified. To find out how these activities, knowingly or otherwise, contributed towards the existence of EHR, respondents’ opinions were sought on whether they ‘Sometimes’ (Ẋ=112.0, Std Dev=65.51166), ‘Always’ (Ẋ=105.2, Std Dev=77.23097), or ‘Never’ (Ẋ=109.8, Std Dev=58.92142) indulged in such activities (Table 11).
| S. No. | Activities | Returned response category (n=325) | ||
|---|---|---|---|---|
| Sometimes (%) | Never (%) | Always (%) | ||
| 1 | Student ignorant of own actions likely to expose one to EHHR. | 39 (12) | 215 (66) | 71 (22) |
| 2 | Student not mindful of noise pollution by setting music systems up with high volume on campuses, halls/hostels of residence. | 169 (52) | 72 (22) | 84 (26) |
| 3 | Student not conscious of waste bins and litters environment (campus, lecture rooms, halls, hostels). | 244 (75) | 46 (14) | 35 (11) |
| 4 | Student not engaged in physical exercises, in order to keep fit and healthy. | 150 (46) | 58 (18) | 117 (36) |
| 5 | Student watch/read sex and pornographic films/materials. | 72 (22) | 94 (29) | 159 (49) |
| 6 | Student engage in casual and unprompted sex. | 78 (24) | 179 (55) | 68 (21) |
| 7 | Student consumes alcoholic beverages, smokes and use hard drugs. | 46 (14) | 241 (74) | 38 (12) |
| 8 | Student give attention to proper attire/costume for lectures, laboratory, fieldtrip, social places (e.g., overalls, gloves and goggles in the workshop and skimpy exposing attire etc). |
68 (21) | 59 (18) | 198 (61) |
| 9 | Student pays attention to where one buys and eats food (e.g., restaurants, local canteens, on the street etc). | 98 (30) | 68 (15) | 179 (55) |
| 10 | Student undergoes periodic medical check-ups on health status about STDs, Hepatitis B and HIV/AIDS. | 156 (48) | 20 (6) | 149 (46) |
| Descriptive statistics | ||||
| Mean (Ẋ) | Ẋ=112 (34.4) | Ẋ=105.2 (31.7) | Ẋ=109.8 (33.9) | |
| Std. | Std=65.51166 | Std=77.23097 | Std=58.92142 | |
*Absolute figures are to the nearest whole numbers
Source: Field data, 2017
Table 11: Strongly perceived activities likely to predispose students to EHHR.
Leaving aside extreme values, the distribution was observed to be normal. Satisfied that differences in perceived responses between ‘Sometimes’ (mean=112.000, Std Dev=65.51) and ‘Always’ (mean=109.800, Std Dev=58.92) have, approximately, normal distributions, the paired samples t-test was applied. The descriptive statistics and the p-value associated with the test statistics with a confidence interval of 95% for the mean perceived responses to EHRs, suggests a no significant difference in ‘Sometimes’ and ‘Always’ responses to the EHR factors (t(9)=0.07, p>0.05). A one-sample chi-square test confirmed that categories of risk activities occur with equal probabilities, hence retaining the null hypothesis (p>0.05) that other factors than those listed in Table 11 could also be affecting. An average of 32% of the sensitive human elements had ‘Never’ engaged in any of the activities listed (Table 11). However, responses on two other opinions; ‘Sometimes’ and ‘Always’ showed a high level of risk, as 34.4% of the students ‘Sometimes’ and 33.9%, ‘Always’, engage in all listed activities. This is an indication that more than half (68%) of the sampled population is at risk.
The assessment (Table 11) also indicates some respondents (22%) to be ‘Always’ ignorant of their own behavioural instincts likely to expose them to EHRs and an additional 12% of the students, ‘Sometimes’, behaving same. In terms of sexual activities, whilst 24% ‘Sometimes’ indulge in casual and unprompted sex, an additional 21% ‘Always’ engage in them. In addition, 49% ‘Always’ read or watch sex and pornographic films/materials with 22% ‘Sometimes’ doing same. Six percent of the sampled population, over the period, had ‘Never’ bothered to undergo periodic medical check-up to know about their health status on sexually transmitted diseases (STD’s), including hepatitis B and the human immune virus (HIV)/AIDS.
In terms of environmental pollution on noise, about 78% of the sampled population was at risk, as 26% was ‘Always’ not mindful of levels at which they set their music volumes, whilst 52% ‘Sometimes’ also behaved same. Again, on environmental pollution and proper waste disposal practices, 86% of the sensitive human element was not aware of waste bins provided at vantage points in the AEMS and therefore litter the environment (‘Sometimes’=75%, ‘Always’=11%). About 26% were involved in drug and substance abuse, consumed alcoholic beverages and smokes (‘Always’=12%, ‘Sometimes’=14%). The study also found out that whilst 18% of the sampled student population ‘Never’ paid attention to the kind of attire or costume they wear for lectures, social places, laboratory and fieldwork, 15%, also, ‘Never’ paid attention to where they buy and eat food. This presents serious EHR in the AEMS which management needs to address.
Environmental hazards and health risks mitigation
Based on hazards and risks identified in the AEMS, the study assessed attempt by the sensitive human elements to either prevent or reduce EHRs in the AEMS. These were, however, limited to measures for STDs and HIV/AIDS mitigation by reducing the number of sex partners, minimizing engagement in risky activities and spending less on activities likely to predispose students to EHR.
Sex partners: Responses on willingness to mitigate multiple sexual partners are summarized in Table 12. With a confidence interval of 0.05, and p > 0.06, there was no significance difference in perceived responses, ‘Yes’ (mean=105.42, Std Dev=82.28) and ‘No’ (mean=199.42, Std Dev=77.53) to multiple sex partners. There is a strong negative correlation (r=-1) between the responses (‘Yes’ and ‘No’) and enough evidence (p>0.05) to suggest that other mitigation factors could be considered apart from those listed in Table 12.
| S. No. | Type of sex partner | Returned Response category (n=325) | |
|---|---|---|---|
| Yes (%) | No (%) | ||
| 1 | With legal partner | 52 (16) | 273 (84) |
| 2 | With non-legal partner (inte*) | 72 (25) | 214 (63) |
| 3 | With non-legal partner (exte*) | 259 (80) | 53 (17) |
| 4 | University/school mates | 18 (6) | 274 (94) |
| 5 | Sex workers | 143 (47) | 159 (53) |
| 6 | Anyone attracted to | 53 (18) | 239 (82) |
| 7 | Abstinence | 141 (44) | 184 (66) |
| Mean (Ẋ) | Ẋ=105.4286 (33.7) | Ẋ=199.4286 (65.6) | |
| Standard deviation (Std Dev) | Std Dev=82.28580 | Std Dev=77.53033 | |
Inte*: Sex partner resident on University Campus.
Exte*: Sex partner resident outside University Campus.
Source: Field data, 2017
Table 12: Mitigation of sex activities with multiple partners.
When respondents were asked if they were willing to reduce or limit sexual activities with their partners, the following responses were obtained; 16% were willing to even reduce sexual activities with their legal partners. 25% were willing to limit sexual activities with non-legal partners within the AEMS (‘Inte’). Six percent (6%) were willing to reduce it amongst schools or course-mates and 80%, amongst ‘Exte’. 47% is willing to reduce sex activities with commercial sex workers and students’ whose sexual maneuvers were influenced by mere attraction to anyone on or outside campuses, were willing to limit sexual activities by 18%. In addition to respondents who were readily willing (44%) to abstain from all sexual activities with their partners on campuses, an average of 34% was willing to reduce all sex life activities with their sex partners. This is clear indication that if the MSHE is adequately sensitized in the AEMS, they could play critical role in EHRs mitigation measures.
Mitigation of sexually transmitted diseases (STDs): The study further assessed sexual activities that contributed to the spread of STDS, including the human immune virus (HIV) and acquired immune deficiency syndrome (AIDS). Five behavioural activities, common to all AEMS and listed in Table 13, were interrogated.
The analysis established a negative perfect correlation between the ‘Yes’ and ‘No’ responses. With a standard deviation of 98.4 for the ‘Yes’ responses, halve (50%) of the sensitive human element was willing to mitigate all activities responsible for spreading STDs. Management could identify this group of students and make available to them preventive measures that are readily available, including safety nets and environmental hazards and risk sensitisation. Apart from 2% of the students who will abstain from all sexual activities, 48% of the sampled group seemed to be ignorant about outcomes of ones behaviour and were not willing to change these practices (Table 13). Based on Bauer et al. and Whitehead, management of the AEMS, need to identify, engage and help this group of students to conform to current values and norms of health promotion and safety culture practices [13,29].
| S. No. | Sexual activities | Returned Response category (n =325) | |
|---|---|---|---|
| Yes (%) | No (%) | ||
| 1 | Solicit for sex | 107 (33) | 218 (67) |
| 2 | Not to engage in unsafe sex (condoms) | 270 (83) | 55 (17) |
| 3 | Stay faithful to partner | 257 (79) | 68 (21) |
| 4 | Reduce multiple sex partners | 137 (42) | 188 (58) |
| 5 | Stop all sexual activities | 42 (13) | 283 (77) |
| Mean (Ẋ) | Ẋ=162.6 (50) | Ẋ=162.4 (48) | |
| Standard deviation (Std Dev) | Std Dev=98.40884 | Std Dev=98.40884 | |
| Correlation | -1 | 1 | |
Source: Field data, 2017
Table 13: Mitigation of STDs.
Mitigation of non-sex, but risky activities: The study further assessed the MSHE’s willingness to mitigate engagement with non-sex, but other risky activities identified in Table 14. Respondents were asked if they were going to be extra careful with the environment from where one eats, consumption of alcoholic beverages, quit smoking and use of hard drugs, minimise or stop using cosmetics/grooming substances, stop attending discos/ night clubs and stop administering self-medication.
| S. No. | Risk variables | Returned Response category (n =325) | |
|---|---|---|---|
| Yes (%) | No (%) | ||
| 1 | Eat and drink from unhygienic restaurant/canteen | 211 (65) | 114 (35) |
| 2 | Consumes alcoholic beverages | 81 (25) | 244 (75) |
| 3 | Engaged in smoking/use of hard drugs | 23 (7) | 302 (93) |
| 4 | Use cosmetics and grooming substances | 302 (93) | 23 (7) |
| 5 | Attend discos and night clubs | 91 (28) | 234 (72) |
| 6 | Administered self-medications | 263 (81) | 62 (19) |
| Mean (Ẋ) | Ẋ=161.8 (49.8) | Ẋ=163.2 (50.2) | |
| Standard deviation (Std Dev) | Std Dev =35.76 | Std Dev=23.06 | |
Source: Field data, 2017
Table 14:Mitigation of non-sex hazards, but risky activities.
The analysis established a positive correlation (r= +1) between the sexually active sensitive human elements and unwillingness to mitigate non-sex related hazards and risks. Opinions expressed on this question were almost equally divided between ‘Yes’ and ‘No’ as the MSHEs, willing to mitigate (‘Yes’) non-sex, but risky actions registered an average of 162 as opposed to 163 responses for those not willing (‘No’) to do so (Table 14). Although the response rate is 0.4 higher and skewed in favour for the ‘No’ responses (‘Yes’=49.8%, ‘No’=50.2%), this was a clear indication that some members of the sensitive human element were willing to mitigate activities listed in Table 14. According to Kaplan and Mike [30], management of EHR must treat this as a compliance issue by rolling out an AEMS manual and policies to enforce it. Beyond this, the study agrees with outcome of a report by the World Health Organization that, it is only when students are educated on sustainable health and nutritional habits that their likelihood to remain healthy could be guaranteed since well informed adults stands better chances of making good choices about behavioural instincts including what they consume [31]. This could as well be applicable to choices made in respect of EHR in the AEMS.
Funding of non-sex, but risky activities: Finally, the study assessed the proportion of finances spent on non-sex, but risky activities listed in Table 15. Analysis of the returned responses established a relationship amongst the pattern and extent of expenditure on activities likely to pre-dispose students to EHRs. Overall, 26% of the respondents used significant proportions of their semester incomes on non-sex, but risky activities. 53% spent averagely and 22% spent minimally on these items (Table 15).
| S. No. | Proportion of expenditure on Non-sex but risky activities | Returned Responses category (n =325) | ||
|---|---|---|---|---|
| Minimal | Average | Significant | ||
| 1 | Eat and drink from unhygienic restaurant/canteen | 88 (27%) | 159 (49%) | 78 (24%) |
| 2 | Consumes alcoholic beverages | 42 (13%) | 169 (52% | 114 (35%) |
| 3 | Engaged in smoking/use of hard drugs | 52 (24%) | 198 (61%) | 81 (25%) |
| 4 | Use cosmetics and grooming substances | 68 (21%) | 163 (50%) | 194 (25%) |
| 5 | Attend discos and night clubs | 88 (27%) | 156 (48%) | 81 (25%) |
| 6 | Administered self-medications | 55 (17%) | 195 (60%) | 75 (23%) |
| Mean (Ẋ) | Ẋ=65.5 (21.5) |
Ẋ=173.3 (53.3) | Ẋ=103.8 (26.1) | |
| Standard deviation (Std Dev) | Std Dev=43.18 | Std Dev=41.35 | Std Dev =76.165 | |
Source: Field data, 2017
Table 15: Proportion of expenditure on Non-sex but risky activities.
From Table 15, those who spend averagely (53.3%) dominated with the same pattern shown on all individual items (Std Dev=41.35). This is followed by those who used minimum proportion of their finances on such items. Averagely, this category of the most sensitive human element was spending 21.5% of their finances on all items listed in Table 15 (Std Dev=43.18) and lastly 26.1% of the MSHE spent significant proportions of their incomes on all items listed. Since there was evidence to suggest that majority of the target group in this category were spending minimally (21.5%) and averagely (53.3%) on Non-sex, but risky activities likely to predispose them to environmental hazards and health risk, there is indication that management could capitalise on the few (26.1%) who spend significant proportion of their finances on this activity to formally roll out an EHR mitigation plan.
Conclusion and Recommendation
Behavioural risk assessment in the Ghanaian AEMS indicate that EHRs and safety cultures have not been well institutionalised. As a result, receptors were exposed to varying degrees of EHRs. Awareness campaigns on environmental hazards, safety nets and health promotion, according to Whitehead, are actions promising fundamental reforms in built environment. These could be applicable to EHRs mitigation in the AEMS. Supported by the self-determination theory [12], this study confirmed some members of the MSHEs to be highly at risk due to some choices made [20,32], that were likely to predispose them to EHRs. To implement EHR policies for a safe and healthy community development [33], it is imperative for management to implement a coordinated action plan aimed at hazard-free environment. Attributes of such promotion are well discussed by Macdonald and Bunton and Rush [34,35].
Micheka, 2004 and Nunoo, 2007 [36,37], observed that ignorance of environmental health issues by the most MSHE is a contributory factor to environmental problems, poverty and unsustainable living lifestyles. Although some of the most MSHE have indicated their willingness to mitigate EHRs actions or inactions, further interventions by university management, including conducive physical environment for studies, safety rules and regulations for all units, availability of fire-fighting equipment, street lighting, voluntary counseling and testing (VCT) center need to be in place so that at all times, majority of the students are put in the right perspective and guided.
References
- GAO (1999) Information security risk assessment: Practices of leading organizations, Accounting and Information Management Division, Washington, DC, USA.
- Relative Culture Strength (RCS) (2009) A key to sustainable world-class safety performance, Princeton University, New Jersey, USA.
- Environmental Health and Safety (EHS) (2011) Laboratory safety manual. Policy Section: Workplace Health and Safety.
- Hewitt M (2012) Relative culture strength: A key to sustainable world-class safety performance. DuPont Safety Resources, Washington, DC, USA.
- Krause T (2011) The Ethics of Safety 2: 1.
- Van Noorden RA (2011) Death in the Lab: Fatality adds momentum to calls for a shakeup in academic safety culture. Nature 472: 270-271.
- Occupational Safety and Health Administration (OSHA) (2011) Occupational safety and health standards. Occupational Exposure to Hazardous Chemicals in Laboratories.
- Royal Society (1992) Risk: Analysis, perception and measurement. Royal Society, London.
- EPA (2016) Hazardous and Electronic Waste Control and Management Act (ACT 917). Environmental protection Agency, Accra, Ghana.
- American Chemical Society (ACS) (2012) Creating safety cultures in academic institutions: A report of the safety culture task force of the ACS committee on chemical safety, Washington, DC, USA.
- Kemsley J, Baum R (2010) Texas technological lessons. Chem Eng News 88: 34-37.
- Chatzisarantis NLD, Hagger MS (2009) Effects of an intervention based on self-determination theory on self-reported leisure time physical activity participation. Health Psychol 24: 29-48.
- Bauer G, Davies JK, Pelikan J, Noack H, Broesskamp U, et al. (2003) Advancing a theoretical model for public health and health indicator development. Eur J Public Health 12: 107-113.
- Whitehead D (2001) A stage planning programmme model for health education/health promotion practice. J Adv Nurs 36: 311-320.
- Glasgow RE, Vogts TM, Boles SM (1999) Evaluating the public health impact of health promotion interventions. Am J Public Health 89: 1322-1327.
- Nunoo EK, Twum E, Panin A (2016) A criteria and indicator prognosis for sustainable forest management assessments: Concepts and optional policy baskets for the high forest zone in Ghana. J Sustain Forest 35: 149-171.
- Lowry PB, Jenkins JL, Twyman NW, Hammer B, Gaskin J, et al. (2008) Proposing the hedonic affect model (HAM) to explain how stimuli and performance expectations predict affect in individual and group hedonic systems use. J Assoc Inf Syst 8: 1-51.
- Bobbitt LM, Dabholkar PA (2001) Integrating attitudinal theories to understand and predict use of technology-based self-service: The internet as an illustration. Int J Serv Ind Manag 12: 423-450.
- Bandura A (1977) Self-efficacy: Towards a unifying theory of behaviourial change. Psychol Rev 84: 191-215.
- Ajzen I (1985) From intentions to actions: A theory of planned behavior. Kuhl J. Beckman J, (ed.). Action-Control: From Cognition to behavior, Heidelberg, Germany. Springer pp: 11-39.
- Workman M (2005) Expert decision support system use, disuse, and misuse: A study using the theory of planned behavior. Comput Hum Behav 21: 211-231.
- Fiorino D (1989) Environmental risk and democratic process: A critical review.
Colum J Envtl L 14: 501-547. - Relative Culture Strength (RCS) (2008) Environment, health and safety committee note on environmental risk assessment. Environment, Health and Safety Committee (EHSC), London.
- Likert R (1932) A technique for the measurement of attitudes. Arch Psychol 140: 1-55.
- Hewitt M (2011) Relative culture strength: A key to sustainable world-class safety performance, global workplace safety practice, Wilmington, Delaware.
- National Research Council of the National Academies (NRCNA) (2011) Prudent practices in the laboratory: Handling and management of chemical hazards–an update. National Research Council of the National Academies, National Academies Press, Washington, DC, US.
- Whitehead D (2011) Health promotion in nursing: A Derridean discourse analysis. Health Promot Int 26: 117-127.
- Morris MG, Venkatesh V, Ackerman PL (2005) Gender and age differences in employee decisions about new technology: An extension to the theory of planned behavior. IEEE T Eng Manage 52: 69-84.
- Whitehead D (2004) Health promotion and health education: Advancing the concepts. J Adv Nurs 47: 311-320.
- Lowry PB, Twyman NW, Gaskin J, Hammer B, Bailey A, et al. (2007) Proposing the interactivity-stimulus-attention model (ISAM) to explain and predict enjoyment, immersion, and adoption of purely hedonic systems, Proceedings of the Special Interest Group on Human-Computer Interaction 2007 Pre-ICIS Workshop at the International Conference on System Sciences, Montréal, Canada pp: 72-76.
- World Health Organization (2006) Global strategy on diet, physical activity and health: A framework to monitor and evaluate implementation. Geneva: World Health Organization, Switzerland.
- Antonovsky A (1996) The salutogenic model as a theory to guide health promotion. Health Promot Int 11: 11-18.
- Tones K (2001) Health promotion: The empowerment imperative. (2nd edn) Scriven A, Orme J, (ed). Health promotion: Professional Perspectives, Palgrave, Basingstoke Hampshire, England pp: 3-18.
- Macdonald G, Bunton R (2002) Health promotion: Disciplinary developments. (2nd edn). Bunton R, Macdonald G, (ed.) Health promotion: Disciplines, diversity and developments, Routledge, London pp: 9-27.
- Rush KL (1997) Health promotion ideology and nursing education. J Adv Nurs 25: 1292-1298.
- Micheka AM (2004) The state of Kenyan Environment: Unpublished speech delivered to the National Environment Management Board on the occasion of the launch of the State of the Environment Report.
- Nunoo EK (2007) Towards implementing EMS in enterprises: A case study in the tourism industry. Forum der Forschung 21: 125-130.
Open Access Journals
- Aquaculture & Veterinary Science
- Chemistry & Chemical Sciences
- Clinical Sciences
- Engineering
- General Science
- Genetics & Molecular Biology
- Health Care & Nursing
- Immunology & Microbiology
- Materials Science
- Mathematics & Physics
- Medical Sciences
- Neurology & Psychiatry
- Oncology & Cancer Science
- Pharmaceutical Sciences