


 7 / 20

Aquaculture 2018
S e p t e m b e r 2 0 - 2 1 , 2 0 1 8
L i s b o n , P o r t u g a l
Page 36
Journal of
FisheriesSciences.comISSN: 1307-234X
E u r o p e a n S u mm i t o n
Aquaculture, Fisheries
and Horticulture
A
pparent declines in abundance of mangrove crabs
Scylla spp
. in the coastal area of Bangladesh have prompted concern
regarding long-term determination of this important cultural and economic resource. From the survey of ten districts of
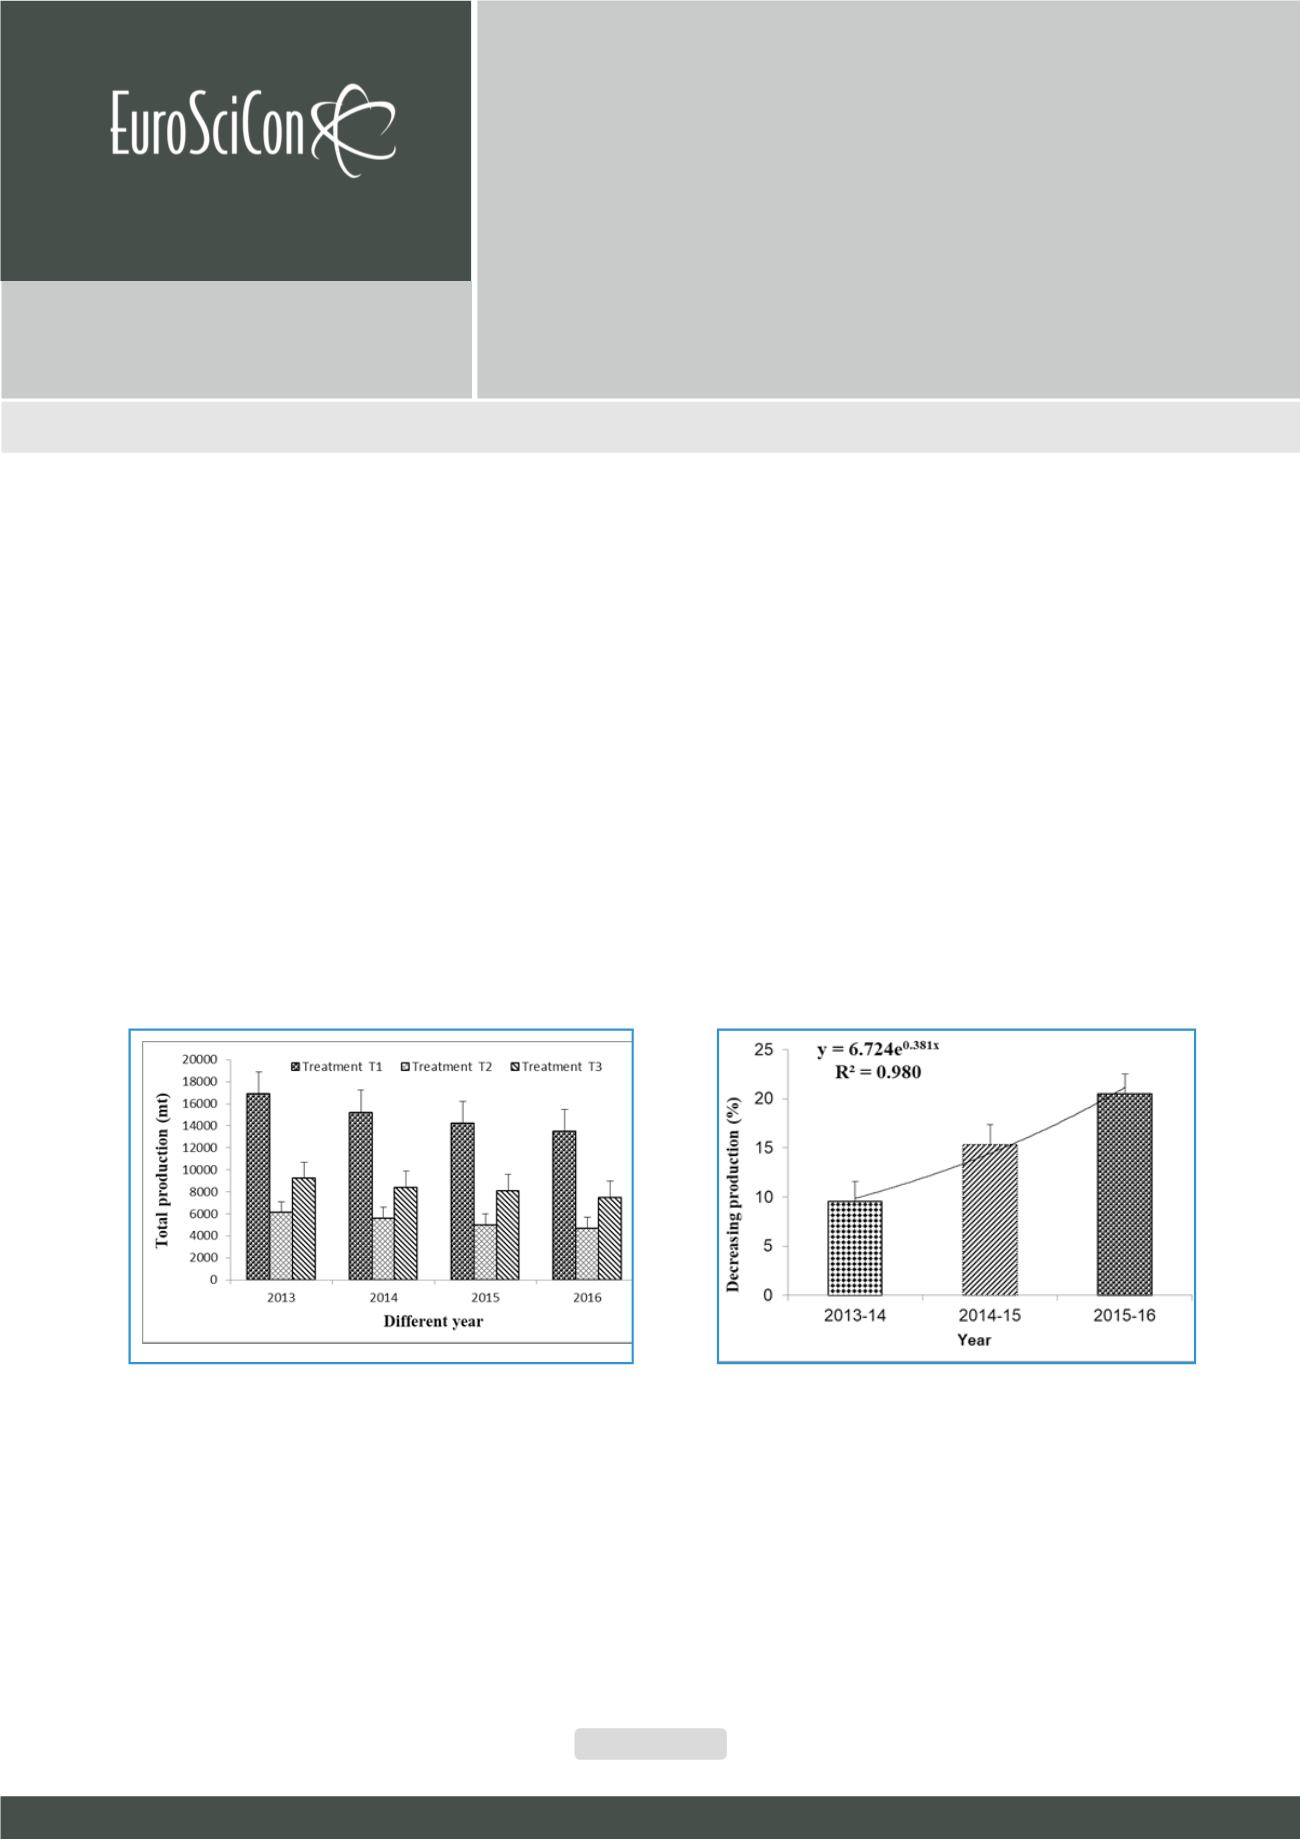
coastal area according to treatment T1, T2 and T3 the total production of the coastal area was decreased from 32255.06±178.18
mt to 25643.46±141.96 mt between 2013 and 2016 and the percentage of the total production of the experimental area was
declined 9.55, 15.36 and 20.50% within the year 2013-14, 2014-15 and 2015-16. The decreasing trends or regression type was
exponential and the equation was y = 6.724e0.81×; where R2 is 0.980. There is a significant trends in case of male, female and
immature mud crab of coastal area. In case of female mud crab total catch percentage was decreased from 43.11% to 27.95%
between 2013 to 2016. In case of male and immature mud crab total catch percentage was increased from 29.08% to 38.34%
and 27.81% to 33.71% between 2013 and 2016. Rising pressure of trap, line and catch by hand, and decreasing pressure of catch
by net was detected to catch mud crab in the experimental area. So, eco-friendly catch and juvenile culture of mud crab is to be
practiced until established mud crab hatchery to minimize the requirement of seed production of crab in aquaculture crab field.
bborty@gmail.comPresent status of mud crab population in Bangladesh
Binay Kumar Chakraborty, Azad S A and Sarker S
Department of Fisheries, Bangladesh
Journal of
FisheriesSciences.comVolume:12
DOI: 10.21767/1307-234X-C1-003
Fig.1.
Catch composition of mud crab population between
2013 and 2016 in ten districts under treatment T1, T2 and T3
Fig.2
. Decreasing catch percentage (%) of mud crabs
between 2013 and 2016. Number of replicates for each sub-
strate; crab collector n=169, crab fattener n=169 and Upazilla
office n=36