Key words
Artificial neural networks, Energy consumption, wheat production, Iran
Introduction
Agriculture is both a producer and consumer of energy. It uses large quantities of locally available non-commercial
energy, such as seed, manure and animate energy, as well as commercial energies, directly and indirectly, in the
form of diesel, electricity, fertilizer, plant protection, chemicals, irrigation water, machinery etc. [11]. Efficient use
of energy in agriculture is one of the principal requirements for sustainable agricultural production. Improving
energy use efficiency is becoming increasingly important for combating rising energy costs, depletion of natural
resources and environmental deterioration [6]. The development of energy efficient agricultural systems with low
input energy compared to the output of food can reduce the greenhouse gas emissions from agricultural production
systems [5]. The energy input–output analysis is usually made to determine the energy efficiency and environmental
aspects. This analysis will determine how efficient the energy is used. Sensitivity analysis quantifies the sensitivity
of a model's state variables to the parameters defining the model. It refers to changes in the response of each of the
state variables which result from small changes in the parameter values. Sensitivity analysis is valuable because it
identifies those parameters which have most influence on the response of the model. It is also an essential
prerequisite to any parameter optimization exercise [4,23]. In recent years, many researchers have investigated the
energy use for agricultural crop production. Taki et al [26] studied the energy use patterns of cucumber production
in Iran and found that the fertilizer application have the highest energy source in total inputs. Bahrami et al [3]
studied the productive efficiency for wheat production in Iran by means of data envelopment analysis (DEA). An advantage of DEA is so that it does not require any prior assumptions on the underlying functional relationships
between inputs and outputs. It is therefore a nonparametric approach. Mohammadi et al [13] used data envelopment
analysis to analyze the energy efficiency for kiwifruit production in Iran. Results showed that 12.17% of input
energy could be saved if the farmer follows the results recommended by this study. During the past 15 years there
has been a substantial increase in the interest on artificial neural networks. The ANNs are good for some tasks while
lacking in some others. Specifically, they are good for tasks involving incomplete data sets, fuzzy or incomplete
information, and for highly complex and ill-defined problems, where humans usually decide on an intuitional basis.
They can learn from examples, and are able to deal with non-linear problems. Furthermore, they exhibit robustness
and fault tolerances. The tasks that ANNs cannot handle effectively are those requiring high accuracy and precision,
as in logic and arithmetic. ANNs have been applied in a number of application areas. ANN has been successfully
used in prediction of drying kinetics of seeds, vegetables, and fruits food process parameters [16]. For example,
Erenturk and Erenturk [7] compared the use of genetic algorithm and ANN approaches to study the drying of
carrots. They demonstrated that the proposed neural network model not only minimized the R2 of the predicted
results but also removed the predictive dependency on the mathematical models (Newton, Page, modified Page,
Henderson-Pabis). Azadeh et al [1] presented an integrated genetic algorithm and ANN to estimate and predict
electricity demand. The economic indicators were price, value added, and number of customers and consumption in
the previous periods. Azadeh et al [1] also presented an ANN approach for annual electricity consumption in high
energy consumption of industrial sectors based on a supervised multilayer perceptron (MLP). Rahman and Bala
[22], employed ANNs to estimate jute production in Bangladesh. In this study an ANN model with six input
variables including Julian day, solar radiation, maximum temperature, minimum temperature, rainfall, and type of
biomass was applied to predict the desired variable (plant dry matter). Zangeneh et al [29] compared results of the
application of parametric model and ANNs for assessing various economical indices (economical productivity, total
costs of production and benefit to cost ratio) of potato crop in Hamadan province of Iran. Pahlavan et al [19]
developed the various artificial neural networks models to estimate the production yield of greenhouse basil in Iran.
Results showed, the ANN model having 7-20-20-1 topology can predict the yield value with higher accuracy.
Based on the literature, there has been no study on modeling wheat production with respect to input energies using
ANNs. Thus, this study was devoted to the use of ANN models as an alternative approach for predicting output
energy for wheat production in Gorve city, Kordestan province of Iran.
Materials and Methods
This study was conducted in order to determine the amount of energy consumption for wheat production and
optimize energy consumption for wheat in Gorve city in Kordestan province of Iran. The data was collected from 40
wheat growing farmers. For collecting the proper data covering the energy consumption pattern, appropriate
questionnaires was designed and completed through face to face interviews. To obtain farmers sample volume
Cochran formula is used [14]:
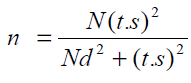 (1)
(1)
n = sample volume
N = population size
T = acceptable reliability which is obtained from T-student table (desired adjective is assumed normal).
S2 = estimation variance of the trait studied
d = desired probable accuracy
An experimental survey is done in a small scale to obtain probable errors and to estimate approximate trait studied;
as the above parameters initially have no determined trait variance. Initial sampling data was analyzed, and then data
related to trait studied from the population was obtained approximately. Eventually, determined above parameters
were put in the Cochran formula to obtain main sample volume. Thus, sample volume for 40 farmers of Gorve city
was obtained.
To estimate the amount of energy used to produce field crops, it is necessary to determine energy equivalents for
machinery manufacturing, depreciation, fuel consumption for operations, irrigation, labor, fertilizer, agricultural
pesticides and seed, and their shares should be specified in total energy inputs. As matter of fact, the condition of
field operations in different stages from tillage up to harvesting should be specified. The amounts of input were
calculated per hectare and then, these input data were multiplied with the coefficient of energy equivalent. The
previous studies were used to determine the energy equivalents coefficients. These sources are given in Table 1.
Table 1: Energy equivalent of inputs and output in agricultural production
The basis of ANN modeling methods is biological neuron activities. Neurons in the brain learn to respond to a
situation from a collection of examples represented by inputs and outputs. Scientists have tried to mimic the
operation of the human brain to solve various problems by using mathematical methods. They have found, and used,
various networks to solve practical problems. Neural networks include a wide range of mathematical methods and
artificial neural networks (ANN), the commonly used term to differentiate them from biological neural networks,
have become one of the most important modeling method that have been used more than other modeling methods
for complex input-output dependencies[18].
In an ANN, neurons are grouped in layers. In complex problems more than one layer is necessary; these neural
networks are called multilayer neural networks whose most prominent representative is the multilayer perceptron
(MLP). The layers between the input layer and output layers are called hidden layers; signals are sent from input
layers through hidden layers to the output layer. In some networks, the output of neurons is feed back to the same or
previous layers. In most studies, a feed-forward Multi-Layered Perception (MLP) paradigm trained by a gradient
descent learning method is used. Due to its documented ability to model any function, a MLP has been selected to
develop apparatus, processes, and product prediction models more than other feed-forward networks [9]. Each
neuron in an MLP is connected to other neurons in a previous layer and the next layer through adaptable weights (w)
which are the parameters of a network. Initially the values of these weights are set randomly. The networks use
different learning methods to adjust these connection weights during the learning process. In the processing of inputs
by the network, the signals (inputs) from a preceding layer are multiplied by the weights of their corresponding
connections. Each neuron in the first layer (hidden layer) processes the weighted inputs through a transfer function
to produce its output. The transfer functions may be a linear or a non-linear function. There are several transfer
functions, such as Logistic, Hyperbolic tangent, Gussian, and Sine. The output depends on the particular transfer
function used. This output is then sent to the neurons in the next layer through weighted connections and these
neurons complete their outputs by processing the sum of weighted inputs through their transfer functions. When this
layer is the output layer, neuron output is the predicted output. In general, the dataset is randomly divided into
training and validation sets. Training data is used during training when the weights are adjusted. Validation set is
used for testing the generalization ability of the trained model on previously unseen data. The data consist of a set of
inputs selected for representing a problem (input vector) and the corresponding output, an input vector Together
with the corresponding output make a training vector [24].
MLPs are normally trained with Back Propagation (BP) algorithm. It is a general method to solving for weights and
biases. The knowledge obtained during the training phase is not stored as equations or in a knowledge base but is
distributed throughout the network in the form of connection weights between neurons. BP uses a Gradient Descent
(GD) technique that is very stable when a small learning rate is used but has slow convergence properties. Several
methods for speeding up BPs have been used, including adding a momentum term or using a variable learning rate.
GD with a momentum (GDM) algorithm that is an improvement to the straight GD rule in the sense that a
momentum term is used to avoide local minima, speeding up learning and stabilizing convergence, is used [19]
Multiple layers of neurons with non-linear transfer functions allow the network to learn nonlinear and linear
relationships between input and output parameters. Several MLP network architectures with one, two, three and four
hidden layers have been trained and evaluated aiming at finding the one that could result in the best overall
performance. In this work, the learning rules of Gradient Descent Momentum (GDM) and Levenberg-Marquardt
(LM) were considered. No transfer function for the first layer was used. For the hidden layers the sigmoid functions
were used, and for the output layer a linear transfer function was applied as desired for estimating problems.
A program was developed in Neuro Solutions 5.07 package [15], for the feed forward and back propagation network
A ‘N-fold cross validation’ method was used that in this method data are randomly divided into two sets; training set
(70% of all data) and cross validation set (the remaining 30% of all data) [19]. The neural network model is formed
for output energy (Grain + straw) by using seven inputs.
Two statistical parameters were used for performance analysis. Mean square errors (MSE) and coefficient of
determination (R2) were computed to estimate the overall model performance. These are defined as:
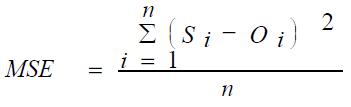 (2)
(2)
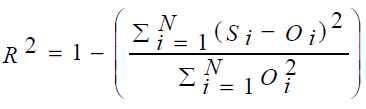 (3)
(3)
Where i=1–N; N is the number of observations; Si is the simulated values; Oi is the observed values [22].
Results and Discussion
As it can be seen in the Table 2, 77.97 kg nitrogen, 34.98 kg Phosphate, 9.99 kg Calcium, 4587.50 kg of farm
fertilizer, 72.95 l diesel fuel, 2.25 kg Biocides, 260.75 kg seed, 98.47 h human labor, 21.64 h machinery, 2190.77
Kwh electrical energy per hectare are used for the production of wheat in Gorve country in Iran. The average wheat
output were found to be 7325 kg ha-1 in the enterprises that were analyzed. The energy equivalent of this is
calculated as 97935.63MJha-1. The highest energy input is provided by electrical. Some results have been reported in
the literature that the energy input of chemical fertilizers has the biggest share of the total energy input in
agricultural production [12,27].
Table 2: Amounts of inputs, outputs and energy inputs and output in wheat production
In this research, various ANNs were designed and trained as one and two layers to find an optimal model prediction
for the wheat output energy. For this purpose, Back propagation algorithm was chosen to build the prediction
models. The results obtained from the 24 models and their characteristics are showed in Table 3. As indicated in Table 3, among the trained networks, the (7-6-6-1)-MLP, namely, a network having seven input variables, six
neurons in the first and second hidden layer, and single output variable resulted in the best-suited model estimating
the wheat output energy. For this topology, MSE and R2 were 0.003 and 94%, respectively.
Table 3: ANN models of wheat output energy prediction for different arrangement
According to results of table 3, after (7-6-6-1)-MLP the most reliable models were: (7-9-1)-MLP model and (7-7-1)-
MLP model respectively. R2 and MSE for these models were: 92, 0.009 and 89, 0.014, respectively.
According to the obtained results in Figure 1, the share of each input item of developed MLP model on desired output
(output energy) can be seen clearly. Sensitivity analysis provides insight into the usefulness of individual variables.
With this kind of analysis it is possible to judge what parameters are the most significant and the least significant
during generation of the satisfactory MLP [29]. It is evident that total fertilizer has the highest sensitivity on output
(22%), followed by diesel fuel (21%). Also, the sensitivity of seed was relatively low. Pahlavan et al [19], reported
that the chemical fertilizer energy had the highest sensitivity on output (basil production), followed by FYM (farm
yard manure), diesel fuel and chemical poisons. Also, the sensitivity of electricity, human power and transportation
energies were relatively low.
Figure 1: Sensitivity analysis of various input energies on dry wheat output energy
Conclusion
This paper shows the valuable application of Multilayer Feed Forward Network in modeling the input energies use
in the wheat production in Gorve city in Kordestan province of Iran. Based on the results of this paper it can be
stated that:
1. Wheat production consumed a total of 42998.44MJ ha–1, and electricity has the highest share by 26135.93MJ ha–1.
Output energy was 97935.63MJ ha–1. Management is a key factor to reduce energy use for agricultural production.
Improving efficiency and using new methods and technologies can significantly enhance energy conservation on
farms.
2. The (7-6-6-1)-MLP, namely, a network having seven input variables (Human labor, machinery, diesel fuel,
chemical fertilizer, Biocides, Electricity and seed), six neurons in the first and second hidden layer, and single output
variable (output energy) resulted in the best-suited model estimating the output energy for wheat production. For this
topology, MSE and R2 were 0.003 and 94%, respectively.
3. With regard to results of this research, it is suggested to use the same methodology to develop models for
prediction of fuel consumption, CO2 emission, input energy consumption and output yield for other agricultural
production. It is possible to use the same database collected in this study for these investigations.
References
- Azadeh, A., S.F. Ghaderi and S. Sohrabkhani. Energ Convers Manage. 2008. 49: 2272–2278.
- Azadeh, A., S.F. Ghaderi, S. Tariverdian and M. Saberi. Appl Math Comput. 2007.186: 1731–1741.
- Bahrami, H., M. Taki and N. Monjezi. African Journal of Agricultural Research. 2011. 6(27): 5978-5986.
- Cbalabi, Z.S. and B.J. Bailey. Agric For Meteorol. 1991. 56: 111–127.
- Dalgaard, T., N. Halberg and J.R. Porter. Agric Ecosyst Environ. 2001. 87: 51–65.
- Dovì, V.G., F. Friedler, D. Huisingh and J.J. Klemes. Journal of Cleaner Production. 2009. 17: 889–895.
- Erenturk, S. and K. Erenturk. Journal of Food Engineering. 2006. 78: 905–912.
- Heidari MD, Omid M, Mohammadi A. Expert Systems with Applications. 2011. 39: 1040-1045.
- Kalogirou, S.A. Renewable and Sustainable Energy Reviews. 2001. 5: 373-401.
- Kizilaslan H. Applied Energy. 2009. 86: 1354–8.
- Lianga, Q.M., Y. Fana and Y.M. Wei. Energy Policy. 2007. 35: 1685–1700.
- Mobtaker HG, Keyhani A, Mohammadi A, Rafiee S.H Akram A. Agriculture, Ecosystem and Environment. 2010. 137: 367–372.
- Mohammadi, A., S. Rafiee, S.S. Mohtasebi, S.H. Mousavi Avval and H. Rafiee. Renewable Energy. 2011. 36: 2573-2579.
- Mousavi–Avval, S.H., S. Rafiee and A. Mohammadi. Energy. 2011. 36: 909–916.
- Omid, M., A. Baharlooei and H. Ahmadi. Drying Technology. 2009. 27(10): 1069-1077.
- Pachepsky, Y.A., D. Timlin and G. Varallyay. Soil Science Society of America. 1996. 60: 727-33.
- Pahlavan, R., M. Omid and A. Akram. Energy. 2012. 37: 171-176.
- Pimentel D. 1980. Handbook of Energy Utilization in Agriculture. CRC Press, Boca Raton, FL.
- Rahman, M.M. and B.K. Bala. Biosystem Engineering. 2010. 105: 350-356.
- Richter, G.M., M. Acutis, P. Trevisiol, K. Latir and R. Confalonieri. Eur J Agron. 2010. 32: 127–136.
- Safa, M. and S. Samarasinghe. Energy. 2011. 36: 5140-5147.
- Tabatabaeefar A, Emamzadeh H, Ghasemi Varnamkhasti M, Rahimizadeh R, Karimi M. Energy. 2009. 34: 41–45.
- Taki M, Ajabshirchi Y, Mahmoudi A. Modern Applied Science. 2012b. 6(1): 75-87.
- Taki, M., Y. Ajabshirchi and A. Mahmoudi. Modern Applied Science. 2012a. 6(1): 75-87.
- Zangeneh, M., M. Omid and A. Akram. Span J Agric Res. 2011. 9(3): 661-71.
- Zangeneh, M., M. Omid and A. Akram. African Journal of Agricultural Research. 2010. 5(10): 993-998.


