Keywords
Zinc oxide; Pneumatic spray pyrolysis; Carbon doping; Raman spectroscopy
Introduction
Zinc oxide (ZnO) presents fascinating material system for investigation due to its wide band gap (Eg=3.37 eV in 300 K) material with a high exciton binding energy (60 meV) [1]. Moreover ZnO is a versatile II-VI semiconductor material with a number of applications including field effect transistors, gas sensors, piezoelectric devices and solar cells [2-5]. Hitherto, their versatile application has motivated a great deal of research on synthesis and investigation of properties of ZnO nanomaterials [2-5]. In particular modified and un-modified ZnO NPs are expected to become function and integration of nanostructure assembly for dye sensitized solar cells electrodes and nanoscale devices [6,7]. As a crucial advantage, synthesis of ZnO is more cost effective than other various alternative semiconductors such as III-V semiconductors [8]. Its low price compared with other wide band semiconductor nanomaterials makes it a good candidate for industrial applications. ZnO exhibits a number of properties that depend on doping including conductivity from metallic to insulting, high transparency, piezoelectricity, wide band gap semiconductivity, room temperature ferromagnetism, huge magneto-optic, and chemical sensing effects [3,5,7]. In the face of its practical prominence, current knowledge of structural, morphological and phonon vibrational properties of doped ZnO nanostructures is rather inadequate. Understanding the specifics of phonon spectrum of ZnO NPs can prove to be pivotal in the development of DSSC employing doped ZnO NPs and nanoscale devices [7]. However most straightforward aspects of doped ZnO nanomaterials are not well studied and the lack of information inhibits further progress. Doping with non-metal elements such as C, S and N has been widely used in literature to improve the structural, morphological and vibrational properties of ZnO. More specifically doping non-metal elements reduces the band gap of wide band semiconductors [9-13]. It has been reported in literature that doping with either N or C enhances a number of properties but not limited to ferromagnetism, magnets to transport properties and p type conduction properties [14-16]. There are a number of methods commonly used for preparation ZnO NPs ranging from wet chemistry methods [9,12] to solid phase systems [10]. However solid phase systems for preparation of ZnO NPs outperforms wet chemistry methods because of their simplicity and high yield. Paralleled with solid based methods solution based methods present several challenges in reproducibility, purification and extraction of the nanomaterials prior use. Hence solution methods are not desirable for industrial scaling. Amongst the solid based methods such as laser ablation [14], sputtering coating [14], Frequency Electron Tube Sputtering (RFMS) [15], aerosol assisted chemical vapor deposition [16], spin coating [17] and Spray pyrolysis (SP) [18]. Spray pyrolysis methods present a modest and less expensive of fabricating a number of nanomaterials. Specifically, SP systems that employ a pneumatic nebulizer/pump technique is a very easy, safe and non-vacuum system and low-cost way of producing ZnO NPs. Moreover SP methods provide a relatively simple way to introduce non-metal dopants at ratio required through the proportions of the precursor solutions. Compelled by the aforesaid encouragements, in this paper we aim to understand the effect of carbon doping on the structural, morphological and Raman scattering properties of C-ZnO NPs synthesized by a pneumatic spray pyrolysis technique. The as prepared samples were exposed to a series of structural, morphological and optical evaluation. The results obtained are presented in work.
Materials and Methods
Sample preparation procedure
In typical synthesis procedure 0.1 M of zinc precursor solution was prepared by dissolving 5.4923 g Zn(O2CH3)2 in a 250-ml volumetric flask, containing minimum amount of ethanol (99.99% sigma Aldrich). A few drops of acetic acid (CH3COOH) were added to the volumetric flask containing zinc ethoxide (Zn(O2CH3)2). The Zn(O2CH3)2 solution was sonicated on an ultrasonicator at 40°C for 30 minutes. 3.10 ml of tetrabutylammonium bromide (TBA) (C16H36BrN) was added to the resulting colourless solution of Zn(O2CH3)2. The 250-ml volumetric flask containing Zn(O2CH3)2 and (C16H36BrN) was topped up to the mark with absolute ethanol. Other precursor solutions containing different level of the carbon dopant (C16H36BrN) were prepared in much the same way as presented here in Table 1.
| Sample # |
Mass of Zn(O2CH3)2 (g) |
Volume of TBA (ml) |
| Un-doped |
5.4923 |
0 |
| 0.01 TBAC-ZnO |
5.4925 |
1.55 |
| 0.02 TBAC-ZnO |
5.4921 |
3.1 |
| 0.025 TBAC-ZnO |
5.4924 |
3.88 |
Table 1: Preparation un-doped and C-ZnO precursorâ€Âââ€Å¾Â¢s solutions.
The precursor solution was then decanted into a chamber connected to a pneumatic pump prior to spray deposition. F: SnO2 transparent glass substrates were first washed with detergent then thoroughly rinsed with distilled water, isopropanol, distilled water and finally acetone. The glass substrates were then dried under hot air to evaporate the acetone. Deposition of un-doped and C-ZnO NPs was done on F: SnO2 glass substrate at a deposition temperature of 400°C.
Sample characterization procedure
To obtain the crystallographic phase and associated parameters of ZnO samples of the synthesized NPs, XRD spectra were obtained using a Bruker D8 Advance X-Ray diffractometer (XRD) with a Cu anode, generating K? radiation of wavelength 1.544 Å and operating at 40 kV and 40 mA. XRD θ-2θ patterns of ZnO nano-powders synthesized by PSP were recorded in the 2θ range of 30°C-100°C at room temperature. Field Emission Scanning Electron Microscope (FE-SEM) Zeiss Auriga SEM equipped with EDS with Smart SEM software was used to study the elemental, structural and morphological properties of ZnO nanostructures at an accelerating voltage of 30 KV. In order to determine the finer details relating to structural properties of un-doped and C-ZnO samples were obtained using a JEOL JEM 2100 High Resolution Transmission Electron Microscope operating at 200 KV for high resolution images with selected area electron diffraction (SAED) patterns. Raman spectra of the ZnO samples was done using a Confocal RAMAN Imaging system (WITec GmbH, Ulm, Germany) alpha300RS. A fiber coupled DPSS laser 532 nm with maximum output power after single mode fiber coupling of 44 mW was used as the excitation source. Data was then collected using a multimode fiber into a high throughput lens based spectrograph (UHTS 300) with 300 mm focal length and two gratings 600 g/mm and 1800 g/mm, both blazed at 550 nm. The UHTS 300 spectrograph is connected with a peltier cooled back illuminated CCD camera with better than 90% QE in the visible excitation. Each spectrum was acquired at an integration time of 1.09667s and about 200 accumulations were collected per each spectrum in the scan range 100 cm-1-1100 cm-1.
Results and Discussion
SEM-EDX analysis
The surface morphology of ZnO NPs. SEM analysis has revealed the presence of spherical ZnO NPs.
Figure 1a shows the SEM micrographs of the un-doped ZnO NPs shows the presence of spherical NPs with un-even grain size distribution. The un-doped ZnO NPs consist of a mesoporous morphology with a multiple porous network structure. Introduction of carbon. Figure 1b shows that the 0.01 M C-ZnO NPs is also still mesoporous with un-even grain size distribution. However the introduction of carbon resulted in agglomeration of NPs this is clearly evidence by formation of large spherical NPs surrounded by small NPs. Also, a noteworthy feature with the increase carbon dopant concentration (Figures 1c and 1d) resulted in loss of the mesoporous morphology with multiple porous network structure and led to formation of dense well packed structure. This suggest that the introduction of carbon catalyzes the rate of NPs agglomeration. From the aforementioned discussions, it is therefore safe to conclude that the morphologies of asprepared ZnO powders depends markedly on the concentration of the carbon dopant. Composition and impurity contamination of as the PSP fabricated ZnO NPs was examined using energy dispersive X-ray (EDX) spectroscopy using a scanning electron microscope (SEM). Inserts in Figure1d shows the EDX spectra of all the ZnO samples. The presence of Zn, O and C in the EDX spectra confirms the successful pyrolysis of precursor to form ZnO NPs. Additionally all spectra revealed a peak of Al which due to the aluminium substrate holder used in the study for collection of ZnO NPs.
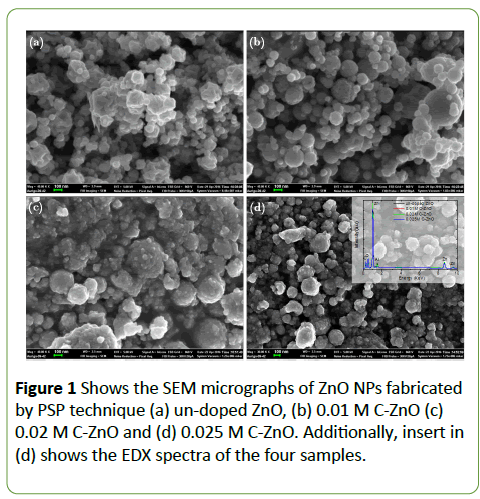
Figure 1: Shows the SEM micrographs of ZnO NPs fabricated by PSP technique (a) un-doped ZnO, (b) 0.01 M C-ZnO (c) 0.02 M C-ZnO and (d) 0.025 M C-ZnO. Additionally, insert in (d) shows the EDX spectra of the four samples.
HRTEM analysis
Investigation of structural properties of ZnO in this study was also performed with HRTEM. Figure 2 shows the HRTEM images of un-doped and 0.01 M C-ZnO NPs. Figures 2a and 2b clearly confirms the presence spherical un-doped and 0.01 M ZnO NPs with particles sizes of 7.1 nm-8.71 nm and 9.4 nm-10 nm respectively. HRTEM images of un-doped and C-ZnO NPs shown here in Figures 2a-2d clearly show crystal planes of ZnO. The observed lattice plane fringes of the ZnO samples were used to calculate the d-spacing values and the results obtained were compared with those of bulk ZnO summarized here in Table 2.
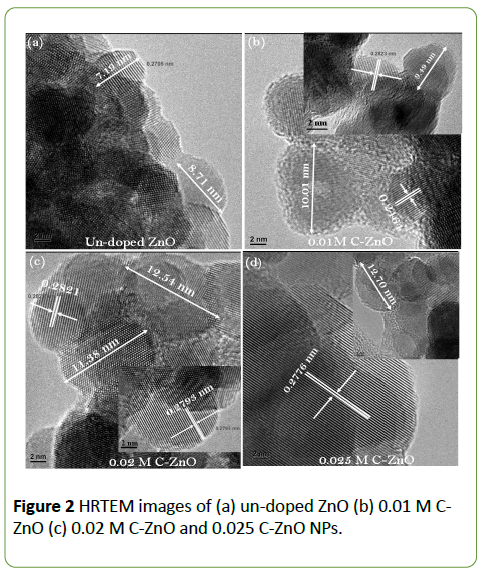
Figure 2: HRTEM images of (a) un-doped ZnO (b) 0.01 M CZnO (c) 0.02 M C-ZnO and 0.025 C-ZnO NPs.
| Sample |
Inter planner d-spacing |
d-spacing in bulk ZnO (nm) |
Miller indices (hkl) assignment |
| Un-doped ZnO |
0.2705 |
0.2796 |
100 |
| 0.01 M C-ZnO |
0.2823 |
0.2813 |
100 |
| 0.2464 |
0.2462 |
101 |
| 0.02 M C-ZnO |
0.2821 |
0.2813 |
100 |
| 0.025 M C-ZnO |
˜0.2776 |
0.2813 |
100 |
Table 2 : The inter-planar spacing and diffraction planes of un-doped and C-ZnO NPs synthesized by a pneumatic spray pyrolysis technique.
The lattice spacing’s for the un-doped and 0.01 M C-ZnO nanoparticles are shown here in Figures 2a and 2b. HRTEM analysis has revealed lattice spacing of 0.2705 nm for the undoped ZnO sample which corresponds to the lattice plane of (100) of hexagonal Wurtzite which has a lattice spacing of 0.2796 nm [19]. Moreover, HRTEM analysis has revealed lattice spacings of 0.2823 nm and 0.2464 nm for the 0.01 M C-ZnO NPs which are in close agreement to the lattice spacing’s of 0.2813 nm and 0.2462 nm for bulk ZnO which corresponds to the lattice plane of (100) and (101) of hexagonal Wurtzite ZnO structure. Figures 2c and 2d present the HRTEM images of the 0.02 M C-ZnO and 0.025 M C-ZnO NPs. HRTEM analysis has revealed that the as synthesized samples are also spherical with NPs with particle sizes range of 11.3 nm-12.5 nm and 8.9 nm-12.27 nm. Additionally HRTEM analysis has revealed lattice spacing of 0.2821 and 0.2776 nm which is close to lattice spacing of 0.2821 nm of the (100) lattice plane of Bulk ZnO. However all the lattice parameters of the spray pyrolysis synthesized ZnO NPs remained the same, as all inter-planar spacing’s determined through HR-TEM images correspond to the planes of Wurtzite. Hence doping with a non-metal element like carbon does not distort the Wurtzite ZnO structure.
Raman spectroscopy analysis
In order to investigate the effect of carbon doping in the structural properties of C doped ZnO NPs we employed Raman spectroscopy was used to investigate the change in the vibrational modes of C-ZnO NPs. It has been reported that Raman spectra of ZnO nanostructures is sensitive. Hence it shows shift of the bulk phonon frequencies [20]. The shift in Raman spectra can arise due to structural disorder, defects (oxygen deficiency, surface impurities) and phono confinement [20]. In order to cross examine the vibrational properties of C-ZnO NPs and effect of carbon doping on structure, phase and other related parameters Raman spectroscopy of un-doped and C-ZnO was measured. Theoretically ZnO has a Wurtzite structure, which belongs to the space groupC_6v^4, with two formula units per primitive cell where all atoms occupying the 2b sites of the symmetry C3v [19-21]. For a perfect ZnO crystal, only the optical phonons at Γ point group of the Brillouin zone are involved in the first order Raman scattering [21]. Zone centre optical phonons predicts the existence of the following modes: Γopt=A1+2B1+E1+2E2 [13]. The, A1 and E1 modes are polar. The polar modes are split further into transverse optical (A1 TO and E1TO) and longitudinal optical (A1 TO and E1TO) components. E2 mode consist of two modes of low and high of frequency phonons (E2 low and E2 high) [22]. The E2low is related with the vibration of heavy Zn sublattice, whereas the E2high mode is related with vibration of oxygen atoms only. Additional to the first Raman modes identified above there are also second order Raman vibrational modes. Characteristic of second order Raman modes are the B1 which is silent. The B1lowand B1high modes have vibrational frequencies at 260 cm-1 and 540 cm-1 respectively [23,24]. Moreover ZnO has also in addition to the first and second multi-phonon modes found in ZnO. Table 3 summarizes the list of the frequency and symmetry first, second and multi-phonon modes found in ZnO nanostructure from various literature sources. For the sake of comparison. Table 3 also presents the experimental values of Raman vibrational frequencies and symmetry compiled from various literature sources.
| Character and Symmetry/ Frequency |
Experimental frequencies ZnO nanostructures |
| Variables |
Bulk (cm-1) |
Films (cm-1) |
ZnO crystals (cm-1) |
Polished Crystals |
| E2low |
101 |
99 |
99 |
101 |
| E2high |
437 |
440 |
439 |
437 |
| A1(TO) |
375 |
380 |
382 |
380 |
| E1(TO) |
405 |
414 |
413 |
408 |
| A1(LO) |
574 |
- |
579 |
574 |
| E1(LO) |
578 |
583 |
591 |
584 |
| Frequency of the fundamental multi-phonon modes in ZnO found in literature |
| 208 cm-1 |
| 330, 334 cm-1 |
| E2H-E2L |
| broad, from 540-670 cm-1, |
| broad, from 540-670 cm-1, |
| 986 cm-1 |
| Broad starts at 1050 cm-1, peaks at 1084 and 1149 cm |
Table 3 : Frequency and symmetry of the fundamental theoretical modes in bulk ZnO and experimental values compiled from various literature sources.
Raman spectra for all samples is shown here in Figure 1. Table 3 shows the peaks positions and symmetry of the identified peaks. The Raman spectra of the un-doped ZnO samples shows the B1low broad peak at 297.30 cm-1. This mode normally exist in ZnO samples with lattice defects caused by the presence of impurities of either of dopant nature or due to growth conditions [22]. The B1low mode has been observed in un-doped ZnO films grown by RF sputtering which was attributed to disorder-activated Raman scattering [22,23]. Hence we can speculate that this mode in our samples is due to the presence of defects due to growth conditions. Surprisingly we did not observe the B1 low mode in our C-ZnO samples (Figure 3).
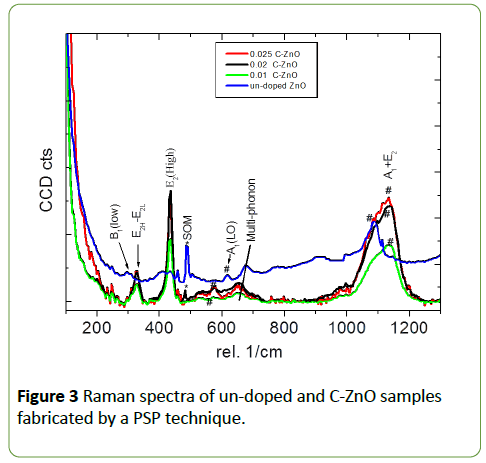
Figure 3: Raman spectra of un-doped and C-ZnO samples fabricated by a PSP technique.
The Raman spectra of C-ZnO samples shows the existence of E2H-E2L multi-phonon mode at the same time this multiphonon mode does not exist in the Raman spectra of undoped ZnO samples. The E2H-E2L multi-phonon mode commonly observed at 330 cm-1 or 334 cm-1 for bulk ZnO samples [20-22] was red shifted to lower frequencies and was observed for the C-ZnO samples at 325.80 cm-1, 326.3 cm-1, and 325.9 cm-1 for 0.01M C-ZnO, 0.02 M C-ZnO and 0.025 M C-ZnO NPs respectively. Since the carbon atom is substituting the Oxygen atom in ZnO lattice because of the smaller mass of C as compared we expected the E2H-E2L multi-phonon to be shifted to be higher wavenumbers. Hence, we can speculate that the red shift in our Raman spectra is might be due particle size decrease. Might also be due to scattering energy loss of the two phonon process due to carbon doping. Notably from the Raman spectra samples we observed a characteristic Raman vibration mode of the dominate E2(high) of Wurtzite ZnO at 438.63 cm-1 commonly observed for bulk ZnO samples at 437 cm-1 [22] which was blue shifted to higher frequencies for the un-doped ZnO sample as illustrated here in Figure 4a. Figure 4 shows carbon dopant concentration dependence of Raman peak shift, full width at half Maximum (FWHM), and peak intensity of the E2(high) mode of Wurtzite ZnO samples synthesized by PSP technique. It is clearly evident from Figure 4 that the vibrational frequency, Full width at Half Maximum (FHWH) and Intensity are strongly dependent on the concertation carbon dopant.
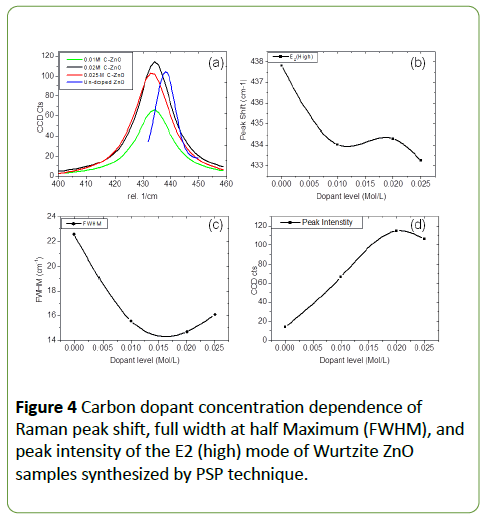
Figure 4: Carbon dopant concentration dependence of Raman peak shift, full width at half Maximum (FWHM), and peak intensity of the E2 (high) mode of Wurtzite ZnO samples synthesized by PSP technique.
It also evident from Figure 4b that vibrational frequency shifts sharply to lower frequencies in presence of carbon dopant. Our Raman spectra of C-ZnO NPs showed Raman peaks at 434.36 cm-1, 434.37 cm-1 and 433.65 cm-1 for 0.01 M, 0.02 M and 0.025 M C-ZnO respectively. Furthermore, it has also been reported that E2(high) in ZnO shows a significant change of the vibrational frequency more especially in the presence of foreign species (dopants/impurities). The presence of dopants in the ZnO lattice can cause a significant shift in the Raman vibrational frequency of the E2(high) mode. Since the vibrational frequencies of the E2(high) mode is related with vibration of oxygen atoms, substitutional doping of the oxygen atoms in ZnO lattice might change the vibrational frequencies of the C-ZnO samples. Hence we can speculate at this stage that the shift to lower frequency numbers can be correlated to the concentration of carbon. We can also conclude that the decrease in phonon frequency is due to both the presence of carbon dopants/impurities and inter molecular stress due to the presence of carbon atoms in the ZnO matrix. On the basis of these observations we conclude C doping in ZnO NPs is also evident through Raman peaks shift to lower frequencies. The dominate E2(high) mode. Figure 4c shows the carbon dopant concertation dependence of the Raman line width/ (FWHM). It is clearly evident from Figure 4c that the FWHM decrease sharply with increase in concentration of carbon. It has also been reported that an increase in FWHM causes weakening of the Wurtzite ZnO structure [12]. Hence the decrease in the FWHM with increase in carbon concentration simply implies that doping with carbon does not weaken or distort the ZnO structure. This is agreement to other experimental observations by Kumar et al. [25] were they observed increase in the FWHM with increase in the doping concentration of cobalt, this was attributed ZnO lattice distortions and hence it causes weakening of Wurtzite ZnO structure due to incorporation of metal dopant cobalt.
Our Raman analysis which have shown a decrease in the FWHM with increase in carbon concentration did not show any distortions or weakening of the Wurtzite ZnO structure. Our experimental findings are in mutual agreement with Our HRTEM analysis that have revealed a more consistent and almost the same d spacing for our C-ZnO samples. In fact, for all of our C-ZnO samples revealed a d spacing of 0.2823 nm (0.01 M) 0.2464 nm (0.01 M), 0.2821 nm (0.02 M), and 0.02776 (0.025 M) which in close agreement to the lattice spacing’s of 0.2813 nm and 0.2462 nm for bulk ZnO which corresponds to the lattice plane of (100) and (101) of hexagonal Wurtzite ZnO structure. This could be due to preferential substitution of Oxygen (O) atom with carbon (C) atom in the ZnO lattice. Since the C atom 0.26 nm with atomic radii has an almost similar size to the oxygen atom of atomic radii of 0.14 nm. Substitutional doping of O with C is not expected to cause significant lattice distortions as compared to metal dopants like cobalt or nickel with atomic radius of 0.0745 nm and 0.69 nm respectively which preferential substitute the Zn atom in the ZnO lattice. It has been previously reported that for Ni doped ZnO nanostructures that FWHM value for the E2(high) mode of less than 11 cm-1 signifies that the doped samples retained a good Wurtzite ZnO structure [26]. However for our C doped ZnO samples we observed the FWHM that was estimated to be 22.578 cm-1, 15.590 cm-1, 14.684 cm-1 and 16.098 cm-1 for the un-doped ZnO, 0.01 C-ZnO, 0.02 C-ZnO and 0.025 C-ZnO samples respectively. Our samples had line shapes greater than 11 cm-1 and still retained the perfect ZnO Wurtzite structure. Additionally we observed as shown here in Figure 4d that they is an increase in peak intensity with increase in C dopant concentration.
It has been reported that intrinsic defects (vacancies, interstitials, anti-site) as compared to extrinsic defects are less beneficial for photo-catalysis application mainly because of the extrinsic defects are located at the grain boundaries hence accessible during photo catalysis reactions [27].
In bulk ZnO the Raman mode at 680 cm-1 is associated with intrinsic defects. In our PSP fabricated samples we have observed a similar Raman at 678.62 cm-1 which is associated with intrinsic defects. However, this mode is rather red shifted which shows that they are reduction of lattice defects in our PSP fabricated samples.
Further analysis of carbon dopant concentration dependence of Raman peak shift, Full width at half maximum (FWHM), and peak intensity of Raman modes 678.62 cm-1 is shown here in Figure 5. It is clearly evident from Figures 5a and 5b that they are significant peak shift to lower wave numbers on introduction of carbon dopant This mode shifts for C doped samples to was further red shifted to 653.09 cm-1, 653.56 cm-1, and 652.47 cm-1 for 0.01M C-ZnO, 0.02M C-ZnO and 0.025 M C-ZnO NPs respectively. This simply implies that introduction of carbon decreases the presence of intrinsic defects in our ZnO samples; this is beneficial for solar cells applications. Moreover analysis of the Figure 5c shows the Raman dependence analysis FWHM on carbon doping concentration and it has revealed a general increase in the FWHM with increase in carbon dopant concentration. This increase is attributed due to substitutional carbon doping in our samples and decrease in intrinsic defects in our PSP fabricated ZnO samples. The decrease in intrinsic defects can be correlated to increase in extrinsic defects which are caused by the impurities due to carbon doping which are much more beneficial for solar cell applications. The relationship between peak intensity and carbon dopant shown here in Figure 5d shows a rather increase and decrease in peak intensity. Hence the relationships between Raman peak shifts, FWHM and peak intensity of the intrinsic mode can be also used as an indicative evidence to support substitutional carbon doping in ZnO NPs and an indication of decrease of intrinsic defects ZnO samples.
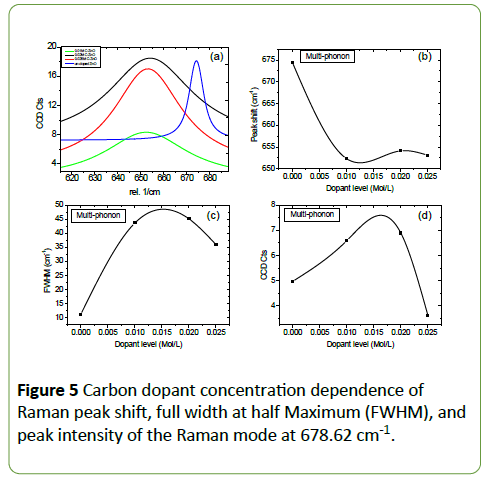
Figure 5: Carbon dopant concentration dependence of Raman peak shift, full width at half Maximum (FWHM), and peak intensity of the Raman mode at 678.62 cm-1.
Similarly, to the E2(high) mode we have observed Raman peak shifts to lower frequencies with increase in carbon dopant concentration for the A1(LO) mode at 618.68 cm-1 for the un-doped ZnO samples as illustrated here in Figures 6a and 6b. The FWHM for the A1(LO) have revealed a similar pattern to the E2(high) which increases with respective increase in carbon dopant concertation. Therefore, we can conclude that the decrease in phonon frequency of these modes accompanied by decrease in FWHM is both confirms the presence of carbon dopant (impurities) in our ZnO samples.
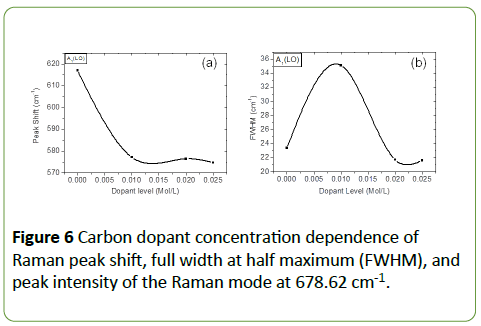
Figure 6: Carbon dopant concentration dependence of Raman peak shift, full width at half maximum (FWHM), and peak intensity of the Raman mode at 678.62 cm-1.
It has been reported that the presence of dopants in the ZnO lattice can cause a significant shift in the Raman vibrational frequency of the E2. (high) mode. According to literature reports the combination of acoustic phonons of the A1+ E2 is normally detected at about 1101 cm-1 in bulk ZnO samples [20-24] The Raman spectra of our PSP fabricated samples shows a wide peak from 1017 cm-1-1207 cm-1 which is attributed to the multi-phonon modes. Table 4 provides a summary of the Symmetry and Raman modes found in PSP fabricated un-doped ZnO and C-ZnO NPs.
| Sample |
Frequency cm-1 |
| ZnO_0 |
297.3 |
- |
438.63 |
488.1 |
618.68 |
678.62 |
1089.2 |
| ZnO_0.01 |
- |
325.81 |
434.36 |
- |
574 |
653.09 |
1133.6 |
| ZnO_0.02 |
- |
326.37 |
434.37 |
485.44 |
574 |
653.56 |
1136 |
| ZnO_0025 |
- |
325.91 |
433.65 |
- |
574.14 |
652.47 |
1129.9 |
| Symmetry and Identity |
B1Low |
E2H-E2L |
E2high |
SOM |
A1(LO) |
Multi-phonon |
A1E2 symmetry |
Table 4 : Raman vibrational frequency and of un-doped and C-ZnO NPs fabricated by PSP technique.
UV-Vis
The effect of carbon doping on the optical properties of ZnO NPs fabricated by PSP technique have been in cross examinedd using UV-Vis spectroscopy. The absorption properties were measured in the range of 300 nm-800 nm of the ZnO and CZnO NPs at different concentrations of carbon shown here in Figure 7. For the band gap of direct semiconductor, the energy band gap can be calculated using the equation: (αh)2=A(h-Eg) where α is the absorption coefficient, his the photon energy, A is the absorbance, and Eg is the energy band gap energy. Uv-Vis analysis has revealed that energy band gaps of 3.54 eV, 3.68 eV, 3.64 eV and 3.63 eV for the un-doped ZnO, 0.01 M CZnO, 0.02 M C-ZnO and 0.025 M C-ZnO NPs respectively which was somewhat large than that for bulk ZnO (3.2 eV) and this can be attributed to smaller size of NPs of the PSP fabricated samples.
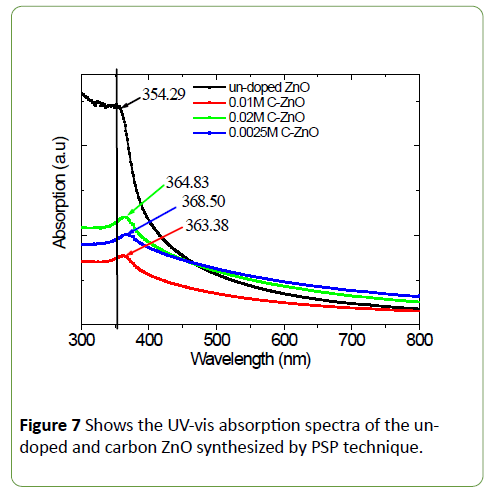
Figure 7: Shows the UV-vis absorption spectra of the undoped and carbon ZnO synthesized by PSP technique.
Conclusion
Un-doped and carbon doped ZnO nanoparticles have been fabricated by pneumatic spray pyrolysis technique using zinc ethoxide (Zn(O2CH3)2) as the precursor and tetrabutylammonium bromide (TBA) (C_16 H_36 BrN) as the carbon dopant. SEM analysis have revealed the presence of spherical NPs with un-even grain particle size distribution. Additionally SEM analysis has revealed the presence of a mesoporous morphology, with a multiple porous network structure for the un-doped and 0.01 M C-ZnO NPs. Additionally SEM analysis has revealed that increase dopant concentration above 0.01 M resulted in disappearance of a mesoporous morphology with a multiple porous network structure and led to formation of, agglomerated dense packed nanostructure. SEM-EDX analysis has revealed the presence of Zn, O and C in the EDX spectra. The morphological variation due to the presence of carbon in ZnO matrix has resulted in variance in the structural and optical properties of the ZnO nanomaterials fabricated by a pneumatic spray pyrolysis technique. HRTEM analysis has confirmed as spherical ZnO nanoparticle, and also revealed an increase in modal particle size with increase in carbon dopant concentration with modal particle sizes of 8.7 nm, 10.0 nm, 12.5 nm and 12.2 nm for the un-doped, 0.01 M C-ZnO, 0.02 M C-ZnO and 0.025 M C-ZnO NPs respectively. HRTEM analysis has revealed lattice of 0.2705 nm, 0.2823 nm, 0.2821 nm, 0.2776 nm and 0.2464 nm belonging to the (100) and (101) which all correspond to the lattice planes of hexagonal Wurtzite ZnO structure. The Raman spectra has revealed the presence of the broad peak at 297.30 cm-1, which is due lattice defects caused by to growth conditions in the Raman spectra of un-doped ZnO samples. The B1low mode disappeared in spectra of C-ZnO samples. Additionally Raman analysis has revealed the presence of E2H-E2L multi-phonon mode at the same time this multi-phonon mode does not exist in the Raman spectra of un-doped ZnO samples. The E-2H-E-2L multi-phonon mode was blue shifted to lower frequencies and was observed for the C-ZnO samples at 325.80 cm-1, 326.3 cm-1, and 325.9 cm-1 for 0.01 M C-ZnO, 0.02 M C-ZnO and 0.025 M C-ZnO NPs respectively. Moreover, we observed characteristic Raman vibration mode dominate (high) of Wurtzite ZnO which was red shifted to at 438.63 cm-1 for the un-doped ZnO samples and blue shifted to 434.36 cm-1, 434.37 cm-1 and 433.65 cm-1 for 0.01 M, 0.02 M and 0.025 M C-ZnO respectively. The red shift of E2(high) mode to lower frequency numbers can be correlated to the concentration of carbon. On the basis of these observations we conclude C doping in ZnO NPs is also evident through Raman peaks shift to lower frequencies. The dominate E2(high) mode. Additionally, the effect of C dopant of peak shift, FWHM and peak intensity has analysed in detail the A1(LO) and intrinsic mode at 678,62 cm-1 that is associated with lattice defects. We have observed a decrease in intrinsic defects with increase in carbon dopant level which can be correlated to carbon dopant concentration. Similarly to the E2(high) mode we have observed Raman peak shifts to lower frequencies with increase in carbon dopant concentration for the A1(LO) mode at 618.68 cm-1. Therefore, we can conclude that the decrease in phonon frequency of these modes accompanied by decrease in FWHM is both confirms the presence of carbon dopant (impurities) in our ZnO samples.
Acknowledgments
We are grateful for financial support from our sponsors South African National research foundation (NRF), Govani Beki Research and Development centre (GMRDC) of the University of Fort Hare and Sasol Inzalo Foundation. The authors we also like to acknowledge the DST/CSIR Nanotechnology Innovation Centre, National Centre for Nanostructured Materials, CSIR and Electron Microscope Unit, University of Cape Town for characterization of the ZnO NPs.
References
- Zhang R, Yin PG, Wang N, Guo L (2009) Photoluminescence and Raman scattering of ZnO nanorods. Solid State Sci 11: 865.
- Miccoli B, Cauda V, Bonanno A, Sanginario A, Bejtka K, et al. (2016) One-dimensional ZnO/gold junction for simultaneous and versatile multisensing measurements. Scientific Reports 6: 29763.
- Sang B, Nagoya Y, Kushiya K, Yamase O (2003) Solar energy mater. Solar Cells 75: 179.
- Kim H, Yun H, Yoon HA, Lee SW (2014) Integrating ZnO microwires with nanoscale electrodes using a suspended PMMA ribbon for studying reliable electrical and electromechanical properties. Adv Energy Mater 4: 1301973.
- Yan L, Uddin A, Wang H (2015) ZnO tetrapods: Synthesis and applications in solar cells. Nanomater Nanotechnol 5: 19.
- Katoh R, Furube A, Yoshihara T, Hara K, Fujihashi G, et al. (2004) Efficiencies of electron injection from excited N3 dye into nanocrystalline semiconductor (ZrO2, TiO2, ZnO, Nb2O5, SnO2, In2O3) films. J Phys Chem B 108: 48180-4822.
- Ogunsolu OO, Wang JC, Hanson K (2015) Inhibiting interfacial recombination events in dye-sensitized solar cells using self-assembled bilayers. ACS Appl Mater Interfaces 7: 27730.
- Yu J, Yu X (2008) Hydrothermal synthesis and photocatalytic activity of zinc oxide hollow spheres. Environ Sci Technol 42: 4902-4907.
- Macías-Sánchez JJ, Hinojosa-Reyes L, Caballero-Quintero A, Cruz WDL, Ruiz-Ruiz E, et al. (2015) Synthesis of nitrogen-doped ZnO by sol–gel method: Characterization and its application on visible photocatalytic degradation of 2,4-D and picloram herbicides. Photochem Photobiol Sci 14: 536.
- Zhang XM, Lu MY, Zhang Y, Chen LJ, Wang ZL (2009) Fabrication of a high-brightness blue-light-emitting diode using a ZnO-nanowire array grown on p-GaN thin film. Adv Mater 21: 2767.
- Shen G, Cho JH, Yoo JK, Yi GC, Lee CJ (2005) Synthesis and optical properties of S-doped ZnO nanostructures: Nanonails Nanowires. J Phys Chem B 109: 5491.
- Mu J, Guo Z, Che H (2016) Electrospinning of C-doped ZnO nanofibers with high visible-light photocatalytic activity. J Sol-Gel Sci Technol 78: 3925.
- Lavand AB, Malghe YS (2015) Visible light photocatalytic degradation of 4-chlorophenol using C/ZnO/CdS nanocomposite. J Saudi Chem Society 19: 471.
- Kawabata K, Nanai Y, Kimura S, Okuno T (2012) Fabrication of ZnO nanoparticles by laser ablation of sintered ZnO in aqueous solution. Appl Phys A 107: 6745.
- Yuan X, Xua W, Huanga F, Cheng D, Wei Q (2016) Polyester fabric coated with Ag/ZnO composite film by magnetron sputtering. App Surface Sci 390: 863.
- Kaushika VK, Mukherjeeb C, Gangulic T, Sena PK (2016) Material characterizations of Al:ZnO thin films grown by aerosol assisted chemical vapour deposition. J Alloys Compd 689: 1028.
- Raghu P, Srinatha N, Naveen CS, Mahesh HM, Angadi B (2017) Investigation on the effect of Al concentration on the structural, optical and electrical properties of spin coated Al:ZnO thin films. J Alloys Compd 694: 68.
- Rahman MA, Phillips MR, Ton-That C (2017) Efficient multi-coloured Li-doped ZnO thin films fabricated by spray pyrolysis. J Alloys Compd 691: 339.
- Bargabas A, Alshammari A, Abpud MF, Kosslick H (2013) Room-temperature synthesis of zinc oxide nanoparticles in different media and their application in cyanide photo degradation. Nanoscale Res Lett 8: 516.
- Giri PK, Bhattacharyya S, Singh DK, Kesavamoorthy R, Panigrahi BK, et al. Correlation between microstructure and optical properties of ZnO nanostructures synthesized by ball milling. J Appl Phy 102: 0935151.
- Fonoberov AV, Balandin AA (2006) ZnO quantum dos: Physical properties and Optoelectrionic applications. J Nanoelectr Optoelectr 1: 19.
- Manjon FJ, Mari B, Serrano J, Romero AH (2005) Silent Raman modes in zinc oxide and related nitrides. J Appl Phy 97: 053516.
- Tzolov M, Tzenov N, Dimova-Malinovska D, Kalitzova M, Pizzuto C, et al. (2000) Vibrational properties and structure of undoped and Al-doped ZnO films deposited by RF magnetron sputtering. Thin Solid Films 379: 396.
- Tzolov M, Tzenov N, Dimova-Malinovska D, Kalitzova M, Pizzuto C, et al. (2001) Modification of the structure of ZnO:Al films by control of the plasma parameters. Thin Solid Films 396: 274.
- Kumar Y, Sahai A, Mendez SFO, Goswami N, Argarwal V (2016) Morphological transformation in cobalt doped zinc oxide nanostructures: effect of doping concentration. Ceramics International 42: 5184.
- Goswami N, Sahai A (2013) Structural transformation in nickel doped zinc oxide nanostructures. Mater Res Bull 48: 346.
- Kayaci F, Vempati S, Donmez I, Biyiklia N, Uyar T (2014) Role of zinc interstitials and oxygen vacancies of ZnO in photocatalysis: A bottom-up approach to control defect density. Nanoscale 6: 10224.